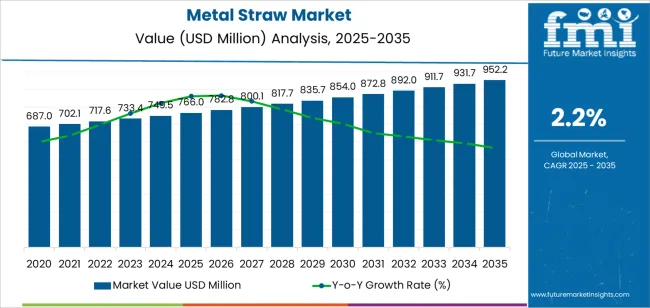
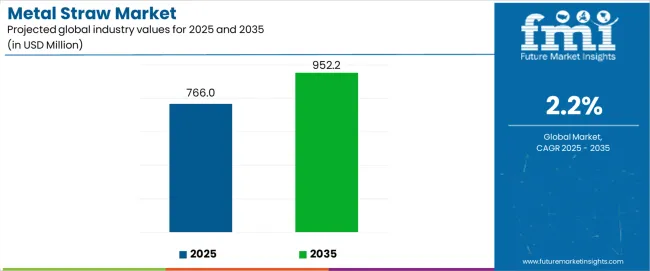
The global metal straw market size is anticipated to be worth USD 931.8 million by 2034. According to the estimates, the market is projected to clock a 2.2% CAGR until 2034. In 2024, the metal straw market size is valued at USD 749.5 million.
Attributes | Details |
---|---|
Metal Straw Market Size, 2023 | USD 727.1 million |
Metal Straw Market Size, 2024 | USD 749.5 million |
Metal Straw Market Size, 2034 | USD 931.8 million |
Value CAGR (2024 to 2034) | 2.2% |
Rising Emphasis on Hygiene and Safety Boosts Sales of Metal Straws
Easy-to-clean and maintain items are in high demand among customers as concerns about safety and hygiene continue to rise. Manufacturers of metal straws are addressing customer needs by providing dishwasher-safe and sanitary choices that guarantee the highest standards of safety and cleanliness.
Businesses can improve product attractiveness, establish customer trust, and reduce perceived dangers associated with reusable items by prioritizing features that satisfy consumer concerns about safety and cleanliness.
Proliferation of Social Media Platforms Act as a Pivotal Growth Catalyst
Social media platforms are becoming effective tools for influencing consumers' attitudes, tastes, and decisions. Influencers and celebrities are powerful figures who shape the behavior of their followers and are essential in setting trends and consumer preferences.
Metal straw manufacturers take advantage of influencers' wide audience and active participation by using social media channels to highlight endorsements and advocacy for metal straws. This helps to increase brand awareness, boost demand, and reinforce brand messages.
Businesses Aim to Capture Luxury and Premium Audiences
The rise of luxury and premium collections aimed at affluent clients is an important catalyst in the metal straw industry. These elegant metal straws have customizing options, elaborate patterns, and high-quality materials. This trend targets consumers looking for high-end, environmentally friendly lifestyle options by leveraging the convergence of sustainability and luxury.
Businesses can penetrate a niche market, charge higher prices, and uphold the notion that luxury and sustainability coexist by providing premium metal straw collections. This trend allows companies to portray themselves as purveyors of upscale, eco-friendly items and corresponds with the rising demand for sustainable luxury goods.
Trends |
|
---|---|
Opportunities |
|
Challenges |
|
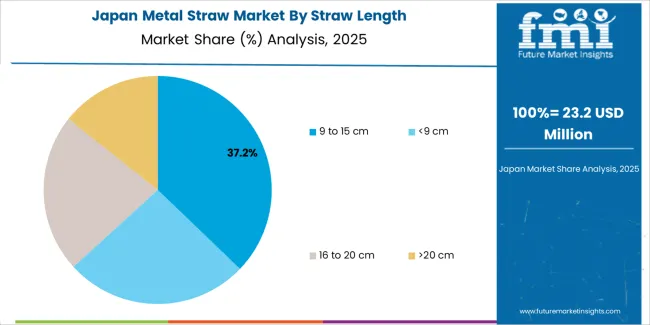
Segment | 9 to 15 cm (Straw Length) |
---|---|
Value Share (2024) | 44.9% |
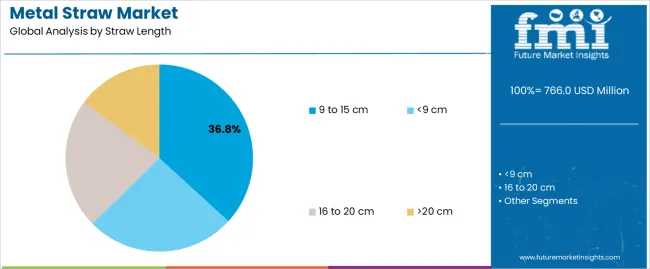
Based on straw length, the 9 to 15 cm segment holds 44.9% of metal straw market shares in 2024.
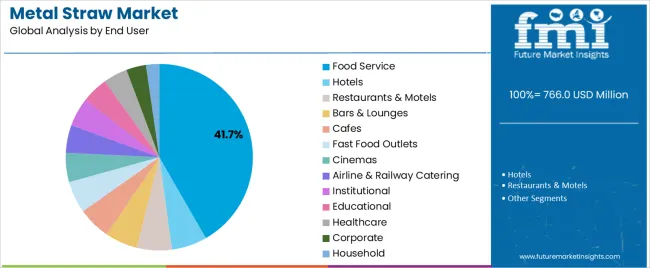
Segment | Food Service (End User) |
---|---|
Value Share (2024) | 82.4% |
Based on end user, the food service segment holds 82.4% of metal straw market shares in 2024.
Countries | Value CAGR (2024 to 2034) |
---|---|
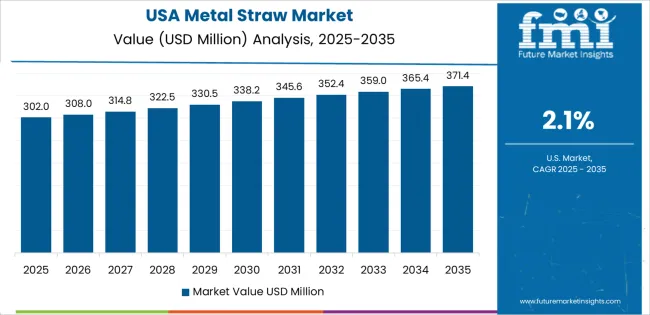
United States | 0.6% |
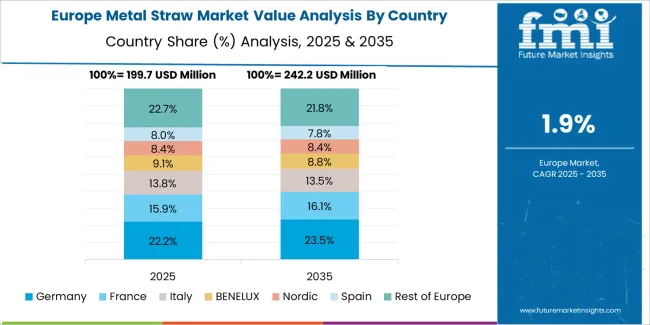
Germany | 0.7% |
Japan | 1.1% |
China | 4.0% |
India | 4.9% |
The demand for metal straws in the United States is anticipated to rise at a 0.6% CAGR through 2034.
The sales of metal straws in Germany are predicted to increase at a 0.7% CAGR through 2034.
Metal straw market growth in Japan is estimated at a 1.1% CAGR through 2034.
Metal straw demand in China is projected to amplify at a 4.0% CAGR through 2034.
Metal straw sales in India are anticipated to rise at a 4.9% CAGR through 2034.
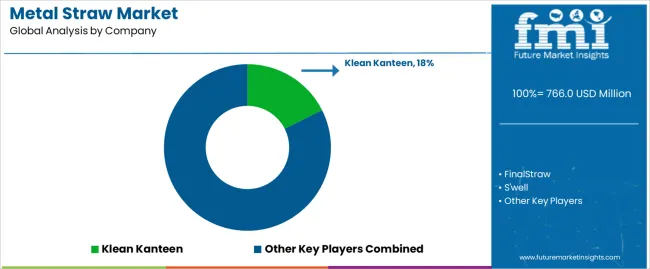
The metal straw market is competitive, with many companies contending for market dominance in the fast-increasing sustainable goods sector. Established companies like Klean Kanteen, S'well, and FinalStraw use their worldwide reach and brand familiarity to exert dominance.
These businesses frequently use extensive marketing techniques, highlighting the environmental friendliness of their metal straws and the lifestyle and prestige connected with their products.
In parallel, many specialized companies and startups, such as Ecostraw, Buluh Straws, and Hummingbird Glass Straws, add to the competitive dynamism.
Recent Development
In January 2024, MiiR introduced the All Day Straw Cup, the latest addition to their drinkware portfolio. This revolutionary stainless steel cup has a design-forward aesthetic and demonstrates the brand's dedication to responsible production.
Table 1: Global Market Value (US$ Million) Forecast by Region, 2019 to 2034
Table 2: Global Market Volume (Units Pack) Forecast by Region, 2019 to 2034
Table 3: Global Market Value (US$ Million) Forecast by Straw Length, 2019 to 2034
Table 4: Global Market Volume (Units Pack) Forecast by Straw Length, 2019 to 2034
Table 5: Global Market Value (US$ Million) Forecast by Sales Channel, 2019 to 2034
Table 6: Global Market Volume (Units Pack) Forecast by Sales Channel, 2019 to 2034
Table 7: Global Market Value (US$ Million) Forecast by End User, 2019 to 2034
Table 8: Global Market Volume (Units Pack) Forecast by End User, 2019 to 2034
Table 9: North America Market Value (US$ Million) Forecast by Country, 2019 to 2034
Table 10: North America Market Volume (Units Pack) Forecast by Country, 2019 to 2034
Table 11: North America Market Value (US$ Million) Forecast by Straw Length, 2019 to 2034
Table 12: North America Market Volume (Units Pack) Forecast by Straw Length, 2019 to 2034
Table 13: North America Market Value (US$ Million) Forecast by Sales Channel, 2019 to 2034
Table 14: North America Market Volume (Units Pack) Forecast by Sales Channel, 2019 to 2034
Table 15: North America Market Value (US$ Million) Forecast by End User, 2019 to 2034
Table 16: North America Market Volume (Units Pack) Forecast by End User, 2019 to 2034
Table 17: Latin America Market Value (US$ Million) Forecast by Country, 2019 to 2034
Table 18: Latin America Market Volume (Units Pack) Forecast by Country, 2019 to 2034
Table 19: Latin America Market Value (US$ Million) Forecast by Straw Length, 2019 to 2034
Table 20: Latin America Market Volume (Units Pack) Forecast by Straw Length, 2019 to 2034
Table 21: Latin America Market Value (US$ Million) Forecast by Sales Channel, 2019 to 2034
Table 22: Latin America Market Volume (Units Pack) Forecast by Sales Channel, 2019 to 2034
Table 23: Latin America Market Value (US$ Million) Forecast by End User, 2019 to 2034
Table 24: Latin America Market Volume (Units Pack) Forecast by End User, 2019 to 2034
Table 25: Western Europe Market Value (US$ Million) Forecast by Country, 2019 to 2034
Table 26: Western Europe Market Volume (Units Pack) Forecast by Country, 2019 to 2034
Table 27: Western Europe Market Value (US$ Million) Forecast by Straw Length, 2019 to 2034
Table 28: Western Europe Market Volume (Units Pack) Forecast by Straw Length, 2019 to 2034
Table 29: Western Europe Market Value (US$ Million) Forecast by Sales Channel, 2019 to 2034
Table 30: Western Europe Market Volume (Units Pack) Forecast by Sales Channel, 2019 to 2034
Table 31: Western Europe Market Value (US$ Million) Forecast by End User, 2019 to 2034
Table 32: Western Europe Market Volume (Units Pack) Forecast by End User, 2019 to 2034
Table 33: Eastern Europe Market Value (US$ Million) Forecast by Country, 2019 to 2034
Table 34: Eastern Europe Market Volume (Units Pack) Forecast by Country, 2019 to 2034
Table 35: Eastern Europe Market Value (US$ Million) Forecast by Straw Length, 2019 to 2034
Table 36: Eastern Europe Market Volume (Units Pack) Forecast by Straw Length, 2019 to 2034
Table 37: Eastern Europe Market Value (US$ Million) Forecast by Sales Channel, 2019 to 2034
Table 38: Eastern Europe Market Volume (Units Pack) Forecast by Sales Channel, 2019 to 2034
Table 39: Eastern Europe Market Value (US$ Million) Forecast by End User, 2019 to 2034
Table 40: Eastern Europe Market Volume (Units Pack) Forecast by End User, 2019 to 2034
Table 41: South Asia and Pacific Market Value (US$ Million) Forecast by Country, 2019 to 2034
Table 42: South Asia and Pacific Market Volume (Units Pack) Forecast by Country, 2019 to 2034
Table 43: South Asia and Pacific Market Value (US$ Million) Forecast by Straw Length, 2019 to 2034
Table 44: South Asia and Pacific Market Volume (Units Pack) Forecast by Straw Length, 2019 to 2034
Table 45: South Asia and Pacific Market Value (US$ Million) Forecast by Sales Channel, 2019 to 2034
Table 46: South Asia and Pacific Market Volume (Units Pack) Forecast by Sales Channel, 2019 to 2034
Table 47: South Asia and Pacific Market Value (US$ Million) Forecast by End User, 2019 to 2034
Table 48: South Asia and Pacific Market Volume (Units Pack) Forecast by End User, 2019 to 2034
Table 49: East Asia Market Value (US$ Million) Forecast by Country, 2019 to 2034
Table 50: East Asia Market Volume (Units Pack) Forecast by Country, 2019 to 2034
Table 51: East Asia Market Value (US$ Million) Forecast by Straw Length, 2019 to 2034
Table 52: East Asia Market Volume (Units Pack) Forecast by Straw Length, 2019 to 2034
Table 53: East Asia Market Value (US$ Million) Forecast by Sales Channel, 2019 to 2034
Table 54: East Asia Market Volume (Units Pack) Forecast by Sales Channel, 2019 to 2034
Table 55: East Asia Market Value (US$ Million) Forecast by End User, 2019 to 2034
Table 56: East Asia Market Volume (Units Pack) Forecast by End User, 2019 to 2034
Table 57: Middle East and Africa Market Value (US$ Million) Forecast by Country, 2019 to 2034
Table 58: Middle East and Africa Market Volume (Units Pack) Forecast by Country, 2019 to 2034
Table 59: Middle East and Africa Market Value (US$ Million) Forecast by Straw Length, 2019 to 2034
Table 60: Middle East and Africa Market Volume (Units Pack) Forecast by Straw Length, 2019 to 2034
Table 61: Middle East and Africa Market Value (US$ Million) Forecast by Sales Channel, 2019 to 2034
Table 62: Middle East and Africa Market Volume (Units Pack) Forecast by Sales Channel, 2019 to 2034
Table 63: Middle East and Africa Market Value (US$ Million) Forecast by End User, 2019 to 2034
Table 64: Middle East and Africa Market Volume (Units Pack) Forecast by End User, 2019 to 2034
Figure 1: Global Market Value (US$ Million) by Straw Length, 2024 to 2034
Figure 2: Global Market Value (US$ Million) by Sales Channel, 2024 to 2034
Figure 3: Global Market Value (US$ Million) by End User, 2024 to 2034
Figure 4: Global Market Value (US$ Million) by Region, 2024 to 2034
Figure 5: Global Market Value (US$ Million) Analysis by Region, 2019 to 2034
Figure 6: Global Market Volume (Units Pack) Analysis by Region, 2019 to 2034
Figure 7: Global Market Value Share (%) and BPS Analysis by Region, 2024 to 2034
Figure 8: Global Market Y-o-Y Growth (%) Projections by Region, 2024 to 2034
Figure 9: Global Market Value (US$ Million) Analysis by Straw Length, 2019 to 2034
Figure 10: Global Market Volume (Units Pack) Analysis by Straw Length, 2019 to 2034
Figure 11: Global Market Value Share (%) and BPS Analysis by Straw Length, 2024 to 2034
Figure 12: Global Market Y-o-Y Growth (%) Projections by Straw Length, 2024 to 2034
Figure 13: Global Market Value (US$ Million) Analysis by Sales Channel, 2019 to 2034
Figure 14: Global Market Volume (Units Pack) Analysis by Sales Channel, 2019 to 2034
Figure 15: Global Market Value Share (%) and BPS Analysis by Sales Channel, 2024 to 2034
Figure 16: Global Market Y-o-Y Growth (%) Projections by Sales Channel, 2024 to 2034
Figure 17: Global Market Value (US$ Million) Analysis by End User, 2019 to 2034
Figure 18: Global Market Volume (Units Pack) Analysis by End User, 2019 to 2034
Figure 19: Global Market Value Share (%) and BPS Analysis by End User, 2024 to 2034
Figure 20: Global Market Y-o-Y Growth (%) Projections by End User, 2024 to 2034
Figure 21: Global Market Attractiveness by Straw Length, 2024 to 2034
Figure 22: Global Market Attractiveness by Sales Channel, 2024 to 2034
Figure 23: Global Market Attractiveness by End User, 2024 to 2034
Figure 24: Global Market Attractiveness by Region, 2024 to 2034
Figure 25: North America Market Value (US$ Million) by Straw Length, 2024 to 2034
Figure 26: North America Market Value (US$ Million) by Sales Channel, 2024 to 2034
Figure 27: North America Market Value (US$ Million) by End User, 2024 to 2034
Figure 28: North America Market Value (US$ Million) by Country, 2024 to 2034
Figure 29: North America Market Value (US$ Million) Analysis by Country, 2019 to 2034
Figure 30: North America Market Volume (Units Pack) Analysis by Country, 2019 to 2034
Figure 31: North America Market Value Share (%) and BPS Analysis by Country, 2024 to 2034
Figure 32: North America Market Y-o-Y Growth (%) Projections by Country, 2024 to 2034
Figure 33: North America Market Value (US$ Million) Analysis by Straw Length, 2019 to 2034
Figure 34: North America Market Volume (Units Pack) Analysis by Straw Length, 2019 to 2034
Figure 35: North America Market Value Share (%) and BPS Analysis by Straw Length, 2024 to 2034
Figure 36: North America Market Y-o-Y Growth (%) Projections by Straw Length, 2024 to 2034
Figure 37: North America Market Value (US$ Million) Analysis by Sales Channel, 2019 to 2034
Figure 38: North America Market Volume (Units Pack) Analysis by Sales Channel, 2019 to 2034
Figure 39: North America Market Value Share (%) and BPS Analysis by Sales Channel, 2024 to 2034
Figure 40: North America Market Y-o-Y Growth (%) Projections by Sales Channel, 2024 to 2034
Figure 41: North America Market Value (US$ Million) Analysis by End User, 2019 to 2034
Figure 42: North America Market Volume (Units Pack) Analysis by End User, 2019 to 2034
Figure 43: North America Market Value Share (%) and BPS Analysis by End User, 2024 to 2034
Figure 44: North America Market Y-o-Y Growth (%) Projections by End User, 2024 to 2034
Figure 45: North America Market Attractiveness by Straw Length, 2024 to 2034
Figure 46: North America Market Attractiveness by Sales Channel, 2024 to 2034
Figure 47: North America Market Attractiveness by End User, 2024 to 2034
Figure 48: North America Market Attractiveness by Country, 2024 to 2034
Figure 49: Latin America Market Value (US$ Million) by Straw Length, 2024 to 2034
Figure 50: Latin America Market Value (US$ Million) by Sales Channel, 2024 to 2034
Figure 51: Latin America Market Value (US$ Million) by End User, 2024 to 2034
Figure 52: Latin America Market Value (US$ Million) by Country, 2024 to 2034
Figure 53: Latin America Market Value (US$ Million) Analysis by Country, 2019 to 2034
Figure 54: Latin America Market Volume (Units Pack) Analysis by Country, 2019 to 2034
Figure 55: Latin America Market Value Share (%) and BPS Analysis by Country, 2024 to 2034
Figure 56: Latin America Market Y-o-Y Growth (%) Projections by Country, 2024 to 2034
Figure 57: Latin America Market Value (US$ Million) Analysis by Straw Length, 2019 to 2034
Figure 58: Latin America Market Volume (Units Pack) Analysis by Straw Length, 2019 to 2034
Figure 59: Latin America Market Value Share (%) and BPS Analysis by Straw Length, 2024 to 2034
Figure 60: Latin America Market Y-o-Y Growth (%) Projections by Straw Length, 2024 to 2034
Figure 61: Latin America Market Value (US$ Million) Analysis by Sales Channel, 2019 to 2034
Figure 62: Latin America Market Volume (Units Pack) Analysis by Sales Channel, 2019 to 2034
Figure 63: Latin America Market Value Share (%) and BPS Analysis by Sales Channel, 2024 to 2034
Figure 64: Latin America Market Y-o-Y Growth (%) Projections by Sales Channel, 2024 to 2034
Figure 65: Latin America Market Value (US$ Million) Analysis by End User, 2019 to 2034
Figure 66: Latin America Market Volume (Units Pack) Analysis by End User, 2019 to 2034
Figure 67: Latin America Market Value Share (%) and BPS Analysis by End User, 2024 to 2034
Figure 68: Latin America Market Y-o-Y Growth (%) Projections by End User, 2024 to 2034
Figure 69: Latin America Market Attractiveness by Straw Length, 2024 to 2034
Figure 70: Latin America Market Attractiveness by Sales Channel, 2024 to 2034
Figure 71: Latin America Market Attractiveness by End User, 2024 to 2034
Figure 72: Latin America Market Attractiveness by Country, 2024 to 2034
Figure 73: Western Europe Market Value (US$ Million) by Straw Length, 2024 to 2034
Figure 74: Western Europe Market Value (US$ Million) by Sales Channel, 2024 to 2034
Figure 75: Western Europe Market Value (US$ Million) by End User, 2024 to 2034
Figure 76: Western Europe Market Value (US$ Million) by Country, 2024 to 2034
Figure 77: Western Europe Market Value (US$ Million) Analysis by Country, 2019 to 2034
Figure 78: Western Europe Market Volume (Units Pack) Analysis by Country, 2019 to 2034
Figure 79: Western Europe Market Value Share (%) and BPS Analysis by Country, 2024 to 2034
Figure 80: Western Europe Market Y-o-Y Growth (%) Projections by Country, 2024 to 2034
Figure 81: Western Europe Market Value (US$ Million) Analysis by Straw Length, 2019 to 2034
Figure 82: Western Europe Market Volume (Units Pack) Analysis by Straw Length, 2019 to 2034
Figure 83: Western Europe Market Value Share (%) and BPS Analysis by Straw Length, 2024 to 2034
Figure 84: Western Europe Market Y-o-Y Growth (%) Projections by Straw Length, 2024 to 2034
Figure 85: Western Europe Market Value (US$ Million) Analysis by Sales Channel, 2019 to 2034
Figure 86: Western Europe Market Volume (Units Pack) Analysis by Sales Channel, 2019 to 2034
Figure 87: Western Europe Market Value Share (%) and BPS Analysis by Sales Channel, 2024 to 2034
Figure 88: Western Europe Market Y-o-Y Growth (%) Projections by Sales Channel, 2024 to 2034
Figure 89: Western Europe Market Value (US$ Million) Analysis by End User, 2019 to 2034
Figure 90: Western Europe Market Volume (Units Pack) Analysis by End User, 2019 to 2034
Figure 91: Western Europe Market Value Share (%) and BPS Analysis by End User, 2024 to 2034
Figure 92: Western Europe Market Y-o-Y Growth (%) Projections by End User, 2024 to 2034
Figure 93: Western Europe Market Attractiveness by Straw Length, 2024 to 2034
Figure 94: Western Europe Market Attractiveness by Sales Channel, 2024 to 2034
Figure 95: Western Europe Market Attractiveness by End User, 2024 to 2034
Figure 96: Western Europe Market Attractiveness by Country, 2024 to 2034
Figure 97: Eastern Europe Market Value (US$ Million) by Straw Length, 2024 to 2034
Figure 98: Eastern Europe Market Value (US$ Million) by Sales Channel, 2024 to 2034
Figure 99: Eastern Europe Market Value (US$ Million) by End User, 2024 to 2034
Figure 100: Eastern Europe Market Value (US$ Million) by Country, 2024 to 2034
Figure 101: Eastern Europe Market Value (US$ Million) Analysis by Country, 2019 to 2034
Figure 102: Eastern Europe Market Volume (Units Pack) Analysis by Country, 2019 to 2034
Figure 103: Eastern Europe Market Value Share (%) and BPS Analysis by Country, 2024 to 2034
Figure 104: Eastern Europe Market Y-o-Y Growth (%) Projections by Country, 2024 to 2034
Figure 105: Eastern Europe Market Value (US$ Million) Analysis by Straw Length, 2019 to 2034
Figure 106: Eastern Europe Market Volume (Units Pack) Analysis by Straw Length, 2019 to 2034
Figure 107: Eastern Europe Market Value Share (%) and BPS Analysis by Straw Length, 2024 to 2034
Figure 108: Eastern Europe Market Y-o-Y Growth (%) Projections by Straw Length, 2024 to 2034
Figure 109: Eastern Europe Market Value (US$ Million) Analysis by Sales Channel, 2019 to 2034
Figure 110: Eastern Europe Market Volume (Units Pack) Analysis by Sales Channel, 2019 to 2034
Figure 111: Eastern Europe Market Value Share (%) and BPS Analysis by Sales Channel, 2024 to 2034
Figure 112: Eastern Europe Market Y-o-Y Growth (%) Projections by Sales Channel, 2024 to 2034
Figure 113: Eastern Europe Market Value (US$ Million) Analysis by End User, 2019 to 2034
Figure 114: Eastern Europe Market Volume (Units Pack) Analysis by End User, 2019 to 2034
Figure 115: Eastern Europe Market Value Share (%) and BPS Analysis by End User, 2024 to 2034
Figure 116: Eastern Europe Market Y-o-Y Growth (%) Projections by End User, 2024 to 2034
Figure 117: Eastern Europe Market Attractiveness by Straw Length, 2024 to 2034
Figure 118: Eastern Europe Market Attractiveness by Sales Channel, 2024 to 2034
Figure 119: Eastern Europe Market Attractiveness by End User, 2024 to 2034
Figure 120: Eastern Europe Market Attractiveness by Country, 2024 to 2034
Figure 121: South Asia and Pacific Market Value (US$ Million) by Straw Length, 2024 to 2034
Figure 122: South Asia and Pacific Market Value (US$ Million) by Sales Channel, 2024 to 2034
Figure 123: South Asia and Pacific Market Value (US$ Million) by End User, 2024 to 2034
Figure 124: South Asia and Pacific Market Value (US$ Million) by Country, 2024 to 2034
Figure 125: South Asia and Pacific Market Value (US$ Million) Analysis by Country, 2019 to 2034
Figure 126: South Asia and Pacific Market Volume (Units Pack) Analysis by Country, 2019 to 2034
Figure 127: South Asia and Pacific Market Value Share (%) and BPS Analysis by Country, 2024 to 2034
Figure 128: South Asia and Pacific Market Y-o-Y Growth (%) Projections by Country, 2024 to 2034
Figure 129: South Asia and Pacific Market Value (US$ Million) Analysis by Straw Length, 2019 to 2034
Figure 130: South Asia and Pacific Market Volume (Units Pack) Analysis by Straw Length, 2019 to 2034
Figure 131: South Asia and Pacific Market Value Share (%) and BPS Analysis by Straw Length, 2024 to 2034
Figure 132: South Asia and Pacific Market Y-o-Y Growth (%) Projections by Straw Length, 2024 to 2034
Figure 133: South Asia and Pacific Market Value (US$ Million) Analysis by Sales Channel, 2019 to 2034
Figure 134: South Asia and Pacific Market Volume (Units Pack) Analysis by Sales Channel, 2019 to 2034
Figure 135: South Asia and Pacific Market Value Share (%) and BPS Analysis by Sales Channel, 2024 to 2034
Figure 136: South Asia and Pacific Market Y-o-Y Growth (%) Projections by Sales Channel, 2024 to 2034
Figure 137: South Asia and Pacific Market Value (US$ Million) Analysis by End User, 2019 to 2034
Figure 138: South Asia and Pacific Market Volume (Units Pack) Analysis by End User, 2019 to 2034
Figure 139: South Asia and Pacific Market Value Share (%) and BPS Analysis by End User, 2024 to 2034
Figure 140: South Asia and Pacific Market Y-o-Y Growth (%) Projections by End User, 2024 to 2034
Figure 141: South Asia and Pacific Market Attractiveness by Straw Length, 2024 to 2034
Figure 142: South Asia and Pacific Market Attractiveness by Sales Channel, 2024 to 2034
Figure 143: South Asia and Pacific Market Attractiveness by End User, 2024 to 2034
Figure 144: South Asia and Pacific Market Attractiveness by Country, 2024 to 2034
Figure 145: East Asia Market Value (US$ Million) by Straw Length, 2024 to 2034
Figure 146: East Asia Market Value (US$ Million) by Sales Channel, 2024 to 2034
Figure 147: East Asia Market Value (US$ Million) by End User, 2024 to 2034
Figure 148: East Asia Market Value (US$ Million) by Country, 2024 to 2034
Figure 149: East Asia Market Value (US$ Million) Analysis by Country, 2019 to 2034
Figure 150: East Asia Market Volume (Units Pack) Analysis by Country, 2019 to 2034
Figure 151: East Asia Market Value Share (%) and BPS Analysis by Country, 2024 to 2034
Figure 152: East Asia Market Y-o-Y Growth (%) Projections by Country, 2024 to 2034
Figure 153: East Asia Market Value (US$ Million) Analysis by Straw Length, 2019 to 2034
Figure 154: East Asia Market Volume (Units Pack) Analysis by Straw Length, 2019 to 2034
Figure 155: East Asia Market Value Share (%) and BPS Analysis by Straw Length, 2024 to 2034
Figure 156: East Asia Market Y-o-Y Growth (%) Projections by Straw Length, 2024 to 2034
Figure 157: East Asia Market Value (US$ Million) Analysis by Sales Channel, 2019 to 2034
Figure 158: East Asia Market Volume (Units Pack) Analysis by Sales Channel, 2019 to 2034
Figure 159: East Asia Market Value Share (%) and BPS Analysis by Sales Channel, 2024 to 2034
Figure 160: East Asia Market Y-o-Y Growth (%) Projections by Sales Channel, 2024 to 2034
Figure 161: East Asia Market Value (US$ Million) Analysis by End User, 2019 to 2034
Figure 162: East Asia Market Volume (Units Pack) Analysis by End User, 2019 to 2034
Figure 163: East Asia Market Value Share (%) and BPS Analysis by End User, 2024 to 2034
Figure 164: East Asia Market Y-o-Y Growth (%) Projections by End User, 2024 to 2034
Figure 165: East Asia Market Attractiveness by Straw Length, 2024 to 2034
Figure 166: East Asia Market Attractiveness by Sales Channel, 2024 to 2034
Figure 167: East Asia Market Attractiveness by End User, 2024 to 2034
Figure 168: East Asia Market Attractiveness by Country, 2024 to 2034
Figure 169: Middle East and Africa Market Value (US$ Million) by Straw Length, 2024 to 2034
Figure 170: Middle East and Africa Market Value (US$ Million) by Sales Channel, 2024 to 2034
Figure 171: Middle East and Africa Market Value (US$ Million) by End User, 2024 to 2034
Figure 172: Middle East and Africa Market Value (US$ Million) by Country, 2024 to 2034
Figure 173: Middle East and Africa Market Value (US$ Million) Analysis by Country, 2019 to 2034
Figure 174: Middle East and Africa Market Volume (Units Pack) Analysis by Country, 2019 to 2034
Figure 175: Middle East and Africa Market Value Share (%) and BPS Analysis by Country, 2024 to 2034
Figure 176: Middle East and Africa Market Y-o-Y Growth (%) Projections by Country, 2024 to 2034
Figure 177: Middle East and Africa Market Value (US$ Million) Analysis by Straw Length, 2019 to 2034
Figure 178: Middle East and Africa Market Volume (Units Pack) Analysis by Straw Length, 2019 to 2034
Figure 179: Middle East and Africa Market Value Share (%) and BPS Analysis by Straw Length, 2024 to 2034
Figure 180: Middle East and Africa Market Y-o-Y Growth (%) Projections by Straw Length, 2024 to 2034
Figure 181: Middle East and Africa Market Value (US$ Million) Analysis by Sales Channel, 2019 to 2034
Figure 182: Middle East and Africa Market Volume (Units Pack) Analysis by Sales Channel, 2019 to 2034
Figure 183: Middle East and Africa Market Value Share (%) and BPS Analysis by Sales Channel, 2024 to 2034
Figure 184: Middle East and Africa Market Y-o-Y Growth (%) Projections by Sales Channel, 2024 to 2034
Figure 185: Middle East and Africa Market Value (US$ Million) Analysis by End User, 2019 to 2034
Figure 186: Middle East and Africa Market Volume (Units Pack) Analysis by End User, 2019 to 2034
Figure 187: Middle East and Africa Market Value Share (%) and BPS Analysis by End User, 2024 to 2034
Figure 188: Middle East and Africa Market Y-o-Y Growth (%) Projections by End User, 2024 to 2034
Figure 189: Middle East and Africa Market Attractiveness by Straw Length, 2024 to 2034
Figure 190: Middle East and Africa Market Attractiveness by Sales Channel, 2024 to 2034
Figure 191: Middle East and Africa Market Attractiveness by End User, 2024 to 2034
Figure 192: Middle East and Africa Market Attractiveness by Country, 2024 to 2034
The metal straw market is valued at USD 749.5 million in 2024.
The metal straw market size is estimated to increase at a 2.2% CAGR through 2034.
The metal straw market is anticipated to be worth USD 931.8 million by 2034.
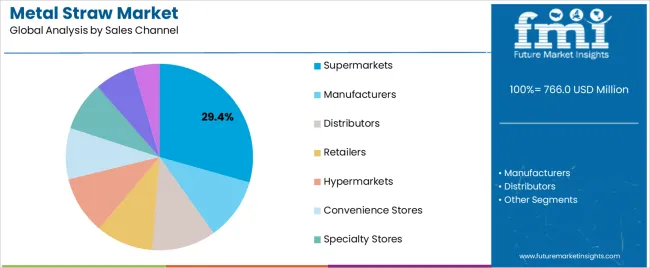
Food service sector creates a high demand in the market.
The metal straw market in India is predicted to rise at a 4.9% CAGR through 2034.
Explore Similar Insights
Thank you!
You will receive an email from our Business Development Manager. Please be sure to check your SPAM/JUNK folder too.