Metal Lug Cap Market Size, Share, and Forecast Outlook 2025 to 2035

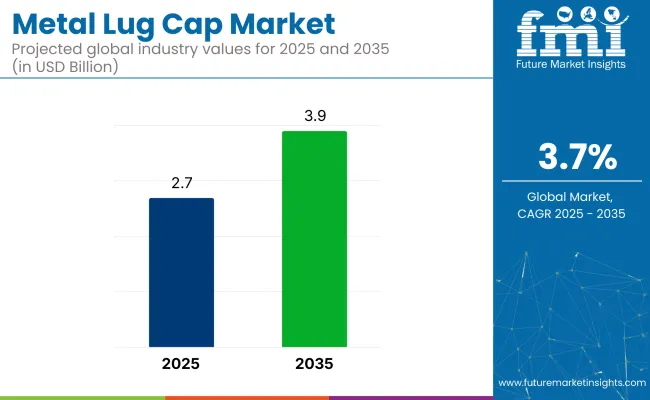
In 2025, the global metal lug cap market is valued at USD 2.7 billion and is projected to grow to USD 3.9 billion by 2035, expanding at a CAGR of 3.7%. Metal screw caps are threaded metal closures widely used to seal jars, bottles, and containers across the food, beverage, and pharmaceutical industries.
Quick Stats of Metal Lug Cap Market

  • Market Value (2025): USD 2.7 billion
  • Forecast Value (2035): USD 3.9 billion
  • Market Analysis CAGR: 3.7%
  • Leading Material in 2025: Tinplate (48% share)
  • Key End-Use Segment: Food and Beverages (66.2% share)
  • Key Growth Region: Asia Pacific (China, India)

Metal Lug Cap Market

Metric Value
Market Value (2025) USD 2.7 billion
Forecast Value (2035) USD 3.9 billion
Market Analysis CAGR 3.7%

Unlike basic crown caps, lug caps offer resealability and tamper evidence, making them ideal for packaging sauces, spreads, beverages, and medicinal liquids. Growth is driven by rising consumer demand for convenience, A growing focus on recyclable materials and expansion in processed food and beverage sectors.

The metal lug cap market has been characterized by a focused share across its parent sectors. Within the broader caps and closures market, a share of approximately 2-3% has been attributed to metal screw caps, as their use has been limited to specific applications compared to more common closures such as screw caps or flip tops.

In the metal caps and closures category, their share has been estimated at around 5-6%,supported by their durability and recyclability. In food and beverage packaging closures, a share of roughly 7-9% has been recorded, particularly for products such as jams, sauces, and pickles requiring vacuum-tight seals.

In pharmaceutical packaging closures, a modest share of 3-4% has been maintained, mainly for containers with tamper-evident features. In the recyclable packaging segment, around 4-5% of the share has been contributed by metal screw caps, reflecting growing demand for eco-friendly formats.

Brandon Bach, President of Consumer Convenience Technologies (CCT), underscored the need for innovation in the closure industry, where 80% of the industry still relies on traditional lug lids. He introduced the EEASY Lid, the first aluminum lug-style closure designed to replace heavier, harder-to-open steel versions. This lid reduces the force required to open jars by about 40%, making it more accessible to all consumers.

Additionally, aluminum’s recyclability and lighter weight support green goals. The EEASY Lid reflects a growing industry shift toward eco-friendly, user-centric packaging. By addressing both environmental impact and ease of use, CCT positions itself as a leader in the evolving metal screw cap focused on next-generation, consumer-friendly solutions.

Analysis of Metal Lug Caps Market by Top Investment Segments

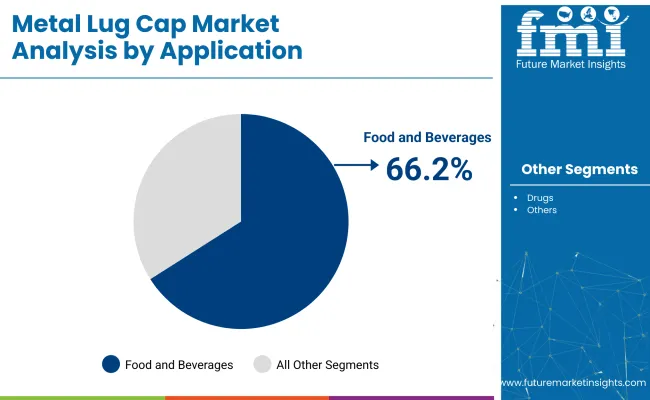
In 2025, the metal lug caps market is dominated by tinplate in the material segment, holding a 48% share due to its affordability, barrier protection, and recyclability. Food and beverages lead end-use demand at 66.2%, supported by high usage in sauces, condiments, and ready-to-drink products requiring vacuum sealing, tamper resistance, and resealability across global food processing industries.

Tinplate and Aluminum Compete as Closure Materials

Tinplate accounts for 48% of the material segment in 2025 owing to its low cost, ease of printing and excellent barrier properties.
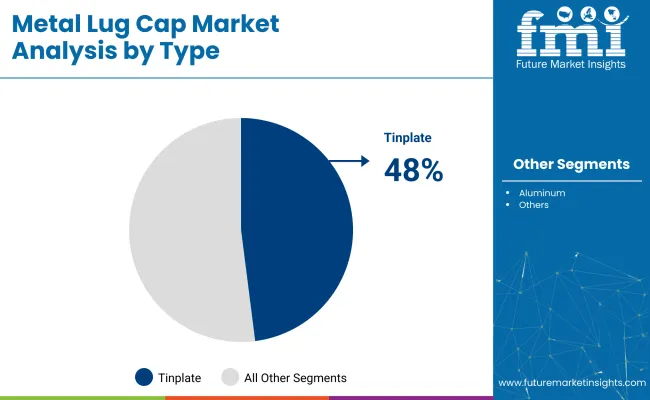
  • Tinplate dominates the industry, particularly in canned foods, sauces, and condiments, due to its food-grade coatings that ensure product safety and shelf stability, as well as its recyclability.
  • Aluminum holds approximately 35% of the industry, favored for its lightweight properties in beverage and specialty applications, while other materials like steel alloys and composite laminates cater to niche needs.
  • As the demand for eco-friendly packaging increases, tinplate producers are focusing on eco-friendly coating technologies, lightweight designs, and advanced barrier coatings, ensuring tinplate's continued leadership through 2035, while aluminum and specialty materials gain ground in premium segments.

Metal Lug Cap Market Analysis By Type

Food and Beverage Industry Drives Lug Cap Usage

Food and beverages dominate end-use applications at 66.2% in 2025, driven by rising consumption of packaged foods, sauces, condiments and ready-to-drink beverages.
  • Metal lug caps are favored by manufacturers for their ability to preserve freshness, resist tampering, and enable resealing, with increased use in premium beverages like craft beers and cold-pressed juices in Europe and North America.
  • The pharmaceutical sector remains the second largest end-use, as metal screw caps ensure tamper evidence and regulatory compliance, while the cosmetics and personal care sector is also growing due to their use in secure closures for lotions, creams, and oils.
  • The demand is being driven by rapid urbanization and the expansion of food processing industries in developing regions., while customization features like embossed logos, tamper-evident bands, and specialty coatings will further boost metal screw cap adoption in various sectors.

Metal Lug Cap Market Analysis By Application

Top Metal Lug Cap Market Dynamics

Demand for metal lug caps is strong, fueled by rising packaged food consumption and food safety regulations. Challenges include raw material price volatility and alternative closures, while innovations in barrier coatings and alloys present growth opportunities amid regulatory pressure.

Processed Food Boom Fuels Lug Cap Adoption Globally

The adoption of metal screw caps has been driven by the global expansion of processed and packaged food industries. Demand has been reinforced by stringent safety regulations and the need for resealable, tamper-resistant closures in beverages, sauces, and condiments, particularly within premium and specialty food segments across developed and developing regions.

  • Custom coating technologies are being developed in collaboration with lug cap manufacturers to enhance shelf-life and branding.
  • In-store visibility and packaging differentiation are being improved through embossed and color-coated lug cap formats.
  • Metal screw cap usage is being extended to value-added grocery items distributed via online retail and direct-to-consumer platforms.

Raw Material Volatility Limits Manufacturer Profit Margins

Volatility in raw material prices has been limiting manufacturer margins, especially for steel and aluminium used in metal screw caps. Tariff shifts and trade-related disruptions have been affecting tinplate and aluminum coil availability. Regulatory demands for food-grade coatings have increased production complexity and costs across global markets.
  • Tariff uncertainties and sourcing issues have disrupted supply stability for tinplate and aluminum.
  • Regulatory compliance for coatings has increased processing time and cost burden.
  • Competing closure systems with lower initial costs are being adopted in price-sensitive segments.

Analyzing Leading Countries Driving Production and Usage of Metal Lug Caps

Country Wise Analysis Of Metal Lug Cap Market Cagr 2025 To 2035

Countries CAGR (2025 to 2035)
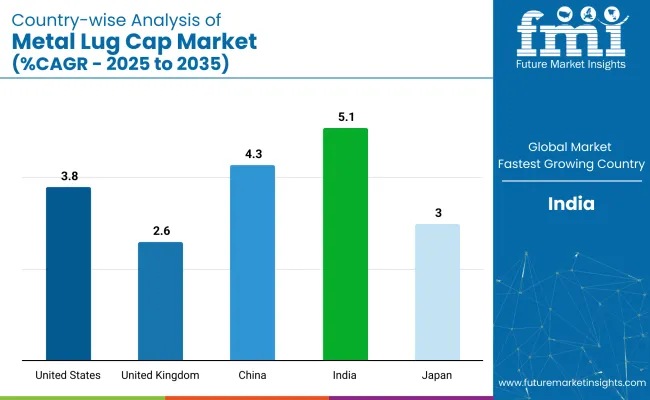
United States 3.8%
United Kingdom 2.6%
China 4.3%
India 5.1%
Japan 3%

OECD producers of metal lug caps are projected to grow at an average CAGR of 3.1% between 2025 and 2035. The United States is expected to expand at 3.8%, supported by growth in automated food-canning lines and the rise of craft-preserve brands. Japan’s 3.0% pace is shaped by ongoing upgrades in condiment-filling infrastructure. The United Kingdom, with a slower 2.6% rate, reflects flat demand tied to plateauing glass-jar usage.

In BRICS, performance is expected to outpace the global 3.7% average. China is forecasted at 4.3%, as production is scaled through export-focused glass-jar manufacturing and high-speed capping lines. India leads with 5.1%, driven by facility additions for sauces, pickles, and dairy ghee, underpinned by metal-packaging incentives and rising demand for sealed food formats.

The report covers detailed analysis of 40+ countries and the top five countries have been shared as a reference.

An Overview of United States Metal Lug Cap Market Growth

The United States metal lug cap industry is expected to grow at a CAGR of 3.8% from 2025 to 2035. The expanding food and beverage sector, requiring packaging solutions that maintain product integrity and longevity, is a primary driver of growth for metal screw caps.

Increasing demand for secure, tamper-evident packaging in pharmaceuticals and consumer goods further contributes to the rise in metal screw cap demand.Innovations in metal screw cap designs, offering enhanced sealing properties and environmental advantages, alongside significant investments in packaging technology, are accelerating expansion.

  • BPA-free coatings are being introduced to meet regulatory and consumer safety expectations.
  • Lightweight cap designs are being adopted to reduce material usage without compromising seal strength.
  • Automation-friendly threading formats are being developed to support high-speed filling lines.

United Kingdom Metal Lug Cap Market Analysis and Growth

The UK metal lug cap industry is projected to grow at a CAGR of 2.6% from 2025 to 2035. Steady demand from the food, beverage, and pharmaceutical sectors is contributing to growth, with metal screw caps being recognised for their effectiveness in sealing, tamper-evidence, and long shelf-life assurance.

Consumer preference for secure and reliable packaging formats continues to reinforce their adoption across retail categories. Ongoing innovations in the UK packaging landscape. A shift toward recyclable and lightweight metal componentis expected to further constant market expansion.

  • Recyclable metal alloys are being adopted to meet eco-regulatory compliance.
  • Tamper-evident band enhancements are being developed for improved shelf appeal and security.
  • Compatibility with vacuum-sealing and pasteurisation processes is being prioritised for multipurpose use.

In-Depth Analysis of China Metal Lug Cap Market Growth

The industry in China is projected to grow at a CAGR of 4.3% from 2025 to 2035. Growth is being supported by the country's large-scale manufacturing infrastructure and rising packaged food consumption. Metal screw caps are being increasingly adopted to ensure product safety, longer shelf life, and regulatory compliance across both domestic and export markets.

Technological advancements in automated sealing lines and eco-efficient metal processing are expected to endure momentum, as packaging upgrades continue across food, beverage, and healthcare sectors.

  • High-speed capping machinery is being integrated to support mass-scale bottling and jar filling.
  • Domestic brands are prioritising lug caps with advanced sealing coatings for high-acid and hot-fill products.
  • Export-focused suppliers are aligning with global food safety standards through certified cap formats.

An Overview of India Metal Lug Cap Market Growth

The industry in India is expected to grow at a CAGR of 5.1% from 2025 to 2035. Rising consumption of packaged food, beverages, and over-the-counter pharmaceuticals is driving demand for reliable sealing solutions like metal screw caps.

These closures are being preferred for their compatibility with hot-fill processes, tamper evidence, and ability to maintain product freshness during storage and transport. Growth is also being supported by local manufacturing expansion and government incentives for improved packaging infrastructure.

  • Cap designs compatible with automation are being adopted by mid-sized food processors.
  • Indigenous cap production is being scaled to reduce import dependency and improve cost efficiency.
  • Hot-fill and vacuum-compatible variants are being tailored for sauces, pickles, and ready-to-eat categories.

Japan Metal Lug Cap Market Analysis and Growth

The industry in Japan is projected to grow at a CAGR of 3.0% from 2025 to 2035. Growth is being supported by the country’s advanced manufacturing capabilities and emphasis on high-performance packaging. Metal screw caps are being widely utilised in food, beverage, and pharmaceutical applications, where quality retention and tamper resistance are critical.

With constant investment in precision engineering and eco-efficient packaging lines, Japan is expected to maintain consistent adoption of metal screw caps across multiple sectors.
  • Compact, lightweight cap variants are being engineered to meet space-saving retail requirements.
  • Pharmaceutical-grade lug caps with anti-counterfeit features are being deployed in clinical packaging.
  • Robotics-integrated sealing systems are being introduced to improve packaging throughput and accuracy.

Top Metal Lug Cap Suppliers

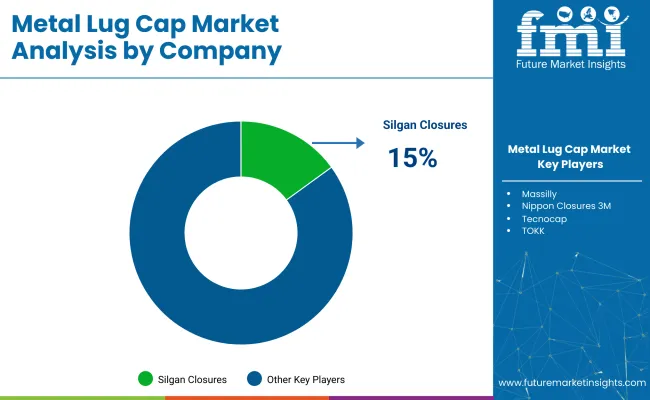
Metal Lug Cap Market Analysis By Company

The industry is characterized by a mix of established key players and emerging entrants. Companies such as Glasspack, Massilly, and Tecnocap Group are known for their extensive product portfolios and global reach, which enable them to dominate market share. These players often focus on product innovation and robust research and development strategies.

For example, Tecnocap Group frequently invests in new designs for enhanced functionality, while Massilly has been expanding its product offerings through strategic acquisitions. Additionally, players like The Cary Company and Burch Bottle & Packaging leverage their strong distribution networks to enhance industry penetration.

Emerging players, such as KAMELLIA ENTERPRISE CO., LTD and Maxwell Packaging Bottle Solution, are introducing new technologies, emphasizing cost-effective manufacturing and niche product development. The industry sees occasional consolidation, with larger companies acquiring smaller ones to strengthen their presence in industry.

Entry barriers include high capital investment, stringent regulations, and competition from alternative packaging solutions, making it a fragmented yet competitive space.

Recent Industry News

  • In February 2025, Hoffmann Neopac AG signed a definitive agreement to sell the assets of its tin business to Massilly Group. This transaction marks a strategic divestment by Hoffmann Neopac, enabling a sharper focus on its core tube packaging operations. The acquisition strengthens Massilly’s position in metal packaging across Europe.
  • In September 2024, Tecnocap participated in the Gulfood Manufacturing Expo held in Dubai, presenting its latest innovations in food packaging. The event served as a global platform for Tecnocap to highlight new developments in lug cap technology aimed at enhancing closure integrity and branding.

Report Scope of the Market

Report Attributes Details
Market Size (2025) USD 2.7 billion
Projected Market Size (2035) USD 3.9 billion
CAGR (2025 to 2035) 3.7%
Base Year for Estimation 2024
Historical Period 2020 to 2024
Projections Period 2025 to 2035
Quantitative Units USD billion for value and million units for volume
Types Analyzed (Segment 1) Tinplate, Aluminum, Others
Applications Analyzed (Segment 2) Food and Beverages, Drugs, Others
Regions Covered North America; Latin America; Western Europe; Eastern Europe; South Asia and Pacific; East Asia; Middle East and Africa
Countries Covered United States, Canada, Mexico, Brazil, Argentina, Germany, France, United Kingdom, Italy, Spain, Netherlands, China, Japan, South Korea, India, Indonesia, Vietnam, Thailand, Australia, UAE, Saudi Arabia, South Africa
Key Players Influencing the Market Glasspack, Massilly, Tecnocap Group, The Cary Company, KAMELLIA ENTERPRISE CO., LTD, Burch Bottle & Packaging, GUDEX, Elmoris, Taiwan Hon Chuan, Gebrüder Leonhardt GmbH & Co., and Maxwell Packaging Bottle Solution
Additional Attributes Tinplate dominates with highest dollar sales; food & beverage sector holds majority share; rising demand for tamper-proof sealing; Asia leads in production volume; automation driving cap manufacturing efficiency

Leading Players in Metal Lug Cap Market

  • Glasspack
  • Massilly
  • Tecnocap Group
  • The Cary Company
  • KAMELLIA ENTERPRISE CO., LTD
  • Burch Bottle & Packaging
  • GUDEX
  • Elmoris
  • Taiwan Hon Chuan
  • Gebrüder Leonhardt GmbH & Co.
  • Maxwell Packaging Bottle Solution

Metal Lug Cap Industry Analyzed by Key Investment Segments

By Type:

The industry is segmented into Tinplate, aluminum, and others.

By Application:

The industry is segmented into Food and beverages, drugs, and others.

By Region:

The market covers North America, Latin America, Western Europe, Eastern Europe, South Asia and Pacific, East Asia, and Middle East and Africa.

Table of Content

  1. Executive Summary
    • Global Market Outlook
    • Demand-side Trends
    • Supply-side Trends
    • Technology Roadmap Analysis
    • Analysis and Recommendations
  2. Market Overview
    • Market Coverage / Taxonomy
    • Market Definition / Scope / Limitations
  3. Market Background
    • Market Dynamics
      • Drivers
      • Restraints
      • Opportunity
      • Trends
    • Scenario Forecast
      • Demand in Optimistic Scenario
      • Demand in Likely Scenario
      • Demand in Conservative Scenario
    • Opportunity Map Analysis
    • Product Life Cycle Analysis
    • Supply Chain Analysis
      • Supply Side Participants and their Roles
        • Producers
        • Mid-Level Participants (Traders/ Agents/ Brokers)
        • Wholesalers and Distributors
      • Value Added and Value Created at Node in the Supply Chain
      • List of Raw Material Suppliers
      • List of Existing and Potential Buyer’s
    • Investment Feasibility Matrix
    • Value Chain Analysis
      • Profit Margin Analysis
      • Wholesalers and Distributors
      • Retailers
    • PESTLE and Porter’s Analysis
    • Regulatory Landscape
      • By Key Regions
      • By Key Countries
    • Regional Parent Market Outlook
    • Production and Consumption Statistics
    • Import and Export Statistics
  4. Global Market Analysis 2020 to 2024 and Forecast, 2025 to 2035
    • Historical Market Size Value (USD Billion) & Volume (Million Units) Analysis, 2020 to 2024
    • Current and Future Market Size Value (USD Billion) & Volume (Million Units) Projections, 2025 to 2035
      • Y-o-Y Growth Trend Analysis
      • Absolute $ Opportunity Analysis
  5. Global Market Pricing Analysis 2020 to 2024 and Forecast 2025 to 2035
  6. Global Market Analysis 2020 to 2024 and Forecast 2025 to 2035, By Type
    • Introduction / Key Findings
    • Historical Market Size Value (USD Billion) & Volume (Million Units) Analysis By Type, 2020 to 2024
    • Current and Future Market Size Value (USD Billion) & Volume (Million Units) Analysis and Forecast By Type, 2025 to 2035
      • Tinplate
      • Aluminum
      • Others
    • Y-o-Y Growth Trend Analysis By Type, 2020 to 2024
    • Absolute $ Opportunity Analysis By Type, 2025 to 2035
  7. Global Market Analysis 2020 to 2024 and Forecast 2025 to 2035, By Application
    • Introduction / Key Findings
    • Historical Market Size Value (USD Billion) & Volume (Million Units) Analysis By Application, 2020 to 2024
    • Current and Future Market Size Value (USD Billion) & Volume (Million Units) Analysis and Forecast By Application, 2025 to 2035
      • Food and beverages
      • Drugs
      • Others
    • Y-o-Y Growth Trend Analysis By Application, 2020 to 2024
    • Absolute $ Opportunity Analysis By Application, 2025 to 2035
  8. Global Market Analysis 2020 to 2024 and Forecast 2025 to 2035, By Region
    • Introduction
    • Historical Market Size Value (USD Billion) & Volume (Million Units) Analysis By Region, 2020 to 2024
    • Current Market Size Value (USD Billion) & Volume (Million Units) Analysis and Forecast By Region, 2025 to 2035
      • North America
      • Latin America
      • Western Europe
      • Eastern Europe
      • East Asia
      • South Asia & Pacific
      • Middle East and Africa
    • Market Attractiveness Analysis By Region
  9. North America Market Analysis 2020 to 2024 and Forecast 2025 to 2035, By Country
    • Historical Market Size Value (USD Billion) & Volume (Million Units) Trend Analysis By Market Taxonomy, 2020 to 2024
    • Market Size Value (USD Billion) & Volume (Million Units) Forecast By Market Taxonomy, 2025 to 2035
      • By Country
        • USA
        • Canada
        • Mexico
      • By Type
      • By Application
    • Market Attractiveness Analysis
      • By Country
      • By Type
      • By Application
    • Key Takeaways
  10. Latin America Market Analysis 2020 to 2024 and Forecast 2025 to 2035, By Country
    • Historical Market Size Value (USD Billion) & Volume (Million Units) Trend Analysis By Market Taxonomy, 2020 to 2024
    • Market Size Value (USD Billion) & Volume (Million Units) Forecast By Market Taxonomy, 2025 to 2035
      • By Country
        • Brazil
        • Argentina
        • Rest of LATAM
      • By Type
      • By Application
    • Market Attractiveness Analysis
      • By Country
      • By Type
      • By Application
    • Key Takeaways
  11. Western Europe Market Analysis 2020 to 2024 and Forecast 2025 to 2035, By Country
    • Historical Market Size Value (USD Billion) & Volume (Million Units) Trend Analysis By Market Taxonomy, 2020 to 2024
    • Market Size Value (USD Billion) & Volume (Million Units) Forecast By Market Taxonomy, 2025 to 2035
      • By Country
        • Germany
        • Italy
        • France
        • UK
        • Spain
        • BENELUX
        • Nordic
        • Rest of W.Europe
      • By Type
      • By Application
    • Market Attractiveness Analysis
      • By Country
      • By Type
      • By Application
    • Key Takeaways
  12. Eastern Europe Market Analysis 2020 to 2024 and Forecast 2025 to 2035, By Country
    • Historical Market Size Value (USD Billion) & Volume (Million Units) Trend Analysis By Market Taxonomy, 2020 to 2024
    • Market Size Value (USD Billion) & Volume (Million Units) Forecast By Market Taxonomy, 2025 to 2035
      • By Country
        • Russia
        • Hungary
        • Poland
        • Balkan & Baltics
        • Rest of E. Europe
      • By Type
      • By Application
    • Market Attractiveness Analysis
      • By Country
      • By Type
      • By Application
    • Key Takeaways
  13. East Asia Market Analysis 2020 to 2024 and Forecast 2025 to 2035, By Country
    • Historical Market Size Value (USD Billion) & Volume (Million Units) Trend Analysis By Market Taxonomy, 2020 to 2024
    • Market Size Value (USD Billion) & Volume (Million Units) Forecast By Market Taxonomy, 2025 to 2035
      • By Country
        • China
        • Japan
        • South Korea
      • By Type
      • By Application
    • Market Attractiveness Analysis
      • By Country
      • By Type
      • By Application
    • Key Takeaways
  14. South Asia & Pacific Market Analysis 2020 to 2024 and Forecast 2025 to 2035, By Country
    • Historical Market Size Value (USD Billion) & Volume (Million Units) Trend Analysis By Market Taxonomy, 2020 to 2024
    • Market Size Value (USD Billion) & Volume (Million Units) Forecast By Market Taxonomy, 2025 to 2035
      • By Country
        • India
        • Australia & New Zealand
        • ASEAN
        • Rest of SAP
      • By Type
      • By Application
    • Market Attractiveness Analysis
      • By Country
      • By Type
      • By Application
    • Key Takeaways
  15. Middle East and Africa Market Analysis 2020 to 2024 and Forecast 2025 to 2035, By Country
    • Historical Market Size Value (USD Billion) & Volume (Million Units) Trend Analysis By Market Taxonomy, 2020 to 2024
    • Market Size Value (USD Billion) & Volume (Million Units) Forecast By Market Taxonomy, 2025 to 2035
      • By Country
        • GCC Countries
        • Northern Africa
        • South Africa
        • Turkiye
        • Rest of MEA
      • By Type
      • By Application
    • Market Attractiveness Analysis
      • By Country
      • By Type
      • By Application
    • Key Takeaways
  16. Key Countries Market Analysis
    • USA
      • Pricing Analysis
      • Market Share Analysis, 2024
        • By Type
        • By Application
    • Canada
      • Pricing Analysis
      • Market Share Analysis, 2024
        • By Type
        • By Application
    • Brazil
      • Pricing Analysis
      • Market Share Analysis, 2024
        • By Type
        • By Application
    • Mexico
      • Pricing Analysis
      • Market Share Analysis, 2024
        • By Type
        • By Application
    • Argentina
      • Pricing Analysis
      • Market Share Analysis, 2024
        • By Type
        • By Application
  17. Market Structure Analysis
    • Competition Dashboard
    • Competition Benchmarking
    • Market Share Analysis of Top Players
      • By Regional
      • By Type
      • By Application
  18. Competition Analysis
    • Competition Deep Dive
      • Glasspack
        • Overview
        • Product Portfolio
        • Profitability by Market Segments (Product/Age /Sales Channel/Region)
        • Sales Footprint
        • Strategy Overview
          • Marketing Strategy
          • Product Strategy
          • Channel Strategy
      • Massilly
        • Overview
        • Product Portfolio
        • Profitability by Market Segments (Product/Age /Sales Channel/Region)
        • Sales Footprint
        • Strategy Overview
          • Marketing Strategy
          • Product Strategy
          • Channel Strategy
      • Tecnocap Group
        • Overview
        • Product Portfolio
        • Profitability by Market Segments (Product/Age /Sales Channel/Region)
        • Sales Footprint
        • Strategy Overview
          • Marketing Strategy
          • Product Strategy
          • Channel Strategy
      • The Cary Company
        • Overview
        • Product Portfolio
        • Profitability by Market Segments (Product/Age /Sales Channel/Region)
        • Sales Footprint
        • Strategy Overview
          • Marketing Strategy
          • Product Strategy
          • Channel Strategy
      • KAMELLIA ENTERPRISE CO., LTD
        • Overview
        • Product Portfolio
        • Profitability by Market Segments (Product/Age /Sales Channel/Region)
        • Sales Footprint
        • Strategy Overview
          • Marketing Strategy
          • Product Strategy
          • Channel Strategy
      • Burch Bottle & Packaging
        • Overview
        • Product Portfolio
        • Profitability by Market Segments (Product/Age /Sales Channel/Region)
        • Sales Footprint
        • Strategy Overview
          • Marketing Strategy
          • Product Strategy
          • Channel Strategy
      • GUDEX
        • Overview
        • Product Portfolio
        • Profitability by Market Segments (Product/Age /Sales Channel/Region)
        • Sales Footprint
        • Strategy Overview
          • Marketing Strategy
          • Product Strategy
          • Channel Strategy
      • Elmoris
        • Overview
        • Product Portfolio
        • Profitability by Market Segments (Product/Age /Sales Channel/Region)
        • Sales Footprint
        • Strategy Overview
          • Marketing Strategy
          • Product Strategy
          • Channel Strategy
      • Taiwan Hon Chuan
        • Overview
        • Product Portfolio
        • Profitability by Market Segments (Product/Age /Sales Channel/Region)
        • Sales Footprint
        • Strategy Overview
          • Marketing Strategy
          • Product Strategy
          • Channel Strategy
      • Gebrüder Leonhardt GmbH & Co.
        • Overview
        • Product Portfolio
        • Profitability by Market Segments (Product/Age /Sales Channel/Region)
        • Sales Footprint
        • Strategy Overview
          • Marketing Strategy
          • Product Strategy
          • Channel Strategy
      • Maxwell Packaging Bottle Solution
        • Overview
        • Product Portfolio
        • Profitability by Market Segments (Product/Age /Sales Channel/Region)
        • Sales Footprint
        • Strategy Overview
          • Marketing Strategy
          • Product Strategy
          • Channel Strategy
  19. Assumptions & Acronyms Used
  20. Research Methodology

List of Tables

  • Table 1: Global Market Value (USD Billion) Forecast by Region, 2020 to 2035
  • Table 2: Global Market Volume (Million Units) Forecast by Region, 2020 to 2035
  • Table 3: Global Market Value (USD Billion) Forecast by Type, 2020 to 2035
  • Table 4: Global Market Volume (Million Units) Forecast by Type, 2020 to 2035
  • Table 5: Global Market Value (USD Billion) Forecast by Application, 2020 to 2035
  • Table 6: Global Market Volume (Million Units) Forecast by Application, 2020 to 2035
  • Table 7: North America Market Value (USD Billion) Forecast by Country, 2020 to 2035
  • Table 8: North America Market Volume (Million Units) Forecast by Country, 2020 to 2035
  • Table 9: North America Market Value (USD Billion) Forecast by Type, 2020 to 2035
  • Table 10: North America Market Volume (Million Units) Forecast by Type, 2020 to 2035
  • Table 11: North America Market Value (USD Billion) Forecast by Application, 2020 to 2035
  • Table 12: North America Market Volume (Million Units) Forecast by Application, 2020 to 2035
  • Table 13: Latin America Market Value (USD Billion) Forecast by Country, 2020 to 2035
  • Table 14: Latin America Market Volume (Million Units) Forecast by Country, 2020 to 2035
  • Table 15: Latin America Market Value (USD Billion) Forecast by Type, 2020 to 2035
  • Table 16: Latin America Market Volume (Million Units) Forecast by Type, 2020 to 2035
  • Table 17: Latin America Market Value (USD Billion) Forecast by Application, 2020 to 2035
  • Table 18: Latin America Market Volume (Million Units) Forecast by Application, 2020 to 2035
  • Table 19: Western Europe Market Value (USD Billion) Forecast by Country, 2020 to 2035
  • Table 20: Western Europe Market Volume (Million Units) Forecast by Country, 2020 to 2035
  • Table 21: Western Europe Market Value (USD Billion) Forecast by Type, 2020 to 2035
  • Table 22: Western Europe Market Volume (Million Units) Forecast by Type, 2020 to 2035
  • Table 23: Western Europe Market Value (USD Billion) Forecast by Application, 2020 to 2035
  • Table 24: Western Europe Market Volume (Million Units) Forecast by Application, 2020 to 2035
  • Table 25: Eastern Europe Market Value (USD Billion) Forecast by Country, 2020 to 2035
  • Table 26: Eastern Europe Market Volume (Million Units) Forecast by Country, 2020 to 2035
  • Table 27: Eastern Europe Market Value (USD Billion) Forecast by Type, 2020 to 2035
  • Table 28: Eastern Europe Market Volume (Million Units) Forecast by Type, 2020 to 2035
  • Table 29: Eastern Europe Market Value (USD Billion) Forecast by Application, 2020 to 2035
  • Table 30: Eastern Europe Market Volume (Million Units) Forecast by Application, 2020 to 2035
  • Table 31: East Asia Market Value (USD Billion) Forecast by Country, 2020 to 2035
  • Table 32: East Asia Market Volume (Million Units) Forecast by Country, 2020 to 2035
  • Table 33: East Asia Market Value (USD Billion) Forecast by Type, 2020 to 2035
  • Table 34: East Asia Market Volume (Million Units) Forecast by Type, 2020 to 2035
  • Table 35: East Asia Market Value (USD Billion) Forecast by Application, 2020 to 2035
  • Table 36: East Asia Market Volume (Million Units) Forecast by Application, 2020 to 2035
  • Table 37: South Asia & Pacific Market Value (USD Billion) Forecast by Country, 2020 to 2035
  • Table 38: South Asia & Pacific Market Volume (Million Units) Forecast by Country, 2020 to 2035
  • Table 39: South Asia & Pacific Market Value (USD Billion) Forecast by Type, 2020 to 2035
  • Table 40: South Asia & Pacific Market Volume (Million Units) Forecast by Type, 2020 to 2035
  • Table 41: South Asia & Pacific Market Value (USD Billion) Forecast by Application, 2020 to 2035
  • Table 42: South Asia & Pacific Market Volume (Million Units) Forecast by Application, 2020 to 2035
  • Table 43: Middle East and Africa Market Value (USD Billion) Forecast by Country, 2020 to 2035
  • Table 44: Middle East and Africa Market Volume (Million Units) Forecast by Country, 2020 to 2035
  • Table 45: Middle East and Africa Market Value (USD Billion) Forecast by Type, 2020 to 2035
  • Table 46: Middle East and Africa Market Volume (Million Units) Forecast by Type, 2020 to 2035
  • Table 47: Middle East and Africa Market Value (USD Billion) Forecast by Application, 2020 to 2035
  • Table 48: Middle East and Africa Market Volume (Million Units) Forecast by Application, 2020 to 2035

List of Figures

  • Figure 1: Global Market Volume (Million Units) Forecast 2020 to 2035
  • Figure 2: Global Market Pricing Analysis
  • Figure 3: Global Market Value (USD Billion) Forecast 2020 to 2035
  • Figure 4: Global Market Value Share and BPS Analysis by Type, 2025 and 2035
  • Figure 5: Global Market Y-o-Y Growth Comparison by Type, 2025 to 2035
  • Figure 6: Global Market Attractiveness Analysis by Type
  • Figure 7: Global Market Value Share and BPS Analysis by Application, 2025 and 2035
  • Figure 8: Global Market Y-o-Y Growth Comparison by Application, 2025 to 2035
  • Figure 9: Global Market Attractiveness Analysis by Application
  • Figure 10: Global Market Value (USD Billion) Share and BPS Analysis by Region, 2025 and 2035
  • Figure 11: Global Market Y-o-Y Growth Comparison by Region, 2025 to 2035
  • Figure 12: Global Market Attractiveness Analysis by Region
  • Figure 13: North America Market Incremental $ Opportunity, 2025 to 2035
  • Figure 14: Latin America Market Incremental $ Opportunity, 2025 to 2035
  • Figure 15: Western Europe Market Incremental $ Opportunity, 2025 to 2035
  • Figure 16: Eastern Europe Market Incremental $ Opportunity, 2025 to 2035
  • Figure 17: East Asia Market Incremental $ Opportunity, 2025 to 2035
  • Figure 18: South Asia & Pacific Market Incremental $ Opportunity, 2025 to 2035
  • Figure 19: Middle East and Africa Market Incremental $ Opportunity, 2025 to 2035
  • Figure 20: North America Market Value Share and BPS Analysis by Country, 2025 and 2035
  • Figure 21: North America Market Value Share and BPS Analysis by Type, 2025 and 2035
  • Figure 22: North America Market Y-o-Y Growth Comparison by Type, 2025 to 2035
  • Figure 23: North America Market Attractiveness Analysis by Type
  • Figure 24: North America Market Value Share and BPS Analysis by Application, 2025 and 2035
  • Figure 25: North America Market Y-o-Y Growth Comparison by Application, 2025 to 2035
  • Figure 26: North America Market Attractiveness Analysis by Application
  • Figure 27: Latin America Market Value Share and BPS Analysis by Country, 2025 and 2035
  • Figure 28: Latin America Market Value Share and BPS Analysis by Type, 2025 and 2035
  • Figure 29: Latin America Market Y-o-Y Growth Comparison by Type, 2025 to 2035
  • Figure 30: Latin America Market Attractiveness Analysis by Type
  • Figure 31: Latin America Market Value Share and BPS Analysis by Application, 2025 and 2035
  • Figure 32: Latin America Market Y-o-Y Growth Comparison by Application, 2025 to 2035
  • Figure 33: Latin America Market Attractiveness Analysis by Application
  • Figure 34: Western Europe Market Value Share and BPS Analysis by Country, 2025 and 2035
  • Figure 35: Western Europe Market Value Share and BPS Analysis by Type, 2025 and 2035
  • Figure 36: Western Europe Market Y-o-Y Growth Comparison by Type, 2025 to 2035
  • Figure 37: Western Europe Market Attractiveness Analysis by Type
  • Figure 38: Western Europe Market Value Share and BPS Analysis by Application, 2025 and 2035
  • Figure 39: Western Europe Market Y-o-Y Growth Comparison by Application, 2025 to 2035
  • Figure 40: Western Europe Market Attractiveness Analysis by Application
  • Figure 41: Eastern Europe Market Value Share and BPS Analysis by Country, 2025 and 2035
  • Figure 42: Eastern Europe Market Value Share and BPS Analysis by Type, 2025 and 2035
  • Figure 43: Eastern Europe Market Y-o-Y Growth Comparison by Type, 2025 to 2035
  • Figure 44: Eastern Europe Market Attractiveness Analysis by Type
  • Figure 45: Eastern Europe Market Value Share and BPS Analysis by Application, 2025 and 2035
  • Figure 46: Eastern Europe Market Y-o-Y Growth Comparison by Application, 2025 to 2035
  • Figure 47: Eastern Europe Market Attractiveness Analysis by Application
  • Figure 48: East Asia Market Value Share and BPS Analysis by Country, 2025 and 2035
  • Figure 49: East Asia Market Value Share and BPS Analysis by Type, 2025 and 2035
  • Figure 50: East Asia Market Y-o-Y Growth Comparison by Type, 2025 to 2035
  • Figure 51: East Asia Market Attractiveness Analysis by Type
  • Figure 52: East Asia Market Value Share and BPS Analysis by Application, 2025 and 2035
  • Figure 53: East Asia Market Y-o-Y Growth Comparison by Application, 2025 to 2035
  • Figure 54: East Asia Market Attractiveness Analysis by Application
  • Figure 55: South Asia & Pacific Market Value Share and BPS Analysis by Country, 2025 and 2035
  • Figure 56: South Asia & Pacific Market Value Share and BPS Analysis by Type, 2025 and 2035
  • Figure 57: South Asia & Pacific Market Y-o-Y Growth Comparison by Type, 2025 to 2035
  • Figure 58: South Asia & Pacific Market Attractiveness Analysis by Type
  • Figure 59: South Asia & Pacific Market Value Share and BPS Analysis by Application, 2025 and 2035
  • Figure 60: South Asia & Pacific Market Y-o-Y Growth Comparison by Application, 2025 to 2035
  • Figure 61: South Asia & Pacific Market Attractiveness Analysis by Application
  • Figure 62: Middle East and Africa Market Value Share and BPS Analysis by Country, 2025 and 2035
  • Figure 63: Middle East and Africa Market Value Share and BPS Analysis by Type, 2025 and 2035
  • Figure 64: Middle East and Africa Market Y-o-Y Growth Comparison by Type, 2025 to 2035
  • Figure 65: Middle East and Africa Market Attractiveness Analysis by Type
  • Figure 66: Middle East and Africa Market Value Share and BPS Analysis by Application, 2025 and 2035
  • Figure 67: Middle East and Africa Market Y-o-Y Growth Comparison by Application, 2025 to 2035
  • Figure 68: Middle East and Africa Market Attractiveness Analysis by Application
  • Figure 69: Global Market - Tier Structure Analysis
  • Figure 70: Global Market - Company Share Analysis

Frequently Asked Questions

What is the estimated size of the metal lug cap industry in 2025?

The industry is projected at USD 2.7 billion in 2025.

What is the estimated size of the metal lug cap industry in 2025 and 2035?

The industry is expected to reach USD 3.9 billion by 2035 at a CAGR of 3.7%.

Which material leads the metal lug cap industry in 2025?

The tinplate leads with 48% share.

Which end use dominates metal lug cap demand?

Food and beverages dominate at 66.2% share in 2025.

Which country is expected to grow fastest in the metal lug cap market?

India is projected to register the highest CAGR of 5.1% during 2025 to 2035.

Explore Similar Insights

Future Market Insights

Metal Lug Cap Market