Metal Polish Products Market Snapshot (2022 to 2032)

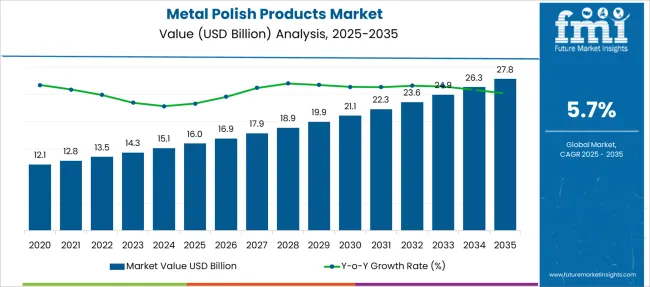
Metal polish products commerce is expected to display a CAGR of 5.7% while garnering a market value worth USD 23.5 Billion by the end of the forecast period from 2022 to 2032. As of 2021, the market was valued at USD 9.2 Billion and is poised to reflect a Y-o-Y growth rate worth 4% to reach USD 13.53 Billion in 2022.

Increasing usage of various metal alloys in machinery, furniture, and other metal products is expected to play a key role in strengthening the market during the forecast period.

Report Attributes Details
Expected Base Year Value (2021) USD 9.2 Billion
Projected Market Value (2022) USD 13.53 Billion
Anticipated Forecast Value (2032) USD 23.5 Billion
Estimated Growth Rate (2022 to 2032) 5.7%

A growing focus to enhance aesthetics is expected to increase demand for metal polish products during the forecast period. Increasing demand for metal furniture is anticipated to play a significant role in the coming period. With this, demand for premium-quality furniture has increased which is expected to benefit the industry in the coming period. The growing application of products like metallic benches and drawers for better aesthetics has boosted the market growth graph considerably.

Expanding furniture sector is likely to be a major consumer of metal polish products. Metal-based products witness significant demand in commercial gardens and playgrounds. Thus, increasing playground and garden infrastructural settings are projected to further drive market growth. In 2018, the Government of Australia announced the ‘The Monish Playground and Playspace Strategy 2020’, an initiative to develop garden parks and reserves in Monish, Australia. Such factors are expected to benefit the industry in the forecast period.

What are the Factors Positively Driving the Metal Polish Products Market?

Rising disposable income has resulted in an increased demand for luxurious and premium-quality furniture, which is projected to boost demand for metal polish products in the forecast period. Increasing adoption of cubicles and other corporate infrastructural settings is expected to grow demand for modern furniture, thus, growing demand for metal polish products during the forecast period.

Players in the industry are taking various initiatives to expand their footprint in other regions, which is expected to benefit the industry in the coming time. For instance, in 2020, BAXTER, a renowned Italian home fixture products company, along with its Indian supplier, Sources Unlimited, rolled out various luxurious and premium quality items in India. Such factors are expected to increase demand for metal polish products in the coming time.

Innovative methods to do marketing campaign is likely to offer exposure to the players, thereby, expanding market size in the forecast period. For instance, in October 2020, Inter IKEA Systems B.V. rolled out its regular Black Friday Sale campaign ‘buy-back’ across 27 countries to enhance its sales. Owing to such factors, the market is anticipated to expand significantly in the forecast period.

What are the Factors Impeding the Global Metal Polish Products Market?

Health issues associated while applying metal polish are expected to hinder the market growth in the forecast period. Metal polish poisoning is expected to hinder the market since it can cause problems with breathing, throat swelling, and others. Further, the growing popularity of using second-hand furniture is expected to impact the market severely in the forecast period.

However, the growing demand for metal polish in automobiles, cookware, architectural metal, and kitchenware is expected to boost demand for the product and thus, benefit the industry in the forecast period.

Why is Asia Projected to be the Most Lucrative Market?

Asia is anticipated to be the most lucrative market during the forecast period. The growth of the market can be attributed to the growing disposable income and the rapid development of various sectors such as furniture, automotive, and others. The presence of rapidly evolving countries such as India, China, Japan, and Indonesia is expected to make a notable contribution to strengthening the industry.

As per the USA Department of Agriculture, as of 2020, there were about 4,100 wood house furnishing products manufacturers in Guangdong, China. Such factors are likely to benefit the industry in Asia. Moreover, rapid industrialization in the region is expected to augment demand for metal polish, as the number of residents is expected to rise considerably in the forecast period.

Also, the development of the industrial sector will fuel demand for metal polish products in the forecast period. Owing to such factors, the market in Asia is expected to witness significant growth of the market in the forecast period.
What are the Growth Prospects in North America?

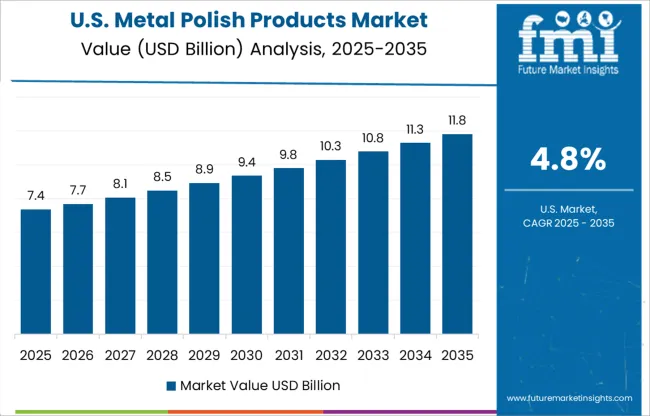
North America is projected to dominate the market in the forecast period. The domination of the region can be attributed to the active participation of developed countries such as the USA and Canada. Expansion of the furniture market in the region is expected to play a key role in driving the market growth.

Growing initiatives to expand players’ footprint in the market are expected to further strengthen the market. For instance, in 2018, Alibaba.com, a Chinese e-commerce giant, invested USD 2.88 Billion in furniture retailer EasyHome. EasyHome is a Canadian retailer business. Such initiatives are anticipated to boost demand for metal polish products in the forecast period.
Competition Analysis

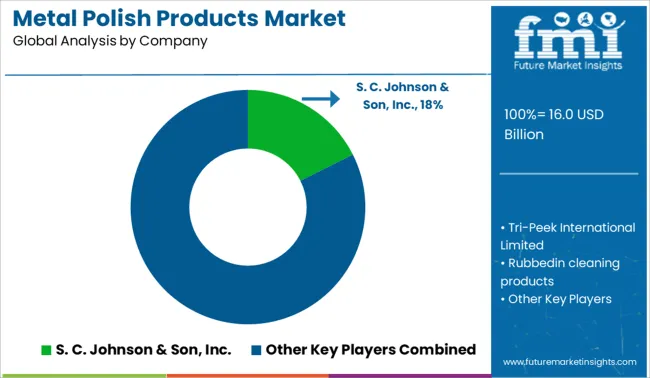
Key players in the global metal polish products market are Rubbedin Cleaning Products, Canadian Tire Corporation, Limited., California Custom Products Inc., Reckitt Benckiser Group PLC, S. C. Johnson & Son, Inc, Diversified Chemical Technologies, Inc., White Diamond Detail Product, Weiman Products, LLC., Wizards Products, Turtle Wax, Inc., Halfords Limited, Menzerna polishing compounds GmbH & Co. KG, Cyclo Industries, Inc., Renaissance, and White Diamond.

  • In 2021, Halfords Limited, the United Kingdom’s largest provider of motoring and cycling products, announced that it had signed a sale and purchase agreement to buy the entire share capital of Axle Group Holdings Ltd. The agreement is strategically and financially compelling, delivering on Halfords’ objective of developing into an institution inclining towards motoring services.

Report Scope

Report Attribute Details
Growth Rate 5.7% CAGR from 2022 to 2032
Base Year for Estimation 2021
Market Value in 2022 USD 13.53 Billion
Market Value in 2032 USD 23.5 Billion
Historical Data 2017 to 2021
Forecast Period 2022 to 2032
Quantitative Units USD Million for Value and CAGR from 2022 to 2032
Report Coverage Revenue Forecast, Volume Forecast, Company Ranking, Competitive Landscape, Growth Factors, Trends, and Pricing Analysis
Segments Covered Form Type, End User, Sales Channel, Region
Regions Covered North America; Latin America; Europe; East Asia; South Asia; Oceania; Middle East & Africa
Key Countries Profiled USA, Canada, Brazil, Mexico, Germany, France, United Kingdom, Italy, Russia, Spain, BENELUX, China, Japan, South Korea, India, Thailand, Malaysia, Indonesia, Australia, New Zealand, GCC Countries, South Africa, Turkey, Israel, Egypt
Key Companies Profiled Tri-Peek International Limited; Rubbedin Cleaning Products; Canadian Tire Corporation Limited; California Custom Products Inc.; Reckitt Benckiser Group PLC; S. C. Johnson & Son Inc.; Diversified Chemical Technologies, Inc.; White Diamond Detail Product; Weiman Products LLC.; Wizards Products; Turtle Wax Inc.; Halfords Limited; Menzerna Polishing Compounds GmbH Co. KG; Cyclo Industries Inc.; Renaissance
Customization Scope Available upon Request

Key Segments Profiled in the Global Metal Polish Products Market

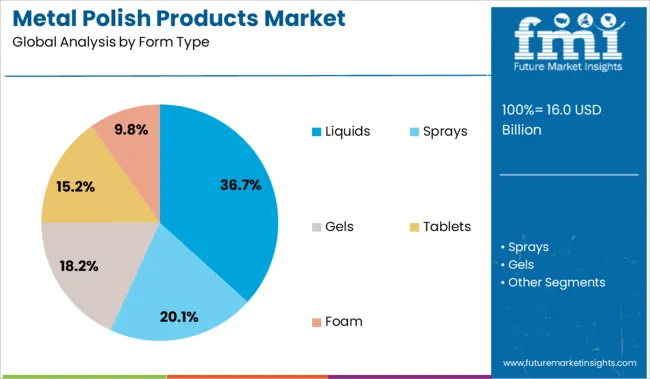
By Form Type:

  • Liquids
  • Sprays
  • Gels
  • Tablets
  • Foam

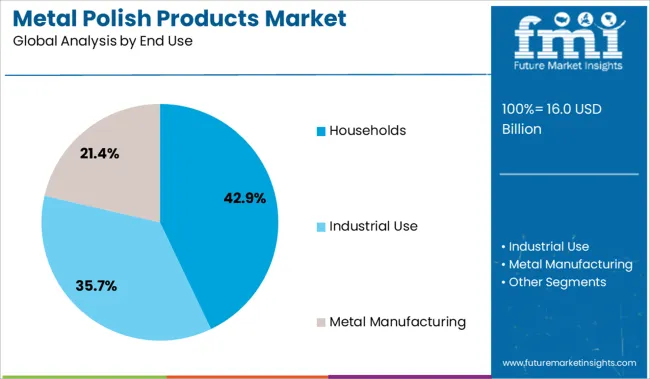
By End Use:

  • Households
  • Industrial Use
  • Metal Manufacturing

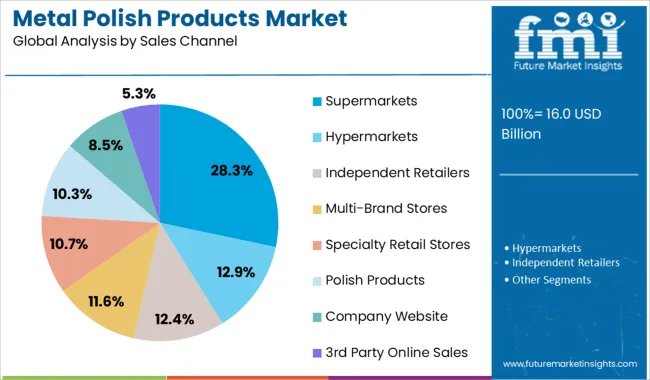
By Sales Channel:

  • Hypermarkets
  • Supermarkets
  • Independent Retailers
  • Multi-Brand Stores
  • Specialty Retail Stores
  • Polish Products
  • Company Website
  • 3rd Party Online Sales

By Region:

  • North America
  • Latin America
  • Europe
  • East Asia
  • Oceania
  • Middle East & Africa

Table of Content

  • 1. Executive Summary | Metal Polish Products Market
  • 2. Market Overview
  • 3. Market Background
  • 4. Global Market Analysis 2017 to 2021 and Forecast, 2022 to 2032
  • 5. Global Market Analysis 2017 to 2021 and Forecast 2022 to 2032, By Form Type
    • 5.1. Liquids
    • 5.2. Sprays
    • 5.3. Gels
    • 5.4. Tablets
    • 5.5. Foam
  • 6. Global Market Analysis 2017 to 2021 and Forecast 2022 to 2032, By End-use
    • 6.1. Households
    • 6.2. Industrial
    • 6.3. Metal Manufacturing
  • 7. Global Market Analysis 2017 to 2021 and Forecast 2022 to 2032, By Sales Channel
    • 7.1. Hypermarkets
    • 7.2. Supermarkets
    • 7.3. Independent Retailers
    • 7.4. Multi-Brand Stores
    • 7.5. Specialty Retail Stores
    • 7.6. Online Sales
    • 7.7. Company Website
    • 7.8. 3rd Party Online Sales
  • 8. Global Market Analysis 2017 to 2021 and Forecast 2022 to 2032, By Region
    • 8.1. North America
    • 8.2. Latin America
    • 8.3. Europe
    • 8.4. East Asia
    • 8.5. South Asia
    • 8.6. Oceania
    • 8.7. Middle East and Africa
  • 9. North America Market Analysis 2017 to 2021 and Forecast 2022 to 2032, By Country
  • 10. Latin America Market Analysis 2017 to 2021 and Forecast 2022 to 2032, By Country
  • 11. Europe Market Analysis 2017 to 2021 and Forecast 2022 to 2032, By Country
  • 12. East Asia Market Analysis 2017 to 2021 and Forecast 2022 to 2032, By Country
  • 13. South Asia Market Analysis 2017 to 2021 and Forecast 2022 to 2032, By Country
  • 14. Oceania Market Analysis 2017 to 2021 and Forecast 2022 to 2032, By Country
  • 15. Middle East and Africa Market Analysis 2017 to 2021 and Forecast 2022 to 2032, By Country
  • 16. Key Countries Market Analysis
  • 17. Market Structure Analysis
  • 18. Competition Analysis
    • 18.1. Tri-Peek International Limited
    • 18.2. Rubbedin cleaning products
    • 18.3. Canadian Tire Corporation, Limited.
    • 18.4. California Custom Products Inc.
    • 18.5. S. C. Johnson & Son, Inc.
    • 18.6. Diversified Chemical Technologies, Inc.
    • 18.7. White Diamond Detail Product
    • 18.8. Weiman Products, LLC.
    • 18.9. Wizards Products
    • 18.10. Turtle Wax, Inc.
    • 18.11. Halfords Limited
    • 18.12. Menzerna polishing compounds GmbH & Co. KG
    • 18.13. Cyclo Industries, Inc.
    • 18.14. Renaissance
    • 18.15. Reckitt Benckiser Group PLC
  • 19. Assumptions & Acronyms Used
  • 20. Research Methodology

List of Tables

Table 1: Global Market Value (US$ Million) Forecast by Region, 2017 to 2032

Table 2: Global Market Volume (Million Units) Forecast by Region, 2017 to 2032

Table 3: Global Market Value (US$ Million) Forecast by Form Type, 2017 to 2032

Table 4: Global Market Volume (Million Units) Forecast by Form Type, 2017 to 2032

Table 5: Global Market Value (US$ Million) Forecast by End-use, 2017 to 2032

Table 6: Global Market Volume (Million Units) Forecast by End-use, 2017 to 2032

Table 7: Global Market Value (US$ Million) Forecast by Sales Channel, 2017 to 2032

Table 8: Global Market Volume (Million Units) Forecast by Sales Channel, 2017 to 2032

Table 9: North America Market Value (US$ Million) Forecast by Country, 2017 to 2032

Table 10: North America Market Volume (Million Units) Forecast by Country, 2017 to 2032

Table 11: North America Market Value (US$ Million) Forecast by Form Type, 2017 to 2032

Table 12: North America Market Volume (Million Units) Forecast by Form Type, 2017 to 2032

Table 13: North America Market Value (US$ Million) Forecast by End-use, 2017 to 2032

Table 14: North America Market Volume (Million Units) Forecast by End-use, 2017 to 2032

Table 15: North America Market Value (US$ Million) Forecast by Sales Channel, 2017 to 2032

Table 16: North America Market Volume (Million Units) Forecast by Sales Channel, 2017 to 2032

Table 17: Latin America Market Value (US$ Million) Forecast by Country, 2017 to 2032

Table 18: Latin America Market Volume (Million Units) Forecast by Country, 2017 to 2032

Table 19: Latin America Market Value (US$ Million) Forecast by Form Type, 2017 to 2032

Table 20: Latin America Market Volume (Million Units) Forecast by Form Type, 2017 to 2032

Table 21: Latin America Market Value (US$ Million) Forecast by End-use, 2017 to 2032

Table 22: Latin America Market Volume (Million Units) Forecast by End-use, 2017 to 2032

Table 23: Latin America Market Value (US$ Million) Forecast by Sales Channel, 2017 to 2032

Table 24: Latin America Market Volume (Million Units) Forecast by Sales Channel, 2017 to 2032

Table 25: Europe Market Value (US$ Million) Forecast by Country, 2017 to 2032

Table 26: Europe Market Volume (Million Units) Forecast by Country, 2017 to 2032

Table 27: Europe Market Value (US$ Million) Forecast by Form Type, 2017 to 2032

Table 28: Europe Market Volume (Million Units) Forecast by Form Type, 2017 to 2032

Table 29: Europe Market Value (US$ Million) Forecast by End-use, 2017 to 2032

Table 30: Europe Market Volume (Million Units) Forecast by End-use, 2017 to 2032

Table 31: Europe Market Value (US$ Million) Forecast by Sales Channel, 2017 to 2032

Table 32: Europe Market Volume (Million Units) Forecast by Sales Channel, 2017 to 2032

Table 33: East Asia Market Value (US$ Million) Forecast by Country, 2017 to 2032

Table 34: East Asia Market Volume (Million Units) Forecast by Country, 2017 to 2032

Table 35: East Asia Market Value (US$ Million) Forecast by Form Type, 2017 to 2032

Table 36: East Asia Market Volume (Million Units) Forecast by Form Type, 2017 to 2032

Table 37: East Asia Market Value (US$ Million) Forecast by End-use, 2017 to 2032

Table 38: East Asia Market Volume (Million Units) Forecast by End-use, 2017 to 2032

Table 39: East Asia Market Value (US$ Million) Forecast by Sales Channel, 2017 to 2032

Table 40: East Asia Market Volume (Million Units) Forecast by Sales Channel, 2017 to 2032

Table 41: South Asia Market Value (US$ Million) Forecast by Country, 2017 to 2032

Table 42: South Asia Market Volume (Million Units) Forecast by Country, 2017 to 2032

Table 43: South Asia Market Value (US$ Million) Forecast by Form Type, 2017 to 2032

Table 44: South Asia Market Volume (Million Units) Forecast by Form Type, 2017 to 2032

Table 45: South Asia Market Value (US$ Million) Forecast by End-use, 2017 to 2032

Table 46: South Asia Market Volume (Million Units) Forecast by End-use, 2017 to 2032

Table 47: South Asia Market Value (US$ Million) Forecast by Sales Channel, 2017 to 2032

Table 48: South Asia Market Volume (Million Units) Forecast by Sales Channel, 2017 to 2032

Table 49: Oceania Market Value (US$ Million) Forecast by Country, 2017 to 2032

Table 50: Oceania Market Volume (Million Units) Forecast by Country, 2017 to 2032

Table 51: Oceania Market Value (US$ Million) Forecast by Form Type, 2017 to 2032

Table 52: Oceania Market Volume (Million Units) Forecast by Form Type, 2017 to 2032

Table 53: Oceania Market Value (US$ Million) Forecast by End-use, 2017 to 2032

Table 54: Oceania Market Volume (Million Units) Forecast by End-use, 2017 to 2032

Table 55: Oceania Market Value (US$ Million) Forecast by Sales Channel, 2017 to 2032

Table 56: Oceania Market Volume (Million Units) Forecast by Sales Channel, 2017 to 2032

Table 57: MEA Market Value (US$ Million) Forecast by Country, 2017 to 2032

Table 58: MEA Market Volume (Million Units) Forecast by Country, 2017 to 2032

Table 59: MEA Market Value (US$ Million) Forecast by Form Type, 2017 to 2032

Table 60: MEA Market Volume (Million Units) Forecast by Form Type, 2017 to 2032

Table 61: MEA Market Value (US$ Million) Forecast by End-use, 2017 to 2032

Table 62: MEA Market Volume (Million Units) Forecast by End-use, 2017 to 2032

Table 63: MEA Market Value (US$ Million) Forecast by Sales Channel, 2017 to 2032

Table 64: MEA Market Volume (Million Units) Forecast by Sales Channel, 2017 to 2032

List of Figures

Figure 1: Global Market Value (US$ Million) by Form Type, 2022 to 2032

Figure 2: Global Market Value (US$ Million) by End-use, 2022 to 2032

Figure 3: Global Market Value (US$ Million) by Sales Channel, 2022 to 2032

Figure 4: Global Market Value (US$ Million) by Region, 2022 to 2032

Figure 5: Global Market Value (US$ Million) Analysis by Region, 2017 to 2032

Figure 6: Global Market Volume (Million Units) Analysis by Region, 2017 to 2032

Figure 7: Global Market Value Share (%) and BPS Analysis by Region, 2022 to 2032

Figure 8: Global Market Y-o-Y Growth (%) Projections by Region, 2022 to 2032

Figure 9: Global Market Value (US$ Million) Analysis by Form Type, 2017 to 2032

Figure 10: Global Market Volume (Million Units) Analysis by Form Type, 2017 to 2032

Figure 11: Global Market Value Share (%) and BPS Analysis by Form Type, 2022 to 2032

Figure 12: Global Market Y-o-Y Growth (%) Projections by Form Type, 2022 to 2032

Figure 13: Global Market Value (US$ Million) Analysis by End-use, 2017 to 2032

Figure 14: Global Market Volume (Million Units) Analysis by End-use, 2017 to 2032

Figure 15: Global Market Value Share (%) and BPS Analysis by End-use, 2022 to 2032

Figure 16: Global Market Y-o-Y Growth (%) Projections by End-use, 2022 to 2032

Figure 17: Global Market Value (US$ Million) Analysis by Sales Channel, 2017 to 2032

Figure 18: Global Market Volume (Million Units) Analysis by Sales Channel, 2017 to 2032

Figure 19: Global Market Value Share (%) and BPS Analysis by Sales Channel, 2022 to 2032

Figure 20: Global Market Y-o-Y Growth (%) Projections by Sales Channel, 2022 to 2032

Figure 21: Global Market Attractiveness by Form Type, 2022 to 2032

Figure 22: Global Market Attractiveness by End-use, 2022 to 2032

Figure 23: Global Market Attractiveness by Sales Channel, 2022 to 2032

Figure 24: Global Market Attractiveness by Region, 2022 to 2032

Figure 25: North America Market Value (US$ Million) by Form Type, 2022 to 2032

Figure 26: North America Market Value (US$ Million) by End-use, 2022 to 2032

Figure 27: North America Market Value (US$ Million) by Sales Channel, 2022 to 2032

Figure 28: North America Market Value (US$ Million) by Country, 2022 to 2032

Figure 29: North America Market Value (US$ Million) Analysis by Country, 2017 to 2032

Figure 30: North America Market Volume (Million Units) Analysis by Country, 2017 to 2032

Figure 31: North America Market Value Share (%) and BPS Analysis by Country, 2022 to 2032

Figure 32: North America Market Y-o-Y Growth (%) Projections by Country, 2022 to 2032

Figure 33: North America Market Value (US$ Million) Analysis by Form Type, 2017 to 2032

Figure 34: North America Market Volume (Million Units) Analysis by Form Type, 2017 to 2032

Figure 35: North America Market Value Share (%) and BPS Analysis by Form Type, 2022 to 2032

Figure 36: North America Market Y-o-Y Growth (%) Projections by Form Type, 2022 to 2032

Figure 37: North America Market Value (US$ Million) Analysis by End-use, 2017 to 2032

Figure 38: North America Market Volume (Million Units) Analysis by End-use, 2017 to 2032

Figure 39: North America Market Value Share (%) and BPS Analysis by End-use, 2022 to 2032

Figure 40: North America Market Y-o-Y Growth (%) Projections by End-use, 2022 to 2032

Figure 41: North America Market Value (US$ Million) Analysis by Sales Channel, 2017 to 2032

Figure 42: North America Market Volume (Million Units) Analysis by Sales Channel, 2017 to 2032

Figure 43: North America Market Value Share (%) and BPS Analysis by Sales Channel, 2022 to 2032

Figure 44: North America Market Y-o-Y Growth (%) Projections by Sales Channel, 2022 to 2032

Figure 45: North America Market Attractiveness by Form Type, 2022 to 2032

Figure 46: North America Market Attractiveness by End-use, 2022 to 2032

Figure 47: North America Market Attractiveness by Sales Channel, 2022 to 2032

Figure 48: North America Market Attractiveness by Country, 2022 to 2032

Figure 49: Latin America Market Value (US$ Million) by Form Type, 2022 to 2032

Figure 50: Latin America Market Value (US$ Million) by End-use, 2022 to 2032

Figure 51: Latin America Market Value (US$ Million) by Sales Channel, 2022 to 2032

Figure 52: Latin America Market Value (US$ Million) by Country, 2022 to 2032

Figure 53: Latin America Market Value (US$ Million) Analysis by Country, 2017 to 2032

Figure 54: Latin America Market Volume (Million Units) Analysis by Country, 2017 to 2032

Figure 55: Latin America Market Value Share (%) and BPS Analysis by Country, 2022 to 2032

Figure 56: Latin America Market Y-o-Y Growth (%) Projections by Country, 2022 to 2032

Figure 57: Latin America Market Value (US$ Million) Analysis by Form Type, 2017 to 2032

Figure 58: Latin America Market Volume (Million Units) Analysis by Form Type, 2017 to 2032

Figure 59: Latin America Market Value Share (%) and BPS Analysis by Form Type, 2022 to 2032

Figure 60: Latin America Market Y-o-Y Growth (%) Projections by Form Type, 2022 to 2032

Figure 61: Latin America Market Value (US$ Million) Analysis by End-use, 2017 to 2032

Figure 62: Latin America Market Volume (Million Units) Analysis by End-use, 2017 to 2032

Figure 63: Latin America Market Value Share (%) and BPS Analysis by End-use, 2022 to 2032

Figure 64: Latin America Market Y-o-Y Growth (%) Projections by End-use, 2022 to 2032

Figure 65: Latin America Market Value (US$ Million) Analysis by Sales Channel, 2017 to 2032

Figure 66: Latin America Market Volume (Million Units) Analysis by Sales Channel, 2017 to 2032

Figure 67: Latin America Market Value Share (%) and BPS Analysis by Sales Channel, 2022 to 2032

Figure 68: Latin America Market Y-o-Y Growth (%) Projections by Sales Channel, 2022 to 2032

Figure 69: Latin America Market Attractiveness by Form Type, 2022 to 2032

Figure 70: Latin America Market Attractiveness by End-use, 2022 to 2032

Figure 71: Latin America Market Attractiveness by Sales Channel, 2022 to 2032

Figure 72: Latin America Market Attractiveness by Country, 2022 to 2032

Figure 73: Europe Market Value (US$ Million) by Form Type, 2022 to 2032

Figure 74: Europe Market Value (US$ Million) by End-use, 2022 to 2032

Figure 75: Europe Market Value (US$ Million) by Sales Channel, 2022 to 2032

Figure 76: Europe Market Value (US$ Million) by Country, 2022 to 2032

Figure 77: Europe Market Value (US$ Million) Analysis by Country, 2017 to 2032

Figure 78: Europe Market Volume (Million Units) Analysis by Country, 2017 to 2032

Figure 79: Europe Market Value Share (%) and BPS Analysis by Country, 2022 to 2032

Figure 80: Europe Market Y-o-Y Growth (%) Projections by Country, 2022 to 2032

Figure 81: Europe Market Value (US$ Million) Analysis by Form Type, 2017 to 2032

Figure 82: Europe Market Volume (Million Units) Analysis by Form Type, 2017 to 2032

Figure 83: Europe Market Value Share (%) and BPS Analysis by Form Type, 2022 to 2032

Figure 84: Europe Market Y-o-Y Growth (%) Projections by Form Type, 2022 to 2032

Figure 85: Europe Market Value (US$ Million) Analysis by End-use, 2017 to 2032

Figure 86: Europe Market Volume (Million Units) Analysis by End-use, 2017 to 2032

Figure 87: Europe Market Value Share (%) and BPS Analysis by End-use, 2022 to 2032

Figure 88: Europe Market Y-o-Y Growth (%) Projections by End-use, 2022 to 2032

Figure 89: Europe Market Value (US$ Million) Analysis by Sales Channel, 2017 to 2032

Figure 90: Europe Market Volume (Million Units) Analysis by Sales Channel, 2017 to 2032

Figure 91: Europe Market Value Share (%) and BPS Analysis by Sales Channel, 2022 to 2032

Figure 92: Europe Market Y-o-Y Growth (%) Projections by Sales Channel, 2022 to 2032

Figure 93: Europe Market Attractiveness by Form Type, 2022 to 2032

Figure 94: Europe Market Attractiveness by End-use, 2022 to 2032

Figure 95: Europe Market Attractiveness by Sales Channel, 2022 to 2032

Figure 96: Europe Market Attractiveness by Country, 2022 to 2032

Figure 97: East Asia Market Value (US$ Million) by Form Type, 2022 to 2032

Figure 98: East Asia Market Value (US$ Million) by End-use, 2022 to 2032

Figure 99: East Asia Market Value (US$ Million) by Sales Channel, 2022 to 2032

Figure 100: East Asia Market Value (US$ Million) by Country, 2022 to 2032

Figure 101: East Asia Market Value (US$ Million) Analysis by Country, 2017 to 2032

Figure 102: East Asia Market Volume (Million Units) Analysis by Country, 2017 to 2032

Figure 103: East Asia Market Value Share (%) and BPS Analysis by Country, 2022 to 2032

Figure 104: East Asia Market Y-o-Y Growth (%) Projections by Country, 2022 to 2032

Figure 105: East Asia Market Value (US$ Million) Analysis by Form Type, 2017 to 2032

Figure 106: East Asia Market Volume (Million Units) Analysis by Form Type, 2017 to 2032

Figure 107: East Asia Market Value Share (%) and BPS Analysis by Form Type, 2022 to 2032

Figure 108: East Asia Market Y-o-Y Growth (%) Projections by Form Type, 2022 to 2032

Figure 109: East Asia Market Value (US$ Million) Analysis by End-use, 2017 to 2032

Figure 110: East Asia Market Volume (Million Units) Analysis by End-use, 2017 to 2032

Figure 111: East Asia Market Value Share (%) and BPS Analysis by End-use, 2022 to 2032

Figure 112: East Asia Market Y-o-Y Growth (%) Projections by End-use, 2022 to 2032

Figure 113: East Asia Market Value (US$ Million) Analysis by Sales Channel, 2017 to 2032

Figure 114: East Asia Market Volume (Million Units) Analysis by Sales Channel, 2017 to 2032

Figure 115: East Asia Market Value Share (%) and BPS Analysis by Sales Channel, 2022 to 2032

Figure 116: East Asia Market Y-o-Y Growth (%) Projections by Sales Channel, 2022 to 2032

Figure 117: East Asia Market Attractiveness by Form Type, 2022 to 2032

Figure 118: East Asia Market Attractiveness by End-use, 2022 to 2032

Figure 119: East Asia Market Attractiveness by Sales Channel, 2022 to 2032

Figure 120: East Asia Market Attractiveness by Country, 2022 to 2032

Figure 121: South Asia Market Value (US$ Million) by Form Type, 2022 to 2032

Figure 122: South Asia Market Value (US$ Million) by End-use, 2022 to 2032

Figure 123: South Asia Market Value (US$ Million) by Sales Channel, 2022 to 2032

Figure 124: South Asia Market Value (US$ Million) by Country, 2022 to 2032

Figure 125: South Asia Market Value (US$ Million) Analysis by Country, 2017 to 2032

Figure 126: South Asia Market Volume (Million Units) Analysis by Country, 2017 to 2032

Figure 127: South Asia Market Value Share (%) and BPS Analysis by Country, 2022 to 2032

Figure 128: South Asia Market Y-o-Y Growth (%) Projections by Country, 2022 to 2032

Figure 129: South Asia Market Value (US$ Million) Analysis by Form Type, 2017 to 2032

Figure 130: South Asia Market Volume (Million Units) Analysis by Form Type, 2017 to 2032

Figure 131: South Asia Market Value Share (%) and BPS Analysis by Form Type, 2022 to 2032

Figure 132: South Asia Market Y-o-Y Growth (%) Projections by Form Type, 2022 to 2032

Figure 133: South Asia Market Value (US$ Million) Analysis by End-use, 2017 to 2032

Figure 134: South Asia Market Volume (Million Units) Analysis by End-use, 2017 to 2032

Figure 135: South Asia Market Value Share (%) and BPS Analysis by End-use, 2022 to 2032

Figure 136: South Asia Market Y-o-Y Growth (%) Projections by End-use, 2022 to 2032

Figure 137: South Asia Market Value (US$ Million) Analysis by Sales Channel, 2017 to 2032

Figure 138: South Asia Market Volume (Million Units) Analysis by Sales Channel, 2017 to 2032

Figure 139: South Asia Market Value Share (%) and BPS Analysis by Sales Channel, 2022 to 2032

Figure 140: South Asia Market Y-o-Y Growth (%) Projections by Sales Channel, 2022 to 2032

Figure 141: South Asia Market Attractiveness by Form Type, 2022 to 2032

Figure 142: South Asia Market Attractiveness by End-use, 2022 to 2032

Figure 143: South Asia Market Attractiveness by Sales Channel, 2022 to 2032

Figure 144: South Asia Market Attractiveness by Country, 2022 to 2032

Figure 145: Oceania Market Value (US$ Million) by Form Type, 2022 to 2032

Figure 146: Oceania Market Value (US$ Million) by End-use, 2022 to 2032

Figure 147: Oceania Market Value (US$ Million) by Sales Channel, 2022 to 2032

Figure 148: Oceania Market Value (US$ Million) by Country, 2022 to 2032

Figure 149: Oceania Market Value (US$ Million) Analysis by Country, 2017 to 2032

Figure 150: Oceania Market Volume (Million Units) Analysis by Country, 2017 to 2032

Figure 151: Oceania Market Value Share (%) and BPS Analysis by Country, 2022 to 2032

Figure 152: Oceania Market Y-o-Y Growth (%) Projections by Country, 2022 to 2032

Figure 153: Oceania Market Value (US$ Million) Analysis by Form Type, 2017 to 2032

Figure 154: Oceania Market Volume (Million Units) Analysis by Form Type, 2017 to 2032

Figure 155: Oceania Market Value Share (%) and BPS Analysis by Form Type, 2022 to 2032

Figure 156: Oceania Market Y-o-Y Growth (%) Projections by Form Type, 2022 to 2032

Figure 157: Oceania Market Value (US$ Million) Analysis by End-use, 2017 to 2032

Figure 158: Oceania Market Volume (Million Units) Analysis by End-use, 2017 to 2032

Figure 159: Oceania Market Value Share (%) and BPS Analysis by End-use, 2022 to 2032

Figure 160: Oceania Market Y-o-Y Growth (%) Projections by End-use, 2022 to 2032

Figure 161: Oceania Market Value (US$ Million) Analysis by Sales Channel, 2017 to 2032

Figure 162: Oceania Market Volume (Million Units) Analysis by Sales Channel, 2017 to 2032

Figure 163: Oceania Market Value Share (%) and BPS Analysis by Sales Channel, 2022 to 2032

Figure 164: Oceania Market Y-o-Y Growth (%) Projections by Sales Channel, 2022 to 2032

Figure 165: Oceania Market Attractiveness by Form Type, 2022 to 2032

Figure 166: Oceania Market Attractiveness by End-use, 2022 to 2032

Figure 167: Oceania Market Attractiveness by Sales Channel, 2022 to 2032

Figure 168: Oceania Market Attractiveness by Country, 2022 to 2032

Figure 169: MEA Market Value (US$ Million) by Form Type, 2022 to 2032

Figure 170: MEA Market Value (US$ Million) by End-use, 2022 to 2032

Figure 171: MEA Market Value (US$ Million) by Sales Channel, 2022 to 2032

Figure 172: MEA Market Value (US$ Million) by Country, 2022 to 2032

Figure 173: MEA Market Value (US$ Million) Analysis by Country, 2017 to 2032

Figure 174: MEA Market Volume (Million Units) Analysis by Country, 2017 to 2032

Figure 175: MEA Market Value Share (%) and BPS Analysis by Country, 2022 to 2032

Figure 176: MEA Market Y-o-Y Growth (%) Projections by Country, 2022 to 2032

Figure 177: MEA Market Value (US$ Million) Analysis by Form Type, 2017 to 2032

Figure 178: MEA Market Volume (Million Units) Analysis by Form Type, 2017 to 2032

Figure 179: MEA Market Value Share (%) and BPS Analysis by Form Type, 2022 to 2032

Figure 180: MEA Market Y-o-Y Growth (%) Projections by Form Type, 2022 to 2032

Figure 181: MEA Market Value (US$ Million) Analysis by End-use, 2017 to 2032

Figure 182: MEA Market Volume (Million Units) Analysis by End-use, 2017 to 2032

Figure 183: MEA Market Value Share (%) and BPS Analysis by End-use, 2022 to 2032

Figure 184: MEA Market Y-o-Y Growth (%) Projections by End-use, 2022 to 2032

Figure 185: MEA Market Value (US$ Million) Analysis by Sales Channel, 2017 to 2032

Figure 186: MEA Market Volume (Million Units) Analysis by Sales Channel, 2017 to 2032

Figure 187: MEA Market Value Share (%) and BPS Analysis by Sales Channel, 2022 to 2032

Figure 188: MEA Market Y-o-Y Growth (%) Projections by Sales Channel, 2022 to 2032

Figure 189: MEA Market Attractiveness by Form Type, 2022 to 2032

Figure 190: MEA Market Attractiveness by End-use, 2022 to 2032

Figure 191: MEA Market Attractiveness by Sales Channel, 2022 to 2032

Figure 192: MEA Market Attractiveness by Country, 2022 to 2032

Frequently Asked Questions

What is the projected growth of the global metal polish products market from 2022 to 2032?

The global metal polish products market is expected to expand at a 5.7% CAGR during the forecast period from 2022 to 2032

Which region is expected to be the most lucrative for global metal polish products market growth?

Asia Pacific is anticipated to be the most lucrative market during the forecast period

Which are some eminent global metal polish products market?

White Diamond Detail Products, Weiman Products, LLC, Wizards Products, and Turtle Wax, Inc., are some of the renowned players in the market.

Explore Similar Insights

Future Market Insights

Metal Polish Products Market