Reports

- Global Locations -

Headquarters

Future Market Insights, Inc.

Christiana Corporate, 200
Continental Drive, Suite 401,
Newark, Delaware - 19713,
United States

T: +1-845-579-5705

Americas

Future Market Insights, Inc.

616 Corporate Way, Suite 2-9018,
Valley Cottage, NY 10989, United States

T: +1-347-918-3531

MEA

Future Market Insights

1602-6 Jumeirah Bay X2 Tower, Plot No: JLT-PH2-X2A,
Jumeirah Lakes Towers, Dubai,
United Arab Emirates

Europe

Future Market Insights

3rd Floor, 207 Regent Street,
W1B 3HH London
United Kingdom

T: + 44 (0) 20 8123 9659
D: +44 (0) 20 3287 4268

Asia Pacific

Future Market Insights

IndiaLand Global Tech Park, Unit UG-1, Behind Grand HighStreet, Phase 1, Hinjawadi, MH, Pune – 411057, India

Metal Packaging Market Outlook (2023 to 2033)

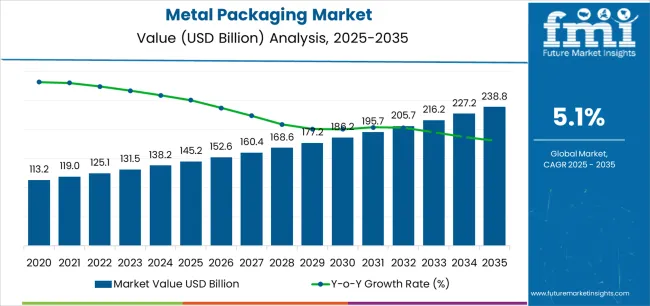
The global metal packaging market size is projected to surpass a valuation of US$ 239.4 billion by 2033. Our packaging analysts opine that global metal packaging providers can expect a CAGR of 5.90% through 2033, with a current valuation of US$ 124.9 billion in 2023.

Attribute Details
Metal Packaging Market Size, 2022 US$ 117.7 billion
Metal Packaging Products Market Size, 2023 US$ 124.9 billion
Metal Packaging Products Market Size, 2033 US$ 239.4 billion
Value CAGR (2023 to 2033) 5.90%

Key Market Highlights:

Metal 3D Printing is a Game-changer in the Packaging Industry

The advent of metal 3D printing has transformed the metal packaging industry. This trend allows companies to create highly personalized, sophisticated metal package designs that were previously difficult to make using standard processes. It caters to the need for unique, eye-catching packaging solutions by providing a new degree of customization and brand distinction. As this technology becomes more accessible and affordable, it allows firms to experiment with unique and creative designs, distinguishing them in competitive marketplaces and perhaps boosting growth through premium package options.

Variable Data Printing in Metal Packaging is a Powerful Tool for Driving Sales

Variable data printing on metal packaging enables personalization and localization of content. This trend allows firms to interact with customers more personally, tailoring their messaging to specific locations or consumer categories. Customized packaging is a valuable marketing strategy because it may build a better emotional connection with consumers, improve brand loyalty, and perhaps generate higher sales by connecting with specific tastes.

Edible Packaging is an Intriguing Trend in a Nascent Phase

Edible coatings and packaging produced from consumable ingredients are an exciting concept. This concept, currently in the early phases of research, attempts to minimize packaging waste by making the packaging edible. This principle is fundamental in businesses such as the food and beverage industry, where single-use packaging is an issue. Businesses experimenting with edible packaging are at the vanguard of a novel trend that blends sustainability with convenience. This trend has the potential to appeal to a wide spectrum of consumers searching for eco-friendly metal packaging solutions.


Don't pay for what you don't need

Customize your report by selecting specific countries or regions and save 30%!

Historical Performance of the Metal Packaging Market (2018 to 2022) Vs. Forecast Outlook (2023 to 2033)

Attributes Details
Metal Packaging Market Size (2018) US$ 105.4 billion
Metal Packaging Market Size (2022) US$ 117.7 billion
Metal Packaging Market (CAGR 2018 to 2022) 2.7%

The metal packaging market size expanded at a 2.7% CAGR from 2018 to 2022. The rise in environmental consciousness and the worldwide push for sustainability have been critical in boosting the metal packaging industry. Metal containers are recyclable and environmentally friendly, making them popular for organizations seeking to satisfy sustainability goals and customers seeking greener packaging solutions. Consumer choices have influenced the market's growth trajectory substantially. Shoppers are increasingly drawn to packaging that conveys product quality, safety, and sustainability. Metal packaging's durability and recyclability appeal to customers in a variety of industries, including foods, beverages, cosmetics, and medicines.

The expanding e-commerce industry has increased demand for packing solutions that can resist the rigors of online transportation. Metal packaging is an excellent solution for firms looking for tough e-commerce packaging due to its durability and protective properties. Continuous investment in packaging innovation is driving market growth. Metal packaging manufacturers are working on improving features, designs, and functionality. Metal packaging solutions are becoming more enticing to both businesses and discerning customers due to features like as user-friendly closures and resealable choices.

Customization via digital printing and variable data printing will become increasingly prevalent in the future. Brands will use these technologies to create unique, personalized metal packaging that corresponds to particular customer preferences. Emerging economies, symbolized by rising disposable incomes and urbanization, will provide new opportunities for growth. As consumer spending power grows, so will demand for packaged goods and premium packaging options, including metal packaging. The industry will continue to look for methods to improve the cost-efficiency of metal packaging. Material and lightweight technology innovations will be critical in maintaining competitive pricing and broadening consumer appeal.

Metal Packaging Market Trends Analysis

Trends
  • Incorporating modern anti-counterfeiting technologies into metal packaging can improve product security and brand protection.
  • Integration with developing technologies such as the Internet of Things (IoT) for smart packaging and augmented reality could result in innovative advertising opportunities.
  • Continued progress in sustainable materials and manufacturing techniques can position metal packaging as an even more ecologically beneficial option.
  • The growth of e-commerce allows metal packaging since its robustness and protective features meet the needs of online delivery.
  • The move toward personalized packaging provides chances for metal packaging to fulfill the expectations of companies seeking distinctive and bespoke solutions.
  • Optimization of metal packaging weight to improve cost-efficiency and decrease environmental effects during transportation and manufacture.
  • The transition to ecologically responsible packaging options in order to address the rising demand for environmentally friendly products.
Opportunities
  • Metal packaging that incorporates modern anti-counterfeiting technologies can improve product security and brand protection.
  • Integration with advancing technologies such as the Internet of Things (IoT) for smart packaging and augmented reality could present new avenues for clever marketing.
  • Metal packaging can get even more ecologically friendly with further innovation in sustainable materials and manufacturing techniques.
  • Metal packaging has an opportunity as e-commerce grows since its toughness and protective features meet the expectations of online delivery.
  • The move toward personalized packaging provides the potential for metal packaging to satisfy the needs of companies looking for one-of-a-kind and bespoke solutions.
Challenges
  • Metal packaging's cost-effectiveness may be impacted by rising production costs caused by volatility in metal prices, energy costs, and environmental compliance.
  • Metal container production requires a substantial amount of energy during the smelting and shaping processes, which might be considered a disadvantage in carbon impact.
  • Metal packaging sometimes comes in set forms, such as cans or tins, restricting design options when compared to flexible materials such as plastics.
Ismail Sutaria
Ismail Sutaria

Principal Consultant

Talk to Analyst

Find your sweet spots for generating winning opportunities in this market.

Comparative View of the Adjacent Metal Packaging Market

Future Market Insights (FMI) has compared two other markets, the next generation packaging market and the personalized packaging market. As per the analysis, the exponential growth of the e-commerce industry will lead to consistent demand across the three markets. The mentioned markets will witness increasing integration of advancing technologies such as the Internet of Things (IoT), Augmented reality (AR), and smart packaging to deliver more functional products.

The rising purchasing power will increase demand for premium packaging, thereby fostering market growth. Sustainability trends will be crucial for long-term growth.

Metal Packaging Market:

Attributes Metal Packaging Market
CAGR (2023 to 2033) 5.90%
Market Value (2023) US$ 124.9 billion
Growth Factors
  • Increasing integration with emerging technologies like IoT and smart packaging.
  • Growing demand for lightweight packaging solutions.
Future Opportunities Increased demand for e-commerce packaging.
Market Trends Rising product premiumization in the industry.

Next Generation Packaging Market:

Attributes Next Generation Packaging Market
CAGR (2023 to 2033) 6.43%
Market Value (2023) US$ 12,847.9 million
Growth Factors
  • Rising demand for sustainable and ecofriendly packaging solutions.
  • Surging integration of IoT in packaging.
Future Opportunities Continued rise of e-commerce industry.
Market Trends Increasing trend of personalization and customization.

Personalized Packaging Market:

Attributes Personalized Packaging Market
CAGR (2023 to 2033) 5.28%
Market Value (2023) US$ 36.10 bilion
Growth Factors
  • Rising demand from end-use industries.
  • Increasing demand for consumer electronics.
Future Opportunities Increased branding campaigns.
Market Trends Booming e-commerce sector.

Category-wise Insights

Extensive Growth of E-commerce Industry Drives Sales of Cans in the Industry

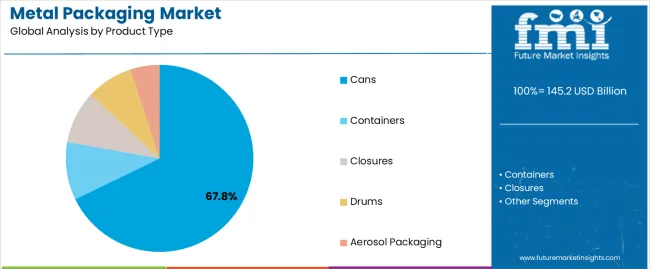
In 2023, cans held 33.6% of the metal packaging market shares.

Segment Cans (Product Type)
Value Share (2023) 33.6%

Continuous innovation in can design, ranging from different forms to user-friendly features, allows for customization and improved usefulness. This flexibility satisfies the changing needs of companies and consumers, increasing market attractiveness. Cans have been associated with a high-quality, luxury image. Brands use this concept to create an air of exclusivity and differentiate their items on crowded retail shelves. As e-commerce grows, packaging is being recognized for its ability to endure the rigors of online delivery. Cans are the go-to solution for organizations dealing with online delivery due to their strength and protective features.

Expanding Food & Beverage Industry Boosts Demand for Metal Packaging Materials

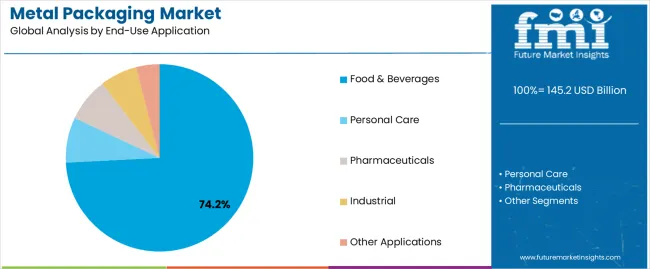
The metal packaging market analysis and trends signify that the food & beverages segment captured 40.3% of the market share in 2023.

Segment Food & Beverages (End Use)
Value Share (2023) 40.3%

The food and beverage industry frequently handles products with long shelf life, such as canned foods, ready-to-eat meals, and unique beverages. Metal packaging materials excel in maintaining such items' freshness and quality, ensuring consumer satisfaction and market competitiveness. Metal packaging solutions, including as user-friendly lids and cutting-edge can designs, are always improving to meet the sector's changing customer needs and technology improvements. This aids in the smooth integration of new packaging technologies and the reinforcement of customer interaction initiatives.

Get the data you need at a Fraction of the cost

Personalize your report by choosing insights you need
and save 40%!

Country-wise Insights

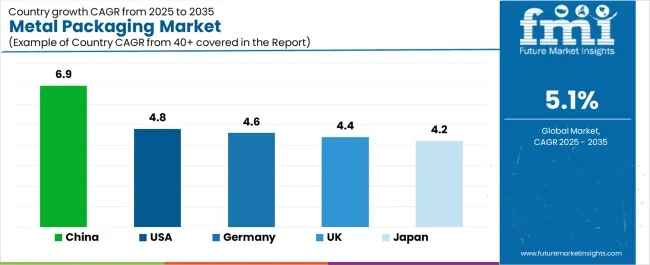
Countries Value CAGR (2023 to 2033)
Canada 5.5%
United Kingdom 6.1%
Germany 4.1%
India 8.2%
China 7.4%

Rising Demand for Minimally Processed Foods Unlocks New Opportunities in Canada

The metal packaging market size in Canada will rise at a 5.5% CAGR through 2033. The increased emphasis on health and well-being in Canadian society influences metal packaging consumption in the food and beverage industry. The industry is experiencing a spike in demand for flexible metal packaging solutions that maintain product safety and quality due to a growing desire for fresh and minimally processed meals. Canadians are growing more attracted to items that complement their ecologically conscious and health-sensitive lives. The sustainable qualities of metal packaging materials and their capacity to maintain product integrity resonate well with this demographic, contributing considerably to the market's growth.

Stringent Waste Reduction Targets Create Growth Prospects in the United Kingdom

The sales of metal packaging in the United Kingdom will surge at a 6.1% CAGR through 2033. The United Kingdom government's stringent packaging waste reduction objectives encourage the use of metal packaging. Businesses are under pressure to achieve recycling and waste reduction targets, which is driving up demand for recyclable metal packaging. The "buy local" and "sustainability" movements are gaining traction. Metal packaging producers in the United Kingdom benefit from their proximity to domestic markets, reducing their carbon footprint and boosting the national economy. This bolsters the attraction of metal packaging to environmentally aware customers. Additionally, the United Kingdom has an advanced recycling and waste management infrastructure that promotes the use of recyclable materials, particularly metal packaging. The ease with which customers may dispose of and recycle metal packaging contributes to the market's growth.

Investments in Material Science Boost Innovations in Germany

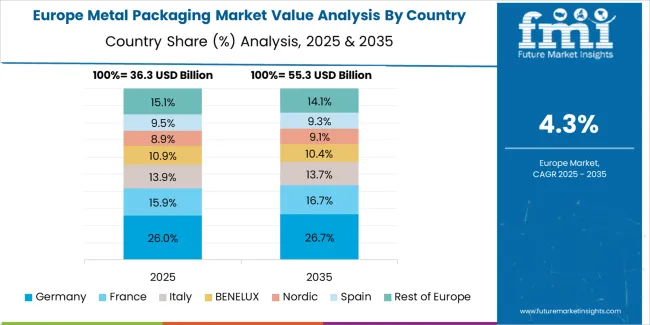
The metal packaging market size in Germany will develop at a 4.1% CAGR through 2033. R&D investments are driving material science advancements for metal packaging. As a result, better coatings, superior materials, and greater product protection capabilities are being developed, increasing the attractiveness of German metal packaging solutions. Germany's strong engagement in trade treaties and partnerships with worldwide partners has cleared the road for metal packaging items to be exported. These trade alliances broaden enterprises' reach, supporting market growth and global awareness of German-made metal packaging.

Government Initiatives Boosts Expansion Opportunities in India

The demand for metal packaging solutions in India will thrive at an 8.2% CAGR through 2033. Government-led programs, such as the Make in India campaign, have encouraged local manufacture and self-sufficiency in a variety of industries, including packaging. Incentives and regulatory support for the metal packaging industry have encouraged investment, supporting sector expansion and contributing to the country's economic prosperity. Rising disposable income and shifting consumer preferences have increased the demand for premium and high-quality goods in India. With its premium image and perceived product integrity, metal packaging has garnered favor among customers looking for premium metal packaging options, adding to the country's market development.

Investments in Advanced Manufacturing Technologies Will Aid in Market Expansion in China

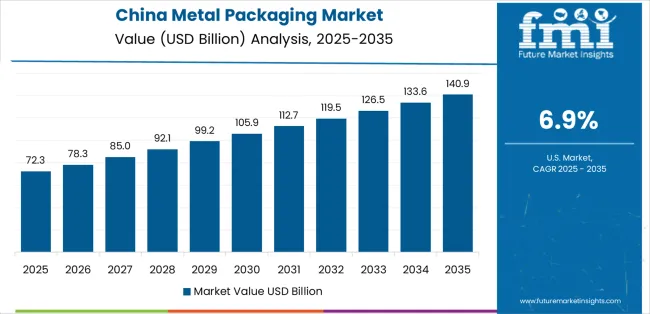
The demand for metal packaging in the United Kingdom will surge at a 7.4% CAGR through 2033. China's investments in modern manufacturing technology and automation are improving metal packaging production quality and efficiency. Adopting cutting-edge technology and software solutions has established Chinese manufacturers as global leaders in streamlined manufacturing, leading to the development of metal packaging market. Because of China's infrastructural developments and the expansion of cold chain facilities, packaging solutions that can retain product integrity under variable temperature settings are required. The insulating capabilities of metal packaging have made it a favorite choice for organizations in the cold chain and logistics sectors, further aiding its market development.

Competitive Landscape

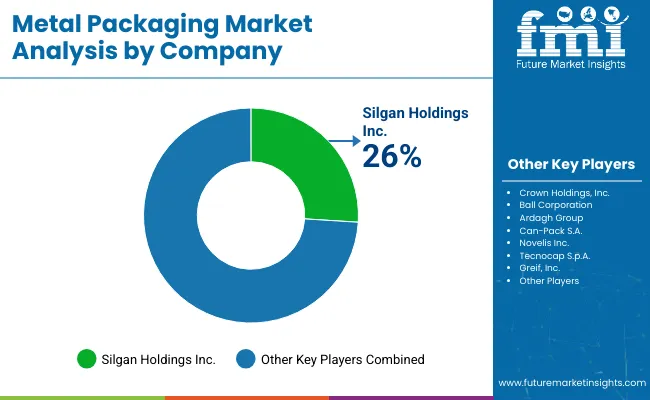
The metal packaging market's competitive environment is defined by a mix of established industry leaders, regional companies, and emerging market entrants, demonstrating the sector's resilience and flexibility. Crown Holdings Inc., Ball Corporation, and Ardagh Group dominate the industry due to their substantial production capabilities, global presence, and broad product portfolio. These industry leaders have established themselves as trustworthy sources of innovation and quality. They frequently collaborate with large consumer brands to provide bespoke metal packaging solutions that match sustainability goals while maintaining product integrity and visual appeal.

Recent Developments

  • Eviosys, the international packaging company, introduced its latest innovation, Ecopeel, in January 2023. Two hundred years of knowledge and research have resulted in an industry first: a processable food can with a sleek, peelable foil directly sealed on the can body. Ecopeel was created with sustainability, convenience, and inclusion in mind. Ecopeel is lighter and delivers a 20% carbon reduction per can by replacing the usual ring-pull with foil.
  • Ardagh Metal Packaging North America (AMP - NA) expanded its extensive product offering for beverage brand clients in January 2023 by introducing a new 19.2 oz. (568ml) beverage can.

Key Players in the Metal Packaging Market

  • Ball Corporation
  • Crown Holdings
  • Silgan Holdings
  • Ardagh Group
  • CPMC Holdings Ltd
  • Amcor Limited, Alcoa Corporation
  • Manaksia
  • Tata Steel Limited
  • Rexam Plc
  • Greif Inc
  • Toyo Seikan Group Holdings Ltd

Metal Packaging Market Segmentation

By Material Type:

  • Aluminum
  • Steel
  • Others

By End Use:

  • Food & Beverages
  • Personal Care
  • Healthcare
  • Household & Consumer
  • Industrial

By Product Type:

  • Cans
  • Drums & Pails
  • Aerosols
  • Tubes & Lids
  • Barrels
  • Trays & Foils
  • Caps & Closure
  • Bottles & Jars
  • IBCs
  • Pallets
  • Others

By Region:

  • North America
  • Latin America
  • Western Europe
  • Eastern Europe
  • Asia Pacific (APAC)
  • Middle East & Africa (MEA)
  • Japan

Frequently Asked Questions

How Big is the Metal Packaging Market?

The metal packaging market size is valued at US$ 124.9 billion in 2023.

What is the Projected CAGR of the Metal Packaging Market?

The metal packaging market size will rise at a 5.90% CAGR through 2033.

How Big Will be the Metal Packaging Market by 2033?

The metal packaging market will be worth US$ 239.4 billion by 2033.

Which is the Preferred Product Type in the Metal Packaging Market?

Cans experience immense popularity in the metal packaging market.

Which Country is Rising at a Higher CAGR in the Metal Packaging Market?

The metal packaging market size in India will rise at an 8.2% CAGR through 2033.

Table of Content

1. Executive Summary

    1.1. Global Market Outlook

    1.2. Demand-side Trends

    1.3. Supply-side Trends

    1.4. Technology Roadmap Analysis

    1.5. Analysis and Recommendations

2. Market Overview

    2.1. Market Coverage / Taxonomy

    2.2. Market Definition / Scope / Limitations

3. Market Background

    3.1. Market Dynamics

        3.1.1. Drivers

        3.1.2. Restraints

        3.1.3. Opportunity

        3.1.4. Trends

    3.2. Scenario Forecast

        3.2.1. Demand in Optimistic Scenario

        3.2.2. Demand in Likely Scenario

        3.2.3. Demand in Conservative Scenario

    3.3. Opportunity Map Analysis

    3.4. Product Life Cycle Analysis

    3.5. Supply Chain Analysis

        3.5.1. Supply Side Participants and their Roles

            3.5.1.1. Producers

            3.5.1.2. Mid-Level Participants (Traders/ Agents/ Brokers)

            3.5.1.3. Wholesalers and Distributors

        3.5.2. Value Added and Value Created at Node in the Supply Chain

        3.5.3. List of Raw Material Suppliers

        3.5.4. List of Existing and Potential Buyer’s

    3.6. Investment Feasibility Matrix

    3.7. Value Chain Analysis

        3.7.1. Profit Margin Analysis

        3.7.2. Wholesalers and Distributors

        3.7.3. Retailers

    3.8. PESTLE and Porter’s Analysis

    3.9. Regulatory Landscape

        3.9.1. By Key Regions

        3.9.2. By Key Countries

    3.10. Regional Parent Market Outlook

    3.11. Production and Consumption Statistics

    3.12. Import and Export Statistics

4. Global Market Analysis 2018 to 2022 and Forecast, 2023 to 2033

    4.1. Historical Market Size Value (US$ Million) & Volume (Tons) Analysis, 2018 to 2022

    4.2. Current and Future Market Size Value (US$ Million) & Volume (Tons) Projections, 2023 to 2033

        4.2.1. Y-o-Y Growth Trend Analysis

        4.2.2. Absolute $ Opportunity Analysis

5. Global Market Analysis 2018 to 2022 and Forecast 2023 to 2033, By Material Type

    5.1. Introduction / Key Findings

    5.2. Historical Market Size Value (US$ Million) & Volume (Tons) Analysis By Material Type, 2018 to 2022

    5.3. Current and Future Market Size Value (US$ Million) & Volume (Tons) Analysis and Forecast By Material Type, 2023 to 2033

        5.3.1. Aluminium Metal Packaging

        5.3.2. Steel Metal Packaging

        5.3.3. Others

    5.4. Y-o-Y Growth Trend Analysis By Material Type, 2018 to 2022

    5.5. Absolute $ Opportunity Analysis By Material Type, 2023 to 2033

6. Global Market Analysis 2018 to 2022 and Forecast 2023 to 2033, By End Use

    6.1. Introduction / Key Findings

    6.2. Historical Market Size Value (US$ Million) & Volume (Tons) Analysis By End Use, 2018 to 2022

    6.3. Current and Future Market Size Value (US$ Million) & Volume (Tons) Analysis and Forecast By End Use, 2023 to 2033

        6.3.1. Food & Beverages

        6.3.2. Personal Care

        6.3.3. Healthcare

        6.3.4. Household & Consumer

        6.3.5. Industrial

    6.4. Y-o-Y Growth Trend Analysis By End Use, 2018 to 2022

    6.5. Absolute $ Opportunity Analysis By End Use, 2023 to 2033

7. Global Market Analysis 2018 to 2022 and Forecast 2023 to 2033, By Packaging type

    7.1. Introduction / Key Findings

    7.2. Historical Market Size Value (US$ Million) & Volume (Tons) Analysis By Packaging type, 2018 to 2022

    7.3. Current and Future Market Size Value (US$ Million) & Volume (Tons) Analysis and Forecast By Packaging type, 2023 to 2033

        7.3.1. Cans

        7.3.2. Drums & Pails

        7.3.3. Aerosols

        7.3.4. Tubes & Lids

        7.3.5. Barrels

        7.3.6. Trays & Foils

        7.3.7. Caps & Closure

        7.3.8. Bottles & Jars

        7.3.9. IBCs

        7.3.10. Pallets

        7.3.11. Others

    7.4. Y-o-Y Growth Trend Analysis By Packaging type, 2018 to 2022

    7.5. Absolute $ Opportunity Analysis By Packaging type, 2023 to 2033

8. Global Market Analysis 2018 to 2022 and Forecast 2023 to 2033, By Region

    8.1. Introduction

    8.2. Historical Market Size Value (US$ Million) & Volume (Tons) Analysis By Region, 2018 to 2022

    8.3. Current Market Size Value (US$ Million) & Volume (Tons) Analysis and Forecast By Region, 2023 to 2033

        8.3.1. North America

        8.3.2. Latin America

        8.3.3. Western Europe

        8.3.4. Eastern Europe

        8.3.5. South Asia and Pacific

        8.3.6. East Asia

        8.3.7. Middle East and Africa

    8.4. Market Attractiveness Analysis By Region

9. North America Market Analysis 2018 to 2022 and Forecast 2023 to 2033, By Country

    9.1. Historical Market Size Value (US$ Million) & Volume (Tons) Trend Analysis By Market Taxonomy, 2018 to 2022

    9.2. Market Size Value (US$ Million) & Volume (Tons) Forecast By Market Taxonomy, 2023 to 2033

        9.2.1. By Country

            9.2.1.1. USA

            9.2.1.2. Canada

        9.2.2. By Material Type

        9.2.3. By End Use

        9.2.4. By Packaging type

    9.3. Market Attractiveness Analysis

        9.3.1. By Country

        9.3.2. By Material Type

        9.3.3. By End Use

        9.3.4. By Packaging type

    9.4. Key Takeaways

10. Latin America Market Analysis 2018 to 2022 and Forecast 2023 to 2033, By Country

    10.1. Historical Market Size Value (US$ Million) & Volume (Tons) Trend Analysis By Market Taxonomy, 2018 to 2022

    10.2. Market Size Value (US$ Million) & Volume (Tons) Forecast By Market Taxonomy, 2023 to 2033

        10.2.1. By Country

            10.2.1.1. Brazil

            10.2.1.2. Mexico

            10.2.1.3. Rest of Latin America

        10.2.2. By Material Type

        10.2.3. By End Use

        10.2.4. By Packaging type

    10.3. Market Attractiveness Analysis

        10.3.1. By Country

        10.3.2. By Material Type

        10.3.3. By End Use

        10.3.4. By Packaging type

    10.4. Key Takeaways

11. Western Europe Market Analysis 2018 to 2022 and Forecast 2023 to 2033, By Country

    11.1. Historical Market Size Value (US$ Million) & Volume (Tons) Trend Analysis By Market Taxonomy, 2018 to 2022

    11.2. Market Size Value (US$ Million) & Volume (Tons) Forecast By Market Taxonomy, 2023 to 2033

        11.2.1. By Country

            11.2.1.1. Germany

            11.2.1.2. UK

            11.2.1.3. France

            11.2.1.4. Spain

            11.2.1.5. Italy

            11.2.1.6. Rest of Western Europe

        11.2.2. By Material Type

        11.2.3. By End Use

        11.2.4. By Packaging type

    11.3. Market Attractiveness Analysis

        11.3.1. By Country

        11.3.2. By Material Type

        11.3.3. By End Use

        11.3.4. By Packaging type

    11.4. Key Takeaways

12. Eastern Europe Market Analysis 2018 to 2022 and Forecast 2023 to 2033, By Country

    12.1. Historical Market Size Value (US$ Million) & Volume (Tons) Trend Analysis By Market Taxonomy, 2018 to 2022

    12.2. Market Size Value (US$ Million) & Volume (Tons) Forecast By Market Taxonomy, 2023 to 2033

        12.2.1. By Country

            12.2.1.1. Poland

            12.2.1.2. Russia

            12.2.1.3. Czech Republic

            12.2.1.4. Romania

            12.2.1.5. Rest of Eastern Europe

        12.2.2. By Material Type

        12.2.3. By End Use

        12.2.4. By Packaging type

    12.3. Market Attractiveness Analysis

        12.3.1. By Country

        12.3.2. By Material Type

        12.3.3. By End Use

        12.3.4. By Packaging type

    12.4. Key Takeaways

13. South Asia and Pacific Market Analysis 2018 to 2022 and Forecast 2023 to 2033, By Country

    13.1. Historical Market Size Value (US$ Million) & Volume (Tons) Trend Analysis By Market Taxonomy, 2018 to 2022

    13.2. Market Size Value (US$ Million) & Volume (Tons) Forecast By Market Taxonomy, 2023 to 2033

        13.2.1. By Country

            13.2.1.1. India

            13.2.1.2. Bangladesh

            13.2.1.3. Australia

            13.2.1.4. New Zealand

            13.2.1.5. Rest of South Asia and Pacific

        13.2.2. By Material Type

        13.2.3. By End Use

        13.2.4. By Packaging type

    13.3. Market Attractiveness Analysis

        13.3.1. By Country

        13.3.2. By Material Type

        13.3.3. By End Use

        13.3.4. By Packaging type

    13.4. Key Takeaways

14. East Asia Market Analysis 2018 to 2022 and Forecast 2023 to 2033, By Country

    14.1. Historical Market Size Value (US$ Million) & Volume (Tons) Trend Analysis By Market Taxonomy, 2018 to 2022

    14.2. Market Size Value (US$ Million) & Volume (Tons) Forecast By Market Taxonomy, 2023 to 2033

        14.2.1. By Country

            14.2.1.1. China

            14.2.1.2. Japan

            14.2.1.3. South Korea

        14.2.2. By Material Type

        14.2.3. By End Use

        14.2.4. By Packaging type

    14.3. Market Attractiveness Analysis

        14.3.1. By Country

        14.3.2. By Material Type

        14.3.3. By End Use

        14.3.4. By Packaging type

    14.4. Key Takeaways

15. Middle East and Africa Market Analysis 2018 to 2022 and Forecast 2023 to 2033, By Country

    15.1. Historical Market Size Value (US$ Million) & Volume (Tons) Trend Analysis By Market Taxonomy, 2018 to 2022

    15.2. Market Size Value (US$ Million) & Volume (Tons) Forecast By Market Taxonomy, 2023 to 2033

        15.2.1. By Country

            15.2.1.1. GCC Countries

            15.2.1.2. South Africa

            15.2.1.3. Israel

            15.2.1.4. Rest of MEA

        15.2.2. By Material Type

        15.2.3. By End Use

        15.2.4. By Packaging type

    15.3. Market Attractiveness Analysis

        15.3.1. By Country

        15.3.2. By Material Type

        15.3.3. By End Use

        15.3.4. By Packaging type

    15.4. Key Takeaways

16. Key Countries Market Analysis

    16.1. USA

        16.1.1. Pricing Analysis

        16.1.2. Market Share Analysis, 2022

            16.1.2.1. By Material Type

            16.1.2.2. By End Use

            16.1.2.3. By Packaging type

    16.2. Canada

        16.2.1. Pricing Analysis

        16.2.2. Market Share Analysis, 2022

            16.2.2.1. By Material Type

            16.2.2.2. By End Use

            16.2.2.3. By Packaging type

    16.3. Brazil

        16.3.1. Pricing Analysis

        16.3.2. Market Share Analysis, 2022

            16.3.2.1. By Material Type

            16.3.2.2. By End Use

            16.3.2.3. By Packaging type

    16.4. Mexico

        16.4.1. Pricing Analysis

        16.4.2. Market Share Analysis, 2022

            16.4.2.1. By Material Type

            16.4.2.2. By End Use

            16.4.2.3. By Packaging type

    16.5. Germany

        16.5.1. Pricing Analysis

        16.5.2. Market Share Analysis, 2022

            16.5.2.1. By Material Type

            16.5.2.2. By End Use

            16.5.2.3. By Packaging type

    16.6. UK

        16.6.1. Pricing Analysis

        16.6.2. Market Share Analysis, 2022

            16.6.2.1. By Material Type

            16.6.2.2. By End Use

            16.6.2.3. By Packaging type

    16.7. France

        16.7.1. Pricing Analysis

        16.7.2. Market Share Analysis, 2022

            16.7.2.1. By Material Type

            16.7.2.2. By End Use

            16.7.2.3. By Packaging type

    16.8. Spain

        16.8.1. Pricing Analysis

        16.8.2. Market Share Analysis, 2022

            16.8.2.1. By Material Type

            16.8.2.2. By End Use

            16.8.2.3. By Packaging type

    16.9. Italy

        16.9.1. Pricing Analysis

        16.9.2. Market Share Analysis, 2022

            16.9.2.1. By Material Type

            16.9.2.2. By End Use

            16.9.2.3. By Packaging type

    16.10. Poland

        16.10.1. Pricing Analysis

        16.10.2. Market Share Analysis, 2022

            16.10.2.1. By Material Type

            16.10.2.2. By End Use

            16.10.2.3. By Packaging type

    16.11. Russia

        16.11.1. Pricing Analysis

        16.11.2. Market Share Analysis, 2022

            16.11.2.1. By Material Type

            16.11.2.2. By End Use

            16.11.2.3. By Packaging type

    16.12. Czech Republic

        16.12.1. Pricing Analysis

        16.12.2. Market Share Analysis, 2022

            16.12.2.1. By Material Type

            16.12.2.2. By End Use

            16.12.2.3. By Packaging type

    16.13. Romania

        16.13.1. Pricing Analysis

        16.13.2. Market Share Analysis, 2022

            16.13.2.1. By Material Type

            16.13.2.2. By End Use

            16.13.2.3. By Packaging type

    16.14. India

        16.14.1. Pricing Analysis

        16.14.2. Market Share Analysis, 2022

            16.14.2.1. By Material Type

            16.14.2.2. By End Use

            16.14.2.3. By Packaging type

    16.15. Bangladesh

        16.15.1. Pricing Analysis

        16.15.2. Market Share Analysis, 2022

            16.15.2.1. By Material Type

            16.15.2.2. By End Use

            16.15.2.3. By Packaging type

    16.16. Australia

        16.16.1. Pricing Analysis

        16.16.2. Market Share Analysis, 2022

            16.16.2.1. By Material Type

            16.16.2.2. By End Use

            16.16.2.3. By Packaging type

    16.17. New Zealand

        16.17.1. Pricing Analysis

        16.17.2. Market Share Analysis, 2022

            16.17.2.1. By Material Type

            16.17.2.2. By End Use

            16.17.2.3. By Packaging type

    16.18. China

        16.18.1. Pricing Analysis

        16.18.2. Market Share Analysis, 2022

            16.18.2.1. By Material Type

            16.18.2.2. By End Use

            16.18.2.3. By Packaging type

    16.19. Japan

        16.19.1. Pricing Analysis

        16.19.2. Market Share Analysis, 2022

            16.19.2.1. By Material Type

            16.19.2.2. By End Use

            16.19.2.3. By Packaging type

    16.20. South Korea

        16.20.1. Pricing Analysis

        16.20.2. Market Share Analysis, 2022

            16.20.2.1. By Material Type

            16.20.2.2. By End Use

            16.20.2.3. By Packaging type

    16.21. GCC Countries

        16.21.1. Pricing Analysis

        16.21.2. Market Share Analysis, 2022

            16.21.2.1. By Material Type

            16.21.2.2. By End Use

            16.21.2.3. By Packaging type

    16.22. South Africa

        16.22.1. Pricing Analysis

        16.22.2. Market Share Analysis, 2022

            16.22.2.1. By Material Type

            16.22.2.2. By End Use

            16.22.2.3. By Packaging type

    16.23. Israel

        16.23.1. Pricing Analysis

        16.23.2. Market Share Analysis, 2022

            16.23.2.1. By Material Type

            16.23.2.2. By End Use

            16.23.2.3. By Packaging type

17. Market Structure Analysis

    17.1. Competition Dashboard

    17.2. Competition Benchmarking

    17.3. Market Share Analysis of Top Players

        17.3.1. By Regional

        17.3.2. By Material Type

        17.3.3. By End Use

        17.3.4. By Packaging type

18. Competition Analysis

    18.1. Competition Deep Dive

        18.1.1. Ball Corporation

            18.1.1.1. Overview

            18.1.1.2. Product Portfolio

            18.1.1.3. Profitability by Market Segments

            18.1.1.4. Sales Footprint

            18.1.1.5. Strategy Overview

                18.1.1.5.1. Marketing Strategy

                18.1.1.5.2. Product Strategy

                18.1.1.5.3. Channel Strategy

        18.1.2. Crown Holdings

            18.1.2.1. Overview

            18.1.2.2. Product Portfolio

            18.1.2.3. Profitability by Market Segments

            18.1.2.4. Sales Footprint

            18.1.2.5. Strategy Overview

                18.1.2.5.1. Marketing Strategy

                18.1.2.5.2. Product Strategy

                18.1.2.5.3. Channel Strategy

        18.1.3. Silgan Holdings

            18.1.3.1. Overview

            18.1.3.2. Product Portfolio

            18.1.3.3. Profitability by Market Segments

            18.1.3.4. Sales Footprint

            18.1.3.5. Strategy Overview

                18.1.3.5.1. Marketing Strategy

                18.1.3.5.2. Product Strategy

                18.1.3.5.3. Channel Strategy

        18.1.4. Ardagh Group

            18.1.4.1. Overview

            18.1.4.2. Product Portfolio

            18.1.4.3. Profitability by Market Segments

            18.1.4.4. Sales Footprint

            18.1.4.5. Strategy Overview

                18.1.4.5.1. Marketing Strategy

                18.1.4.5.2. Product Strategy

                18.1.4.5.3. Channel Strategy

        18.1.5. CPMC Holdings Ltd.

            18.1.5.1. Overview

            18.1.5.2. Product Portfolio

            18.1.5.3. Profitability by Market Segments

            18.1.5.4. Sales Footprint

            18.1.5.5. Strategy Overview

                18.1.5.5.1. Marketing Strategy

                18.1.5.5.2. Product Strategy

                18.1.5.5.3. Channel Strategy

        18.1.6. Amcor Limited, Alcoa Corporation

            18.1.6.1. Overview

            18.1.6.2. Product Portfolio

            18.1.6.3. Profitability by Market Segments

            18.1.6.4. Sales Footprint

            18.1.6.5. Strategy Overview

                18.1.6.5.1. Marketing Strategy

                18.1.6.5.2. Product Strategy

                18.1.6.5.3. Channel Strategy

        18.1.7. Manaksia

            18.1.7.1. Overview

            18.1.7.2. Product Portfolio

            18.1.7.3. Profitability by Market Segments

            18.1.7.4. Sales Footprint

            18.1.7.5. Strategy Overview

                18.1.7.5.1. Marketing Strategy

                18.1.7.5.2. Product Strategy

                18.1.7.5.3. Channel Strategy

        18.1.8. Tata Steel Limited

            18.1.8.1. Overview

            18.1.8.2. Product Portfolio

            18.1.8.3. Profitability by Market Segments

            18.1.8.4. Sales Footprint

            18.1.8.5. Strategy Overview

                18.1.8.5.1. Marketing Strategy

                18.1.8.5.2. Product Strategy

                18.1.8.5.3. Channel Strategy

        18.1.9. Rexam plc, Greif, Inc.

            18.1.9.1. Overview

            18.1.9.2. Product Portfolio

            18.1.9.3. Profitability by Market Segments

            18.1.9.4. Sales Footprint

            18.1.9.5. Strategy Overview

                18.1.9.5.1. Marketing Strategy

                18.1.9.5.2. Product Strategy

                18.1.9.5.3. Channel Strategy

        18.1.10. Toyo Seikan Group Holdings, Ltd. etc

            18.1.10.1. Overview

            18.1.10.2. Product Portfolio

            18.1.10.3. Profitability by Market Segments

            18.1.10.4. Sales Footprint

            18.1.10.5. Strategy Overview

                18.1.10.5.1. Marketing Strategy

                18.1.10.5.2. Product Strategy

                18.1.10.5.3. Channel Strategy

19. Assumptions & Acronyms Used

20. Research Methodology

List of Tables

Table 1: Global Market Value (US$ Million) Forecast by Region, 2018 to 2033

Table 2: Global Market Volume (Tons) Forecast by Region, 2018 to 2033

Table 3: Global Market Value (US$ Million) Forecast by Material Type, 2018 to 2033

Table 4: Global Market Volume (Tons) Forecast by Material Type, 2018 to 2033

Table 5: Global Market Value (US$ Million) Forecast by End Use, 2018 to 2033

Table 6: Global Market Volume (Tons) Forecast by End Use, 2018 to 2033

Table 7: Global Market Value (US$ Million) Forecast by Packaging type, 2018 to 2033

Table 8: Global Market Volume (Tons) Forecast by Packaging type, 2018 to 2033

Table 9: North America Market Value (US$ Million) Forecast by Country, 2018 to 2033

Table 10: North America Market Volume (Tons) Forecast by Country, 2018 to 2033

Table 11: North America Market Value (US$ Million) Forecast by Material Type, 2018 to 2033

Table 12: North America Market Volume (Tons) Forecast by Material Type, 2018 to 2033

Table 13: North America Market Value (US$ Million) Forecast by End Use, 2018 to 2033

Table 14: North America Market Volume (Tons) Forecast by End Use, 2018 to 2033

Table 15: North America Market Value (US$ Million) Forecast by Packaging type, 2018 to 2033

Table 16: North America Market Volume (Tons) Forecast by Packaging type, 2018 to 2033

Table 17: Latin America Market Value (US$ Million) Forecast by Country, 2018 to 2033

Table 18: Latin America Market Volume (Tons) Forecast by Country, 2018 to 2033

Table 19: Latin America Market Value (US$ Million) Forecast by Material Type, 2018 to 2033

Table 20: Latin America Market Volume (Tons) Forecast by Material Type, 2018 to 2033

Table 21: Latin America Market Value (US$ Million) Forecast by End Use, 2018 to 2033

Table 22: Latin America Market Volume (Tons) Forecast by End Use, 2018 to 2033

Table 23: Latin America Market Value (US$ Million) Forecast by Packaging type, 2018 to 2033

Table 24: Latin America Market Volume (Tons) Forecast by Packaging type, 2018 to 2033

Table 25: Western Europe Market Value (US$ Million) Forecast by Country, 2018 to 2033

Table 26: Western Europe Market Volume (Tons) Forecast by Country, 2018 to 2033

Table 27: Western Europe Market Value (US$ Million) Forecast by Material Type, 2018 to 2033

Table 28: Western Europe Market Volume (Tons) Forecast by Material Type, 2018 to 2033

Table 29: Western Europe Market Value (US$ Million) Forecast by End Use, 2018 to 2033

Table 30: Western Europe Market Volume (Tons) Forecast by End Use, 2018 to 2033

Table 31: Western Europe Market Value (US$ Million) Forecast by Packaging type, 2018 to 2033

Table 32: Western Europe Market Volume (Tons) Forecast by Packaging type, 2018 to 2033

Table 33: Eastern Europe Market Value (US$ Million) Forecast by Country, 2018 to 2033

Table 34: Eastern Europe Market Volume (Tons) Forecast by Country, 2018 to 2033

Table 35: Eastern Europe Market Value (US$ Million) Forecast by Material Type, 2018 to 2033

Table 36: Eastern Europe Market Volume (Tons) Forecast by Material Type, 2018 to 2033

Table 37: Eastern Europe Market Value (US$ Million) Forecast by End Use, 2018 to 2033

Table 38: Eastern Europe Market Volume (Tons) Forecast by End Use, 2018 to 2033

Table 39: Eastern Europe Market Value (US$ Million) Forecast by Packaging type, 2018 to 2033

Table 40: Eastern Europe Market Volume (Tons) Forecast by Packaging type, 2018 to 2033

Table 41: South Asia and Pacific Market Value (US$ Million) Forecast by Country, 2018 to 2033

Table 42: South Asia and Pacific Market Volume (Tons) Forecast by Country, 2018 to 2033

Table 43: South Asia and Pacific Market Value (US$ Million) Forecast by Material Type, 2018 to 2033

Table 44: South Asia and Pacific Market Volume (Tons) Forecast by Material Type, 2018 to 2033

Table 45: South Asia and Pacific Market Value (US$ Million) Forecast by End Use, 2018 to 2033

Table 46: South Asia and Pacific Market Volume (Tons) Forecast by End Use, 2018 to 2033

Table 47: South Asia and Pacific Market Value (US$ Million) Forecast by Packaging type, 2018 to 2033

Table 48: South Asia and Pacific Market Volume (Tons) Forecast by Packaging type, 2018 to 2033

Table 49: East Asia Market Value (US$ Million) Forecast by Country, 2018 to 2033

Table 50: East Asia Market Volume (Tons) Forecast by Country, 2018 to 2033

Table 51: East Asia Market Value (US$ Million) Forecast by Material Type, 2018 to 2033

Table 52: East Asia Market Volume (Tons) Forecast by Material Type, 2018 to 2033

Table 53: East Asia Market Value (US$ Million) Forecast by End Use, 2018 to 2033

Table 54: East Asia Market Volume (Tons) Forecast by End Use, 2018 to 2033

Table 55: East Asia Market Value (US$ Million) Forecast by Packaging type, 2018 to 2033

Table 56: East Asia Market Volume (Tons) Forecast by Packaging type, 2018 to 2033

Table 57: Middle East and Africa Market Value (US$ Million) Forecast by Country, 2018 to 2033

Table 58: Middle East and Africa Market Volume (Tons) Forecast by Country, 2018 to 2033

Table 59: Middle East and Africa Market Value (US$ Million) Forecast by Material Type, 2018 to 2033

Table 60: Middle East and Africa Market Volume (Tons) Forecast by Material Type, 2018 to 2033

Table 61: Middle East and Africa Market Value (US$ Million) Forecast by End Use, 2018 to 2033

Table 62: Middle East and Africa Market Volume (Tons) Forecast by End Use, 2018 to 2033

Table 63: Middle East and Africa Market Value (US$ Million) Forecast by Packaging type, 2018 to 2033

Table 64: Middle East and Africa Market Volume (Tons) Forecast by Packaging type, 2018 to 2033

List of Charts

Figure 1: Global Market Value (US$ Million) by Material Type, 2023 to 2033

Figure 2: Global Market Value (US$ Million) by End Use, 2023 to 2033

Figure 3: Global Market Value (US$ Million) by Packaging type, 2023 to 2033

Figure 4: Global Market Value (US$ Million) by Region, 2023 to 2033

Figure 5: Global Market Value (US$ Million) Analysis by Region, 2018 to 2033

Figure 6: Global Market Volume (Tons) Analysis by Region, 2018 to 2033

Figure 7: Global Market Value Share (%) and BPS Analysis by Region, 2023 to 2033

Figure 8: Global Market Y-o-Y Growth (%) Projections by Region, 2023 to 2033

Figure 9: Global Market Value (US$ Million) Analysis by Material Type, 2018 to 2033

Figure 10: Global Market Volume (Tons) Analysis by Material Type, 2018 to 2033

Figure 11: Global Market Value Share (%) and BPS Analysis by Material Type, 2023 to 2033

Figure 12: Global Market Y-o-Y Growth (%) Projections by Material Type, 2023 to 2033

Figure 13: Global Market Value (US$ Million) Analysis by End Use, 2018 to 2033

Figure 14: Global Market Volume (Tons) Analysis by End Use, 2018 to 2033

Figure 15: Global Market Value Share (%) and BPS Analysis by End Use, 2023 to 2033

Figure 16: Global Market Y-o-Y Growth (%) Projections by End Use, 2023 to 2033

Figure 17: Global Market Value (US$ Million) Analysis by Packaging type, 2018 to 2033

Figure 18: Global Market Volume (Tons) Analysis by Packaging type, 2018 to 2033

Figure 19: Global Market Value Share (%) and BPS Analysis by Packaging type, 2023 to 2033

Figure 20: Global Market Y-o-Y Growth (%) Projections by Packaging type, 2023 to 2033

Figure 21: Global Market Attractiveness by Material Type, 2023 to 2033

Figure 22: Global Market Attractiveness by End Use, 2023 to 2033

Figure 23: Global Market Attractiveness by Packaging type, 2023 to 2033

Figure 24: Global Market Attractiveness by Region, 2023 to 2033

Figure 25: North America Market Value (US$ Million) by Material Type, 2023 to 2033

Figure 26: North America Market Value (US$ Million) by End Use, 2023 to 2033

Figure 27: North America Market Value (US$ Million) by Packaging type, 2023 to 2033

Figure 28: North America Market Value (US$ Million) by Country, 2023 to 2033

Figure 29: North America Market Value (US$ Million) Analysis by Country, 2018 to 2033

Figure 30: North America Market Volume (Tons) Analysis by Country, 2018 to 2033

Figure 31: North America Market Value Share (%) and BPS Analysis by Country, 2023 to 2033

Figure 32: North America Market Y-o-Y Growth (%) Projections by Country, 2023 to 2033

Figure 33: North America Market Value (US$ Million) Analysis by Material Type, 2018 to 2033

Figure 34: North America Market Volume (Tons) Analysis by Material Type, 2018 to 2033

Figure 35: North America Market Value Share (%) and BPS Analysis by Material Type, 2023 to 2033

Figure 36: North America Market Y-o-Y Growth (%) Projections by Material Type, 2023 to 2033

Figure 37: North America Market Value (US$ Million) Analysis by End Use, 2018 to 2033

Figure 38: North America Market Volume (Tons) Analysis by End Use, 2018 to 2033

Figure 39: North America Market Value Share (%) and BPS Analysis by End Use, 2023 to 2033

Figure 40: North America Market Y-o-Y Growth (%) Projections by End Use, 2023 to 2033

Figure 41: North America Market Value (US$ Million) Analysis by Packaging type, 2018 to 2033

Figure 42: North America Market Volume (Tons) Analysis by Packaging type, 2018 to 2033

Figure 43: North America Market Value Share (%) and BPS Analysis by Packaging type, 2023 to 2033

Figure 44: North America Market Y-o-Y Growth (%) Projections by Packaging type, 2023 to 2033

Figure 45: North America Market Attractiveness by Material Type, 2023 to 2033

Figure 46: North America Market Attractiveness by End Use, 2023 to 2033

Figure 47: North America Market Attractiveness by Packaging type, 2023 to 2033

Figure 48: North America Market Attractiveness by Country, 2023 to 2033

Figure 49: Latin America Market Value (US$ Million) by Material Type, 2023 to 2033

Figure 50: Latin America Market Value (US$ Million) by End Use, 2023 to 2033

Figure 51: Latin America Market Value (US$ Million) by Packaging type, 2023 to 2033

Figure 52: Latin America Market Value (US$ Million) by Country, 2023 to 2033

Figure 53: Latin America Market Value (US$ Million) Analysis by Country, 2018 to 2033

Figure 54: Latin America Market Volume (Tons) Analysis by Country, 2018 to 2033

Figure 55: Latin America Market Value Share (%) and BPS Analysis by Country, 2023 to 2033

Figure 56: Latin America Market Y-o-Y Growth (%) Projections by Country, 2023 to 2033

Figure 57: Latin America Market Value (US$ Million) Analysis by Material Type, 2018 to 2033

Figure 58: Latin America Market Volume (Tons) Analysis by Material Type, 2018 to 2033

Figure 59: Latin America Market Value Share (%) and BPS Analysis by Material Type, 2023 to 2033

Figure 60: Latin America Market Y-o-Y Growth (%) Projections by Material Type, 2023 to 2033

Figure 61: Latin America Market Value (US$ Million) Analysis by End Use, 2018 to 2033

Figure 62: Latin America Market Volume (Tons) Analysis by End Use, 2018 to 2033

Figure 63: Latin America Market Value Share (%) and BPS Analysis by End Use, 2023 to 2033

Figure 64: Latin America Market Y-o-Y Growth (%) Projections by End Use, 2023 to 2033

Figure 65: Latin America Market Value (US$ Million) Analysis by Packaging type, 2018 to 2033

Figure 66: Latin America Market Volume (Tons) Analysis by Packaging type, 2018 to 2033

Figure 67: Latin America Market Value Share (%) and BPS Analysis by Packaging type, 2023 to 2033

Figure 68: Latin America Market Y-o-Y Growth (%) Projections by Packaging type, 2023 to 2033

Figure 69: Latin America Market Attractiveness by Material Type, 2023 to 2033

Figure 70: Latin America Market Attractiveness by End Use, 2023 to 2033

Figure 71: Latin America Market Attractiveness by Packaging type, 2023 to 2033

Figure 72: Latin America Market Attractiveness by Country, 2023 to 2033

Figure 73: Western Europe Market Value (US$ Million) by Material Type, 2023 to 2033

Figure 74: Western Europe Market Value (US$ Million) by End Use, 2023 to 2033

Figure 75: Western Europe Market Value (US$ Million) by Packaging type, 2023 to 2033

Figure 76: Western Europe Market Value (US$ Million) by Country, 2023 to 2033

Figure 77: Western Europe Market Value (US$ Million) Analysis by Country, 2018 to 2033

Figure 78: Western Europe Market Volume (Tons) Analysis by Country, 2018 to 2033

Figure 79: Western Europe Market Value Share (%) and BPS Analysis by Country, 2023 to 2033

Figure 80: Western Europe Market Y-o-Y Growth (%) Projections by Country, 2023 to 2033

Figure 81: Western Europe Market Value (US$ Million) Analysis by Material Type, 2018 to 2033

Figure 82: Western Europe Market Volume (Tons) Analysis by Material Type, 2018 to 2033

Figure 83: Western Europe Market Value Share (%) and BPS Analysis by Material Type, 2023 to 2033

Figure 84: Western Europe Market Y-o-Y Growth (%) Projections by Material Type, 2023 to 2033

Figure 85: Western Europe Market Value (US$ Million) Analysis by End Use, 2018 to 2033

Figure 86: Western Europe Market Volume (Tons) Analysis by End Use, 2018 to 2033

Figure 87: Western Europe Market Value Share (%) and BPS Analysis by End Use, 2023 to 2033

Figure 88: Western Europe Market Y-o-Y Growth (%) Projections by End Use, 2023 to 2033

Figure 89: Western Europe Market Value (US$ Million) Analysis by Packaging type, 2018 to 2033

Figure 90: Western Europe Market Volume (Tons) Analysis by Packaging type, 2018 to 2033

Figure 91: Western Europe Market Value Share (%) and BPS Analysis by Packaging type, 2023 to 2033

Figure 92: Western Europe Market Y-o-Y Growth (%) Projections by Packaging type, 2023 to 2033

Figure 93: Western Europe Market Attractiveness by Material Type, 2023 to 2033

Figure 94: Western Europe Market Attractiveness by End Use, 2023 to 2033

Figure 95: Western Europe Market Attractiveness by Packaging type, 2023 to 2033

Figure 96: Western Europe Market Attractiveness by Country, 2023 to 2033

Figure 97: Eastern Europe Market Value (US$ Million) by Material Type, 2023 to 2033

Figure 98: Eastern Europe Market Value (US$ Million) by End Use, 2023 to 2033

Figure 99: Eastern Europe Market Value (US$ Million) by Packaging type, 2023 to 2033

Figure 100: Eastern Europe Market Value (US$ Million) by Country, 2023 to 2033

Figure 101: Eastern Europe Market Value (US$ Million) Analysis by Country, 2018 to 2033

Figure 102: Eastern Europe Market Volume (Tons) Analysis by Country, 2018 to 2033

Figure 103: Eastern Europe Market Value Share (%) and BPS Analysis by Country, 2023 to 2033

Figure 104: Eastern Europe Market Y-o-Y Growth (%) Projections by Country, 2023 to 2033

Figure 105: Eastern Europe Market Value (US$ Million) Analysis by Material Type, 2018 to 2033

Figure 106: Eastern Europe Market Volume (Tons) Analysis by Material Type, 2018 to 2033

Figure 107: Eastern Europe Market Value Share (%) and BPS Analysis by Material Type, 2023 to 2033

Figure 108: Eastern Europe Market Y-o-Y Growth (%) Projections by Material Type, 2023 to 2033

Figure 109: Eastern Europe Market Value (US$ Million) Analysis by End Use, 2018 to 2033

Figure 110: Eastern Europe Market Volume (Tons) Analysis by End Use, 2018 to 2033

Figure 111: Eastern Europe Market Value Share (%) and BPS Analysis by End Use, 2023 to 2033

Figure 112: Eastern Europe Market Y-o-Y Growth (%) Projections by End Use, 2023 to 2033

Figure 113: Eastern Europe Market Value (US$ Million) Analysis by Packaging type, 2018 to 2033

Figure 114: Eastern Europe Market Volume (Tons) Analysis by Packaging type, 2018 to 2033

Figure 115: Eastern Europe Market Value Share (%) and BPS Analysis by Packaging type, 2023 to 2033

Figure 116: Eastern Europe Market Y-o-Y Growth (%) Projections by Packaging type, 2023 to 2033

Figure 117: Eastern Europe Market Attractiveness by Material Type, 2023 to 2033

Figure 118: Eastern Europe Market Attractiveness by End Use, 2023 to 2033

Figure 119: Eastern Europe Market Attractiveness by Packaging type, 2023 to 2033

Figure 120: Eastern Europe Market Attractiveness by Country, 2023 to 2033

Figure 121: South Asia and Pacific Market Value (US$ Million) by Material Type, 2023 to 2033

Figure 122: South Asia and Pacific Market Value (US$ Million) by End Use, 2023 to 2033

Figure 123: South Asia and Pacific Market Value (US$ Million) by Packaging type, 2023 to 2033

Figure 124: South Asia and Pacific Market Value (US$ Million) by Country, 2023 to 2033

Figure 125: South Asia and Pacific Market Value (US$ Million) Analysis by Country, 2018 to 2033

Figure 126: South Asia and Pacific Market Volume (Tons) Analysis by Country, 2018 to 2033

Figure 127: South Asia and Pacific Market Value Share (%) and BPS Analysis by Country, 2023 to 2033

Figure 128: South Asia and Pacific Market Y-o-Y Growth (%) Projections by Country, 2023 to 2033

Figure 129: South Asia and Pacific Market Value (US$ Million) Analysis by Material Type, 2018 to 2033

Figure 130: South Asia and Pacific Market Volume (Tons) Analysis by Material Type, 2018 to 2033

Figure 131: South Asia and Pacific Market Value Share (%) and BPS Analysis by Material Type, 2023 to 2033

Figure 132: South Asia and Pacific Market Y-o-Y Growth (%) Projections by Material Type, 2023 to 2033

Figure 133: South Asia and Pacific Market Value (US$ Million) Analysis by End Use, 2018 to 2033

Figure 134: South Asia and Pacific Market Volume (Tons) Analysis by End Use, 2018 to 2033

Figure 135: South Asia and Pacific Market Value Share (%) and BPS Analysis by End Use, 2023 to 2033

Figure 136: South Asia and Pacific Market Y-o-Y Growth (%) Projections by End Use, 2023 to 2033

Figure 137: South Asia and Pacific Market Value (US$ Million) Analysis by Packaging type, 2018 to 2033

Figure 138: South Asia and Pacific Market Volume (Tons) Analysis by Packaging type, 2018 to 2033

Figure 139: South Asia and Pacific Market Value Share (%) and BPS Analysis by Packaging type, 2023 to 2033

Figure 140: South Asia and Pacific Market Y-o-Y Growth (%) Projections by Packaging type, 2023 to 2033

Figure 141: South Asia and Pacific Market Attractiveness by Material Type, 2023 to 2033

Figure 142: South Asia and Pacific Market Attractiveness by End Use, 2023 to 2033

Figure 143: South Asia and Pacific Market Attractiveness by Packaging type, 2023 to 2033

Figure 144: South Asia and Pacific Market Attractiveness by Country, 2023 to 2033

Figure 145: East Asia Market Value (US$ Million) by Material Type, 2023 to 2033

Figure 146: East Asia Market Value (US$ Million) by End Use, 2023 to 2033

Figure 147: East Asia Market Value (US$ Million) by Packaging type, 2023 to 2033

Figure 148: East Asia Market Value (US$ Million) by Country, 2023 to 2033

Figure 149: East Asia Market Value (US$ Million) Analysis by Country, 2018 to 2033

Figure 150: East Asia Market Volume (Tons) Analysis by Country, 2018 to 2033

Figure 151: East Asia Market Value Share (%) and BPS Analysis by Country, 2023 to 2033

Figure 152: East Asia Market Y-o-Y Growth (%) Projections by Country, 2023 to 2033

Figure 153: East Asia Market Value (US$ Million) Analysis by Material Type, 2018 to 2033

Figure 154: East Asia Market Volume (Tons) Analysis by Material Type, 2018 to 2033

Figure 155: East Asia Market Value Share (%) and BPS Analysis by Material Type, 2023 to 2033

Figure 156: East Asia Market Y-o-Y Growth (%) Projections by Material Type, 2023 to 2033

Figure 157: East Asia Market Value (US$ Million) Analysis by End Use, 2018 to 2033

Figure 158: East Asia Market Volume (Tons) Analysis by End Use, 2018 to 2033

Figure 159: East Asia Market Value Share (%) and BPS Analysis by End Use, 2023 to 2033

Figure 160: East Asia Market Y-o-Y Growth (%) Projections by End Use, 2023 to 2033

Figure 161: East Asia Market Value (US$ Million) Analysis by Packaging type, 2018 to 2033

Figure 162: East Asia Market Volume (Tons) Analysis by Packaging type, 2018 to 2033

Figure 163: East Asia Market Value Share (%) and BPS Analysis by Packaging type, 2023 to 2033

Figure 164: East Asia Market Y-o-Y Growth (%) Projections by Packaging type, 2023 to 2033

Figure 165: East Asia Market Attractiveness by Material Type, 2023 to 2033

Figure 166: East Asia Market Attractiveness by End Use, 2023 to 2033

Figure 167: East Asia Market Attractiveness by Packaging type, 2023 to 2033

Figure 168: East Asia Market Attractiveness by Country, 2023 to 2033

Figure 169: Middle East and Africa Market Value (US$ Million) by Material Type, 2023 to 2033

Figure 170: Middle East and Africa Market Value (US$ Million) by End Use, 2023 to 2033

Figure 171: Middle East and Africa Market Value (US$ Million) by Packaging type, 2023 to 2033

Figure 172: Middle East and Africa Market Value (US$ Million) by Country, 2023 to 2033

Figure 173: Middle East and Africa Market Value (US$ Million) Analysis by Country, 2018 to 2033

Figure 174: Middle East and Africa Market Volume (Tons) Analysis by Country, 2018 to 2033

Figure 175: Middle East and Africa Market Value Share (%) and BPS Analysis by Country, 2023 to 2033

Figure 176: Middle East and Africa Market Y-o-Y Growth (%) Projections by Country, 2023 to 2033

Figure 177: Middle East and Africa Market Value (US$ Million) Analysis by Material Type, 2018 to 2033

Figure 178: Middle East and Africa Market Volume (Tons) Analysis by Material Type, 2018 to 2033

Figure 179: Middle East and Africa Market Value Share (%) and BPS Analysis by Material Type, 2023 to 2033

Figure 180: Middle East and Africa Market Y-o-Y Growth (%) Projections by Material Type, 2023 to 2033

Figure 181: Middle East and Africa Market Value (US$ Million) Analysis by End Use, 2018 to 2033

Figure 182: Middle East and Africa Market Volume (Tons) Analysis by End Use, 2018 to 2033

Figure 183: Middle East and Africa Market Value Share (%) and BPS Analysis by End Use, 2023 to 2033

Figure 184: Middle East and Africa Market Y-o-Y Growth (%) Projections by End Use, 2023 to 2033

Figure 185: Middle East and Africa Market Value (US$ Million) Analysis by Packaging type, 2018 to 2033

Figure 186: Middle East and Africa Market Volume (Tons) Analysis by Packaging type, 2018 to 2033

Figure 187: Middle East and Africa Market Value Share (%) and BPS Analysis by Packaging type, 2023 to 2033

Figure 188: Middle East and Africa Market Y-o-Y Growth (%) Projections by Packaging type, 2023 to 2033

Figure 189: Middle East and Africa Market Attractiveness by Material Type, 2023 to 2033

Figure 190: Middle East and Africa Market Attractiveness by End Use, 2023 to 2033

Figure 191: Middle East and Africa Market Attractiveness by Packaging type, 2023 to 2033

Figure 192: Middle East and Africa Market Attractiveness by Country, 2023 to 2033

Recommendations

Packaging

Metal Food Cans Market

Published : September 2022

Packaging

Metalized Barrier Film Packaging Market

Published : September 2022

Explore Packaging Insights

View Reports