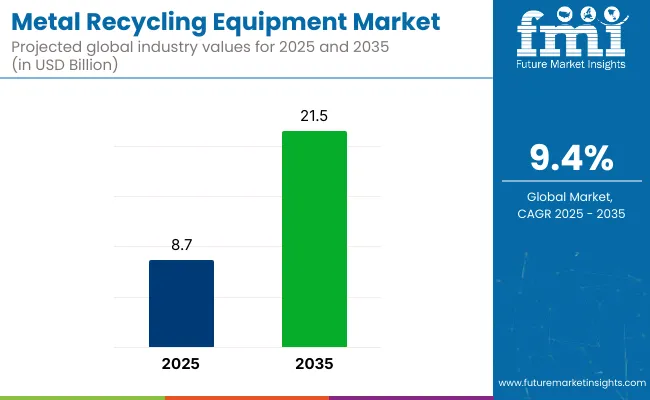
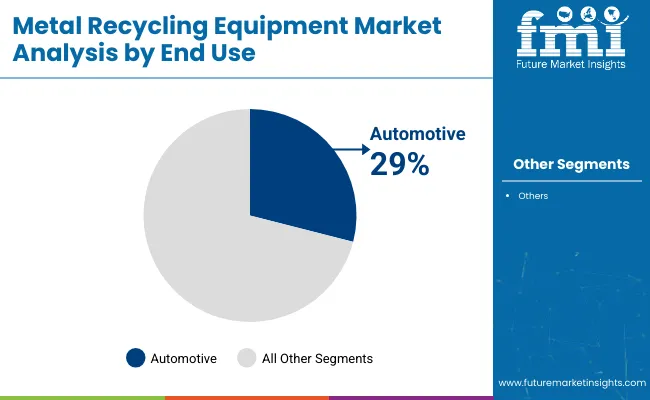
The metal recycling equipment market is set to witness significant expansion over the forecast period, fueled by rising environmental concerns, increasing industrial scrap generation, and stringent government regulations promoting sustainable metal usage. The market is projected to grow from USD 8,704.9 million in 2025 to USD 21,572.8 million by 2035, reflecting a CAGR of 9.5%.
Metal recycling equipment is essential for processing, sorting, and recycling ferrous and non-ferrous metals across various industries, including automotive, construction, electronics, and manufacturing. The demand for efficient and automated metal recycling solutions is increasing due to the rising costs of raw materials, energy conservation efforts, and the push for a circular economy.
The adoption of advanced shredders, balers, shears, and magnetic separators is driving industry growth. The rise of smart recycling facilities, AI-driven sorting technologies, and automation in metal recovery further enhances the market's expansion. The increasing investments in urban mining, scrap metal exports, and e-waste recycling present lucrative opportunities for industry players.
The metal recycling machine market in North America is represented by the USA and Canada both of whom are efficiently handling the environmental pressure via firm environmental regulations, steel and aluminum demand and the waste material problems-solving specific infrastructural development. The area has a tech revolution feel of AI sorting systems investment, scrap processing automation, and cutting edge recovery facilities' launch.
The spot is home to many prominent scrap metal recyclers, government-led sustainability projects, and the minimal acceptance of secondary metal production that acts as the main forces in the market of new recycling equipment.
The 'closed-loop' economy direction of Europe, stringent governmental regulations on environment, and profound industrial metal recycling ecosystems not just contribute to the market growth but are also the primary injectors of the same. Germany, the UK, and France are the dominant countries in the investments in automated scrap recovery, EAFs, and cutting-edge sorting machines adding up the figures.
The EU Green Deal/Carbon neutrality are the two instrumental aspects that throw manufacturers onto the green road and definitely are the driving forces of research and development. The ongoing focus on optimizing secondary metals in the automotive and aerospace fields further supports the demand for high-performance metal recycling equipment.
The fastest-growing in the metal recycling supply industry appears to be Asia-Pacific primarily due to the waves of industrialization together with the birth of scrap metal production and green initiatives from the Government. Countries like China, Japan, South Korea, and India are focusing on scrap metal abroad, making improvements in metal removal systems, and creating eco-friendly infrastructures like e-waste recycling.
China stands at the top of steel and aluminum production while its go green manufacturing pact takes precedence and leads to higher purchasing of modern recycling machines. The construction boom due to urban migration and the relentless quest for sustainable raw material procurement are other contributory factors for the expansion of India.
It's the emerging market of Latin America, the Middle East, and Africa that has been covering the path of development & exploration by being the up surging junk metal recycling sector, renewable energy projects, and the building of a fully functional, green economy.
Latin America particularly reveals the rising need for automated recycling installations in Brazil and Mexico to accompany car making and construction traffic. The aluminum recycling culture of Middle East is throwing the trends into diversification of the industry, fueling market growth while, in Africa, scrap metal deliveries are on the rise along with the e-waste generation which in turn will increase the demand for cheap metal recovery solutions.
High Equipment Costs and Infrastructure Barriers
The key issue with the metal recycling machinery market has to do with the high price of the intricate state of the art machines, specifically the automated sorting, AI-driven separation systems, and high-efficiency smelters. Infrastructure that is huge not only needs a lot of skilled workers but also gets more expensive so it makes the acquisition of good quality and innovative equipment a little difficult, hence, their acceptance of the developing economies.
Regulatory and Compliance Challenges
There are anxious moves on avoiding metal waste management strains such as environmental regulations, emissions control, and hazardous materials due to handling that recycling businesses have to face. Thus, adherence to internationally accepted as well as on-site recycling that has been constantly changing has really gone up the cost and made the industry more difficult for the players.
Adoption of AI and Automation in Metal Recycling
The collection of AI robots and machine learning is forever changing the metal recycling equipment market as they are now integrated into scrap sorting, quality control, and material recovery applications. The smart recycling applications powered with AI not only realize higher efficiency for the facility operation but also lower waste and improve the environmental performance.
Expansion of Urban Mining and E-Waste Recycling
The e-waste recycling and urban mining group are offering tremendous possibility of growth for the market. With the equipment which is more common now that processing of scrap wood, e-waste, cars and batteries is metal recovery plant investment has speeded up. The market of the rare earth metals, lithium-ion battery recycling, and the production of the aluminum through by-products will also add to the ever-growing circle of market expansion.
The sector of metal recycling equipment enjoyed a significant rise of development from 2020 to 2024 solidified by proper environmental awareness, stringent waste management regulations alike, and the metal reusing growth in various industrial sectors. Steel recycling plant has taken over almost all Ihe operations connected to environmental protection, rational use of natural resources, and co2 emissions reduction, thus, it is a cornerstone of the circular economy.
Technologies like automated sorting systems, AI-material identification, and faster shredding that are state of the art have not only made the recycling process effective but also have driven it forward. The production of sustainable materials by the automotive, construction, and electronics industries using these advanced applications is the major factor that is leading to this increased requirement.
The years 2025 to 2035 are expected to be the best time for market expansion to take a spin with the realization of more intelligent recycling technologies that will be more spread, and the increase of funding into urban mining facilities. Material circulation and green technologies will be the driving factors of future machinery development, so they will become smarter and more effective by recovering critical metals better.
Market Shift Analysis
Market Aspect | 2020 to 2024 |
---|---|
Technological Evolution | Adoption of automated sorting, advanced shredding, and magnetic separation. |
Regulatory Changes | Stricter environmental regulations encouraging metal recycling. |
Application Trends | Increased use in automotive, construction, and industrial sectors. |
Market Growth Drivers | Rising demand for sustainable materials, cost-saving benefits, and regulatory push. |
Supply Chain and Investment Trends | Growth in waste management investments, partnerships with recycling firms. |
Market Aspect | 2025 to 2035 Growth Factors |
---|---|
Technological Evolution | AI-driven recycling systems, robotics-based sorting, and smart monitoring for material recovery. |
Regulatory Changes | Global mandates promoting zero-waste policies and extended producer responsibility (EPR) programs. |
Application Trends | Expansion into aerospace, renewable energy, and urban mining applications. |
Market Growth Drivers | Advancements in smart recycling, AI-powered sorting, and increased use of recycled metals. |
Supply Chain and Investment Trends | Expansion of decentralized recycling facilities and advancements in scrap metal tracking. |
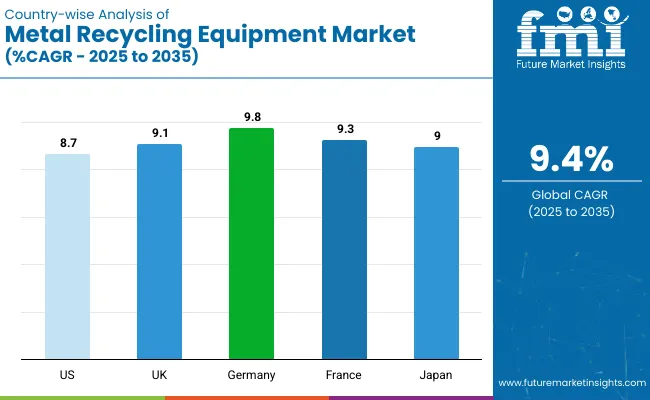
The Metal Recycling Equipment Market is experiencing growth in the United States due to the imposition of strict environmental regulations, the increase in industrial metal consumption, and the growing of eco-friendly manufacturing technologies.
The United States has a developed recycling infrastructure with the participation of companies such as Schnitzer Steel, Nucor Corporation, and Sims Metal Management in cutting-edge shredding, sorting, and smelting technologies.
The USA government’s implementation of the scrap metal export control and recycling incentives policies brought about the increased demand for these products hence the need for automated separation and processing equipment. The rapid expansion of the automotive, construction, and electronics sectors leads to a growing demand for effective metal recovery solutions.
Country | CAGR (2025 to 2035) |
---|---|
United States | 9.8% |
The Metal Recycling Equipment Market in the UK is on a trajectory of growth primarily due to the country's sustainability endeavors, sharp rise in industrial scrap generation and the imposition of strict waste management rules. This sector is led by the likes of European Metal Recycling (EMR) and Ward Recycling, who are the market leaders in pursuit of cutting-edge technology in metal recovery.
Besides, the government's attempt to achieve carbon neutrality is the accelerator for investments going to the automated separation and purification technologies of the metal recycling sector, in which, the automotive sector with its steel and aluminum increase rate is a major demand driver.
Country | CAGR (2025 to 2035) |
---|---|
United Kingdom | 9.3% |
The Metal Recycling Equipment Market in the European Union (EU) is witnessing steady growth due to strict waste management policies, rising circular economy initiatives, and increasing demand for secondary metals in automotive and industrial manufacturing. Key players such as Lindemann, Metso, and TOMRA Systems are driving innovation in automated sorting, smelting, and separation technologies.
The European Union (EU) Climate Deal and the recycling mandates being strictly enforced are what drive the most investment in these smart metal recovery systems, especially in the countries Germany, France, and Italy. The brisk mobilization of vehicles powered by electric energy and the fast-flying development of renewable energy more to use recyclables steel, aluminum, and copper.
Region | CAGR (2025 to 2035) |
---|---|
European Union | 9.4% |
The rise of the Metal Recycling Equipment Market in Japan is primarily due to the ongoing rapid industrialization, the high adoption of the green manufacturing movement, and the technological dominance in safe waste processing solutions. With iconic names like Hitachi Zosen, JFE Engineering, and Morita Holdings to the forefront, Japan is a global force in the field of the development and manufacture of ultra-energy efficient recycling systems.
The Japanese government’s emphasis on the zero waste and the newest materials recovery technologies has become the main mover to install more automatic metal separation, shredding, and refining equipment. On top of this, the advancement of electric vehicles, semiconductor, and electronics industries has been with the demand for high-purity metal recovery suitable for such.
Country | CAGR (2025 to 2035) |
---|---|
Japan | 9.6% |
The metal recycling equipment market in South Korea is in a growth stage as a result of the country being the leading steel and electronics producer, the increase in government support for waste-to-resource initiatives, and the high demand for environmentally-friendly raw materials. Firms like POSCO, Hyundai Steel, and LS-Nikko Copper are committing substantial funds to the development of top-tier recycling facilities.
These companies are not only contributing to the growth of Korea but are also making a significant impact towards achieving the country’s net-zero target. The Green Growth Strategy and Resource Circulation Policy of South Korea have encouraged industries to adopt AI-based metal sorting, smelting, and shredding equipment. The surge in battery metal recycling and urban mining has significantly increased the requirement for energy-efficient metal recovery systems.
Country | CAGR (2025 to 2035) |
---|---|
South Korea | 9.7% |
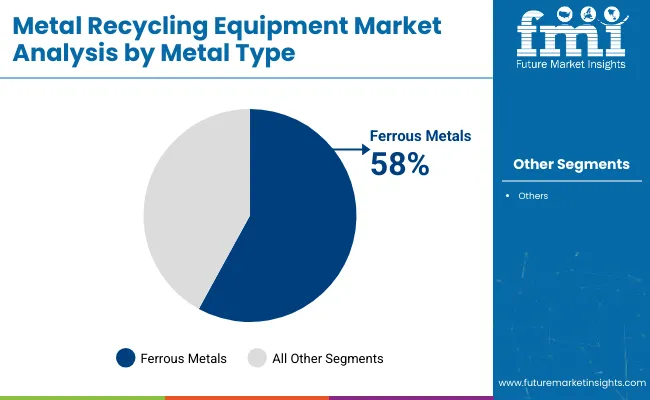
Recycling Metal Ferrous of the Metal Sector Fasten of the Volume Carry
Mostly metals that come from ferrous metals such as iron and steel have a major significance in metal recycling primarily because of their impact in the construction, automotive, and heavy machinery sectors. Steel is the most recycled material on Earth and it is used a lot of by manufacturers that want to lower costs and be environmentally friendly.
The large amount of ferrous scrap collected and the energy saved by recycling steel as compared to producing new steel from iron ore are the major aspects that drive the growth of this segment. On the other hand, improvements in sorting and processing technologies such as magnetic separators and automated shredders are also a reason for the increased efficiency of the ferrous metal recycling processes.
Non-Ferrous Metal Recycling Gears Up for Conflict with Precious Goods
Non-ferrous metals, like aluminum, copper, and brass are highly prized in the recycling market because they have features like the corrosion-resistance, lightweight, and quality immunity after repetitive recycling. The fast growth of aluminum in the automotive and aerospace sector, which is supported by the demand for lightweight and fuel-efficient vehicles, is the reason for increasing nonferrous metal recycling unit gear.
The recycling of copper is on the rise due to the increment of the number of electrical wire and renewable energy applications. Non-ferrous is acquiring the benefits from the affluent separation technologies including eddy current separation and optical sorting systems that brisk recovery rates and gross profit for of recycling businesses.
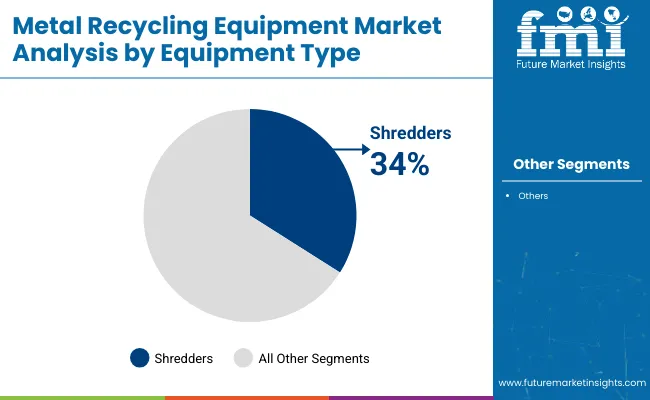
Metal Recycling Equipment Market Machine Type Shredder Leads the Rank Metal Processing Machine
Shredders prove their worth in the metal recycling industry by disintegrating metals of large dimensions into tinier, manageable that will be further processed. Shredders are machines that break up larger crumple whole metals into smaller pieces, thus enhancing the operational efficiency.
Ferrous as well as non-ferrous metal recycling are the balls that are mainly used for shredders which make them a key element in the recycling plant. The main factors that boost this growth are the increasing need for high throughput shredding solutions due to the metal scrap growing amount and the manufacturers' decision to make eco-friendlier and larger shredding machines. Also, modern automations as well as AI solutions like sorting will help shredders perform even better.
Briquetting Machines Provide the Solution for Metal Recycling and Less Waste
Briquetting machines are necessary for the process of metal scrap compaction and turning them into car-size, dense briquettes, which will be a lot easier for storage, handling, and transportation. This kind of equipment eliminates the waste, gets the metal residue, and helps get a better furnace heat in smelting metal processes.
The briquetting machine market has attracted a lot of attention because of the machines' capacity to maximize benefits from metal residues, especially in the case of small to medium operations. The focus of industries on sustainability and waste reduction will lead to growth in the adoption of briquetting machines, with the most potential stakeholders being in the manufacturing, automotive, and aerospace sectors.
The Metal Recycling Equipment market is exploding with the increase of environmental issues, rapid industrialization, and relentless government policies on waste management and sustainability. The market already involves outdated equipment like shredders, shears, balers, granulators, and briquetting machines, which are used in the processing and recycling of metal and waste efficiently. The need for metal recycling is increasing as a result of the reduction of energy consumption, lowering raw material cost, and no more land filling.
Manufacturers will be more customers to automation solutions and processing technologies that will raise efficiency and investment recovery. Key players plan to expand their international reach through merging, acquisitions, and creative product promotions. The applications of IoT and AI -solutions that are based on smart sort and are also green metal recovery which have completely reforms in the industry.
Market Share Analysis by Company
Company Name | Estimated Market Share (%) |
---|---|
Liebherr Group | 18-22% |
Metso Corporation | 14-18% |
CP Manufacturing, Inc. | 10-14% |
Danieli Centro Recycling | 8-12% |
Zato Srl | 5-9% |
Other Companies (combined) | 30-40% |
Company Name | Key Offerings/Activities |
---|---|
Liebherr Group | Develops high-performance scrap handling equipment, such as hydraulic excavators and material handlers with advanced automation. |
Metso Corporation | Provides cutting-edge metal shredders, crushers, and separation systems, integrating AI-based solutions for efficient metal recovery. |
CP Manufacturing, Inc. | Specializes in automated sorting and processing equipment for ferrous and non-ferrous metals with advanced conveyor and baling systems. |
Danieli Centro Recycling | Focuses on high-capacity shredders and shears, offering customized recycling solutions for heavy industrial applications. |
Zato Srl | Manufactures high-efficiency metal shredders and balers, integrating smart control technologies for enhanced operational efficiency. |
Key Company Insights
Liebherr Group
Liebherr Group is a globally recognized leader in the metal recycling equipment business and the manufacture of hydraulic excavators as well as material handling equipment are its core areas of specialization. The company is all about providing high-efficiency, very strong machines specifically designed for the recycling sector.
Liebherr blends automation with intelligence as it implements features such as cutting-edge control systems and energy-efficient motors that, besides enhancing processing capabilities, also help to reduce carbon footprints.
The firm is also active in research studies and development aimed at finding new and better approaches for the metal recycling process which is the reason for their continuous investments in R&D. Widely known for its various locations worldwide, Liebherr is a company that believes in technology and because of that, it is a role model for other companies in the sector.
Metso Corporation
Metso Corporation is the main figure in the metal recycling business and it provides a wide spectrum of shredders, crushers, and separation technologies. In the context of durability, efficiency, and variety, Metso products are the best choice for recycling projects.
Also, the company adds AI-driven sorting technologies which make metal recovery the fastest and the easiest. By virtue of the visionary ideas of its management team that push for collaborations and acquisitions which achieve that, Metso is in a strong position as the go-to choice for advanced recycling facilities. The firm’s commitment to sustainability and the efficient use of resources continues to be the driving force behind its business growth.
CP Manufacturing, Inc.
CP Manufacturing is associated with the highest level of innovation in the realm of technology for the sorting and processing of metal recycling. The hardware that the company makes consists of fully automated sorting conveyors, eddy current separators, and balers with high efficiency.
CP Manufacturing uses advanced sensor-based sorting technologies to enhance metal recoveries, and decrease scrap. It provides these solutions to municipal recycling centers, scrap yards, and industrial recycling plants. CP Manufacturing's focus on continual technological advancements and tailored solutions for customers has facilitated the strong retaining of the market.
Danieli Centro Recycling
Danieli Centro Recycling is a well-known company mainly providing large-sized shredders, shears, and separation systems for metal recycling projects. The top-level processing capabilities of the company contribute to the raising of the recovery rates and the higher quality of metals.
Danieli has a significant part in the heavy industry which is why it also focuses on needs of the big forges, steelworks, and metal manufacturers with tailor-made solutions. Danieli Centro Recycling is still one of the key market players due to the direction in which it pushes investments that are dedicated to the state-of-the-art methods of recycling and also based on the expansion of its product range.
Zato Srl
Zato Srl has established itself as the leading manufacturer of high-performance shredders, balers, and shears for ferrous and non-ferrous metal recycling. The company is recognized for its cutting-edge control technologies integration, which allows for remote monitoring and optimization of processes.
The solution designed by Zato is not only for small recycling enterprises but also for the big industry where it is more profitable. By virtue of the international expansion strategy and the commitment to research and development, Zato is able to strengthen its position in the recycling equipment market.
The market is segmented into Shredders, Shears, Briquetting Machines, Granulators, Balers, and Separators.
The industry is divided into Ferrous Metals (Iron, Steel) and Non-Ferrous Metals (Aluminum, Copper, Lead, Zinc, Others).
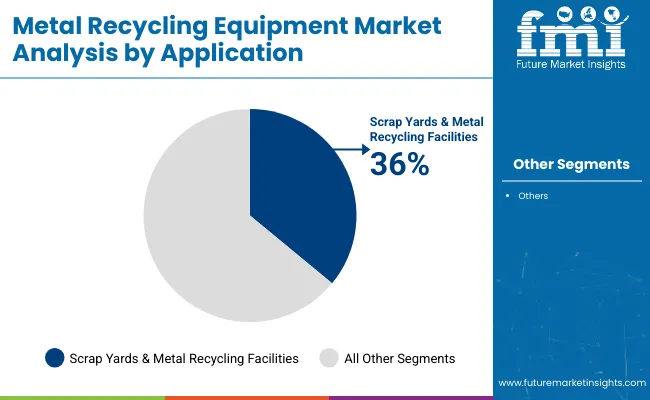
The market caters to Scrap Yard & Metal Recycling Facilities, Automotive Recycling, Construction & Demolition, Electronics Recycling, and Industrial Manufacturing.
The report covers key sectors, including Automotive, Building & Construction, Electrical & Electronics, Aerospace & Defense, and Industrial Machinery.
The report covers key regions, including North America, Latin America, Western Europe, Eastern Europe, East Asia, South Asia, and the Middle East & Africa (MEA).
Table 1: Global Market Value (US$ Million) Forecast by Region, 2018 to 2033
Table 2: Global Market Volume (Units) Forecast by Region, 2018 to 2033
Table 3: Global Market Value (US$ Million) Forecast by Metal Type, 2018 to 2033
Table 4: Global Market Volume (Units) Forecast by Metal Type, 2018 to 2033
Table 5: Global Market Value (US$ Million) Forecast by Machine Type, 2018 to 2033
Table 6: Global Market Volume (Units) Forecast by Machine Type, 2018 to 2033
Table 7: Global Market Value (US$ Million) Forecast by End Use, 2018 to 2033
Table 8: Global Market Volume (Units) Forecast by End Use, 2018 to 2033
Table 9: North America Market Value (US$ Million) Forecast by Country, 2018 to 2033
Table 10: North America Market Volume (Units) Forecast by Country, 2018 to 2033
Table 11: North America Market Value (US$ Million) Forecast by Metal Type, 2018 to 2033
Table 12: North America Market Volume (Units) Forecast by Metal Type, 2018 to 2033
Table 13: North America Market Value (US$ Million) Forecast by Machine Type, 2018 to 2033
Table 14: North America Market Volume (Units) Forecast by Machine Type, 2018 to 2033
Table 15: North America Market Value (US$ Million) Forecast by End Use, 2018 to 2033
Table 16: North America Market Volume (Units) Forecast by End Use, 2018 to 2033
Table 17: Latin America Market Value (US$ Million) Forecast by Country, 2018 to 2033
Table 18: Latin America Market Volume (Units) Forecast by Country, 2018 to 2033
Table 19: Latin America Market Value (US$ Million) Forecast by Metal Type, 2018 to 2033
Table 20: Latin America Market Volume (Units) Forecast by Metal Type, 2018 to 2033
Table 21: Latin America Market Value (US$ Million) Forecast by Machine Type, 2018 to 2033
Table 22: Latin America Market Volume (Units) Forecast by Machine Type, 2018 to 2033
Table 23: Latin America Market Value (US$ Million) Forecast by End Use, 2018 to 2033
Table 24: Latin America Market Volume (Units) Forecast by End Use, 2018 to 2033
Table 25: Western Europe Market Value (US$ Million) Forecast by Country, 2018 to 2033
Table 26: Western Europe Market Volume (Units) Forecast by Country, 2018 to 2033
Table 27: Western Europe Market Value (US$ Million) Forecast by Metal Type, 2018 to 2033
Table 28: Western Europe Market Volume (Units) Forecast by Metal Type, 2018 to 2033
Table 29: Western Europe Market Value (US$ Million) Forecast by Machine Type, 2018 to 2033
Table 30: Western Europe Market Volume (Units) Forecast by Machine Type, 2018 to 2033
Table 31: Western Europe Market Value (US$ Million) Forecast by End Use, 2018 to 2033
Table 32: Western Europe Market Volume (Units) Forecast by End Use, 2018 to 2033
Table 33: Eastern Europe Market Value (US$ Million) Forecast by Country, 2018 to 2033
Table 34: Eastern Europe Market Volume (Units) Forecast by Country, 2018 to 2033
Table 35: Eastern Europe Market Value (US$ Million) Forecast by Metal Type, 2018 to 2033
Table 36: Eastern Europe Market Volume (Units) Forecast by Metal Type, 2018 to 2033
Table 37: Eastern Europe Market Value (US$ Million) Forecast by Machine Type, 2018 to 2033
Table 38: Eastern Europe Market Volume (Units) Forecast by Machine Type, 2018 to 2033
Table 39: Eastern Europe Market Value (US$ Million) Forecast by End Use, 2018 to 2033
Table 40: Eastern Europe Market Volume (Units) Forecast by End Use, 2018 to 2033
Table 41: South Asia and Pacific Market Value (US$ Million) Forecast by Country, 2018 to 2033
Table 42: South Asia and Pacific Market Volume (Units) Forecast by Country, 2018 to 2033
Table 43: South Asia and Pacific Market Value (US$ Million) Forecast by Metal Type, 2018 to 2033
Table 44: South Asia and Pacific Market Volume (Units) Forecast by Metal Type, 2018 to 2033
Table 45: South Asia and Pacific Market Value (US$ Million) Forecast by Machine Type, 2018 to 2033
Table 46: South Asia and Pacific Market Volume (Units) Forecast by Machine Type, 2018 to 2033
Table 47: South Asia and Pacific Market Value (US$ Million) Forecast by End Use, 2018 to 2033
Table 48: South Asia and Pacific Market Volume (Units) Forecast by End Use, 2018 to 2033
Table 49: East Asia Market Value (US$ Million) Forecast by Country, 2018 to 2033
Table 50: East Asia Market Volume (Units) Forecast by Country, 2018 to 2033
Table 51: East Asia Market Value (US$ Million) Forecast by Metal Type, 2018 to 2033
Table 52: East Asia Market Volume (Units) Forecast by Metal Type, 2018 to 2033
Table 53: East Asia Market Value (US$ Million) Forecast by Machine Type, 2018 to 2033
Table 54: East Asia Market Volume (Units) Forecast by Machine Type, 2018 to 2033
Table 55: East Asia Market Value (US$ Million) Forecast by End Use, 2018 to 2033
Table 56: East Asia Market Volume (Units) Forecast by End Use, 2018 to 2033
Table 57: Middle East and Africa Market Value (US$ Million) Forecast by Country, 2018 to 2033
Table 58: Middle East and Africa Market Volume (Units) Forecast by Country, 2018 to 2033
Table 59: Middle East and Africa Market Value (US$ Million) Forecast by Metal Type, 2018 to 2033
Table 60: Middle East and Africa Market Volume (Units) Forecast by Metal Type, 2018 to 2033
Table 61: Middle East and Africa Market Value (US$ Million) Forecast by Machine Type, 2018 to 2033
Table 62: Middle East and Africa Market Volume (Units) Forecast by Machine Type, 2018 to 2033
Table 63: Middle East and Africa Market Value (US$ Million) Forecast by End Use, 2018 to 2033
Table 64: Middle East and Africa Market Volume (Units) Forecast by End Use, 2018 to 2033
Figure 1: Global Market Value (US$ Million) by Metal Type, 2023 to 2033
Figure 2: Global Market Value (US$ Million) by Machine Type, 2023 to 2033
Figure 3: Global Market Value (US$ Million) by End Use, 2023 to 2033
Figure 4: Global Market Value (US$ Million) by Region, 2023 to 2033
Figure 5: Global Market Value (US$ Million) Analysis by Region, 2018 to 2033
Figure 6: Global Market Volume (Units) Analysis by Region, 2018 to 2033
Figure 7: Global Market Value Share (%) and BPS Analysis by Region, 2023 to 2033
Figure 8: Global Market Y-o-Y Growth (%) Projections by Region, 2023 to 2033
Figure 9: Global Market Value (US$ Million) Analysis by Metal Type, 2018 to 2033
Figure 10: Global Market Volume (Units) Analysis by Metal Type, 2018 to 2033
Figure 11: Global Market Value Share (%) and BPS Analysis by Metal Type, 2023 to 2033
Figure 12: Global Market Y-o-Y Growth (%) Projections by Metal Type, 2023 to 2033
Figure 13: Global Market Value (US$ Million) Analysis by Machine Type, 2018 to 2033
Figure 14: Global Market Volume (Units) Analysis by Machine Type, 2018 to 2033
Figure 15: Global Market Value Share (%) and BPS Analysis by Machine Type, 2023 to 2033
Figure 16: Global Market Y-o-Y Growth (%) Projections by Machine Type, 2023 to 2033
Figure 17: Global Market Value (US$ Million) Analysis by End Use, 2018 to 2033
Figure 18: Global Market Volume (Units) Analysis by End Use, 2018 to 2033
Figure 19: Global Market Value Share (%) and BPS Analysis by End Use, 2023 to 2033
Figure 20: Global Market Y-o-Y Growth (%) Projections by End Use, 2023 to 2033
Figure 21: Global Market Attractiveness by Metal Type, 2023 to 2033
Figure 22: Global Market Attractiveness by Machine Type, 2023 to 2033
Figure 23: Global Market Attractiveness by End Use, 2023 to 2033
Figure 24: Global Market Attractiveness by Region, 2023 to 2033
Figure 25: North America Market Value (US$ Million) by Metal Type, 2023 to 2033
Figure 26: North America Market Value (US$ Million) by Machine Type, 2023 to 2033
Figure 27: North America Market Value (US$ Million) by End Use, 2023 to 2033
Figure 28: North America Market Value (US$ Million) by Country, 2023 to 2033
Figure 29: North America Market Value (US$ Million) Analysis by Country, 2018 to 2033
Figure 30: North America Market Volume (Units) Analysis by Country, 2018 to 2033
Figure 31: North America Market Value Share (%) and BPS Analysis by Country, 2023 to 2033
Figure 32: North America Market Y-o-Y Growth (%) Projections by Country, 2023 to 2033
Figure 33: North America Market Value (US$ Million) Analysis by Metal Type, 2018 to 2033
Figure 34: North America Market Volume (Units) Analysis by Metal Type, 2018 to 2033
Figure 35: North America Market Value Share (%) and BPS Analysis by Metal Type, 2023 to 2033
Figure 36: North America Market Y-o-Y Growth (%) Projections by Metal Type, 2023 to 2033
Figure 37: North America Market Value (US$ Million) Analysis by Machine Type, 2018 to 2033
Figure 38: North America Market Volume (Units) Analysis by Machine Type, 2018 to 2033
Figure 39: North America Market Value Share (%) and BPS Analysis by Machine Type, 2023 to 2033
Figure 40: North America Market Y-o-Y Growth (%) Projections by Machine Type, 2023 to 2033
Figure 41: North America Market Value (US$ Million) Analysis by End Use, 2018 to 2033
Figure 42: North America Market Volume (Units) Analysis by End Use, 2018 to 2033
Figure 43: North America Market Value Share (%) and BPS Analysis by End Use, 2023 to 2033
Figure 44: North America Market Y-o-Y Growth (%) Projections by End Use, 2023 to 2033
Figure 45: North America Market Attractiveness by Metal Type, 2023 to 2033
Figure 46: North America Market Attractiveness by Machine Type, 2023 to 2033
Figure 47: North America Market Attractiveness by End Use, 2023 to 2033
Figure 48: North America Market Attractiveness by Country, 2023 to 2033
Figure 49: Latin America Market Value (US$ Million) by Metal Type, 2023 to 2033
Figure 50: Latin America Market Value (US$ Million) by Machine Type, 2023 to 2033
Figure 51: Latin America Market Value (US$ Million) by End Use, 2023 to 2033
Figure 52: Latin America Market Value (US$ Million) by Country, 2023 to 2033
Figure 53: Latin America Market Value (US$ Million) Analysis by Country, 2018 to 2033
Figure 54: Latin America Market Volume (Units) Analysis by Country, 2018 to 2033
Figure 55: Latin America Market Value Share (%) and BPS Analysis by Country, 2023 to 2033
Figure 56: Latin America Market Y-o-Y Growth (%) Projections by Country, 2023 to 2033
Figure 57: Latin America Market Value (US$ Million) Analysis by Metal Type, 2018 to 2033
Figure 58: Latin America Market Volume (Units) Analysis by Metal Type, 2018 to 2033
Figure 59: Latin America Market Value Share (%) and BPS Analysis by Metal Type, 2023 to 2033
Figure 60: Latin America Market Y-o-Y Growth (%) Projections by Metal Type, 2023 to 2033
Figure 61: Latin America Market Value (US$ Million) Analysis by Machine Type, 2018 to 2033
Figure 62: Latin America Market Volume (Units) Analysis by Machine Type, 2018 to 2033
Figure 63: Latin America Market Value Share (%) and BPS Analysis by Machine Type, 2023 to 2033
Figure 64: Latin America Market Y-o-Y Growth (%) Projections by Machine Type, 2023 to 2033
Figure 65: Latin America Market Value (US$ Million) Analysis by End Use, 2018 to 2033
Figure 66: Latin America Market Volume (Units) Analysis by End Use, 2018 to 2033
Figure 67: Latin America Market Value Share (%) and BPS Analysis by End Use, 2023 to 2033
Figure 68: Latin America Market Y-o-Y Growth (%) Projections by End Use, 2023 to 2033
Figure 69: Latin America Market Attractiveness by Metal Type, 2023 to 2033
Figure 70: Latin America Market Attractiveness by Machine Type, 2023 to 2033
Figure 71: Latin America Market Attractiveness by End Use, 2023 to 2033
Figure 72: Latin America Market Attractiveness by Country, 2023 to 2033
Figure 73: Western Europe Market Value (US$ Million) by Metal Type, 2023 to 2033
Figure 74: Western Europe Market Value (US$ Million) by Machine Type, 2023 to 2033
Figure 75: Western Europe Market Value (US$ Million) by End Use, 2023 to 2033
Figure 76: Western Europe Market Value (US$ Million) by Country, 2023 to 2033
Figure 77: Western Europe Market Value (US$ Million) Analysis by Country, 2018 to 2033
Figure 78: Western Europe Market Volume (Units) Analysis by Country, 2018 to 2033
Figure 79: Western Europe Market Value Share (%) and BPS Analysis by Country, 2023 to 2033
Figure 80: Western Europe Market Y-o-Y Growth (%) Projections by Country, 2023 to 2033
Figure 81: Western Europe Market Value (US$ Million) Analysis by Metal Type, 2018 to 2033
Figure 82: Western Europe Market Volume (Units) Analysis by Metal Type, 2018 to 2033
Figure 83: Western Europe Market Value Share (%) and BPS Analysis by Metal Type, 2023 to 2033
Figure 84: Western Europe Market Y-o-Y Growth (%) Projections by Metal Type, 2023 to 2033
Figure 85: Western Europe Market Value (US$ Million) Analysis by Machine Type, 2018 to 2033
Figure 86: Western Europe Market Volume (Units) Analysis by Machine Type, 2018 to 2033
Figure 87: Western Europe Market Value Share (%) and BPS Analysis by Machine Type, 2023 to 2033
Figure 88: Western Europe Market Y-o-Y Growth (%) Projections by Machine Type, 2023 to 2033
Figure 89: Western Europe Market Value (US$ Million) Analysis by End Use, 2018 to 2033
Figure 90: Western Europe Market Volume (Units) Analysis by End Use, 2018 to 2033
Figure 91: Western Europe Market Value Share (%) and BPS Analysis by End Use, 2023 to 2033
Figure 92: Western Europe Market Y-o-Y Growth (%) Projections by End Use, 2023 to 2033
Figure 93: Western Europe Market Attractiveness by Metal Type, 2023 to 2033
Figure 94: Western Europe Market Attractiveness by Machine Type, 2023 to 2033
Figure 95: Western Europe Market Attractiveness by End Use, 2023 to 2033
Figure 96: Western Europe Market Attractiveness by Country, 2023 to 2033
Figure 97: Eastern Europe Market Value (US$ Million) by Metal Type, 2023 to 2033
Figure 98: Eastern Europe Market Value (US$ Million) by Machine Type, 2023 to 2033
Figure 99: Eastern Europe Market Value (US$ Million) by End Use, 2023 to 2033
Figure 100: Eastern Europe Market Value (US$ Million) by Country, 2023 to 2033
Figure 101: Eastern Europe Market Value (US$ Million) Analysis by Country, 2018 to 2033
Figure 102: Eastern Europe Market Volume (Units) Analysis by Country, 2018 to 2033
Figure 103: Eastern Europe Market Value Share (%) and BPS Analysis by Country, 2023 to 2033
Figure 104: Eastern Europe Market Y-o-Y Growth (%) Projections by Country, 2023 to 2033
Figure 105: Eastern Europe Market Value (US$ Million) Analysis by Metal Type, 2018 to 2033
Figure 106: Eastern Europe Market Volume (Units) Analysis by Metal Type, 2018 to 2033
Figure 107: Eastern Europe Market Value Share (%) and BPS Analysis by Metal Type, 2023 to 2033
Figure 108: Eastern Europe Market Y-o-Y Growth (%) Projections by Metal Type, 2023 to 2033
Figure 109: Eastern Europe Market Value (US$ Million) Analysis by Machine Type, 2018 to 2033
Figure 110: Eastern Europe Market Volume (Units) Analysis by Machine Type, 2018 to 2033
Figure 111: Eastern Europe Market Value Share (%) and BPS Analysis by Machine Type, 2023 to 2033
Figure 112: Eastern Europe Market Y-o-Y Growth (%) Projections by Machine Type, 2023 to 2033
Figure 113: Eastern Europe Market Value (US$ Million) Analysis by End Use, 2018 to 2033
Figure 114: Eastern Europe Market Volume (Units) Analysis by End Use, 2018 to 2033
Figure 115: Eastern Europe Market Value Share (%) and BPS Analysis by End Use, 2023 to 2033
Figure 116: Eastern Europe Market Y-o-Y Growth (%) Projections by End Use, 2023 to 2033
Figure 117: Eastern Europe Market Attractiveness by Metal Type, 2023 to 2033
Figure 118: Eastern Europe Market Attractiveness by Machine Type, 2023 to 2033
Figure 119: Eastern Europe Market Attractiveness by End Use, 2023 to 2033
Figure 120: Eastern Europe Market Attractiveness by Country, 2023 to 2033
Figure 121: South Asia and Pacific Market Value (US$ Million) by Metal Type, 2023 to 2033
Figure 122: South Asia and Pacific Market Value (US$ Million) by Machine Type, 2023 to 2033
Figure 123: South Asia and Pacific Market Value (US$ Million) by End Use, 2023 to 2033
Figure 124: South Asia and Pacific Market Value (US$ Million) by Country, 2023 to 2033
Figure 125: South Asia and Pacific Market Value (US$ Million) Analysis by Country, 2018 to 2033
Figure 126: South Asia and Pacific Market Volume (Units) Analysis by Country, 2018 to 2033
Figure 127: South Asia and Pacific Market Value Share (%) and BPS Analysis by Country, 2023 to 2033
Figure 128: South Asia and Pacific Market Y-o-Y Growth (%) Projections by Country, 2023 to 2033
Figure 129: South Asia and Pacific Market Value (US$ Million) Analysis by Metal Type, 2018 to 2033
Figure 130: South Asia and Pacific Market Volume (Units) Analysis by Metal Type, 2018 to 2033
Figure 131: South Asia and Pacific Market Value Share (%) and BPS Analysis by Metal Type, 2023 to 2033
Figure 132: South Asia and Pacific Market Y-o-Y Growth (%) Projections by Metal Type, 2023 to 2033
Figure 133: South Asia and Pacific Market Value (US$ Million) Analysis by Machine Type, 2018 to 2033
Figure 134: South Asia and Pacific Market Volume (Units) Analysis by Machine Type, 2018 to 2033
Figure 135: South Asia and Pacific Market Value Share (%) and BPS Analysis by Machine Type, 2023 to 2033
Figure 136: South Asia and Pacific Market Y-o-Y Growth (%) Projections by Machine Type, 2023 to 2033
Figure 137: South Asia and Pacific Market Value (US$ Million) Analysis by End Use, 2018 to 2033
Figure 138: South Asia and Pacific Market Volume (Units) Analysis by End Use, 2018 to 2033
Figure 139: South Asia and Pacific Market Value Share (%) and BPS Analysis by End Use, 2023 to 2033
Figure 140: South Asia and Pacific Market Y-o-Y Growth (%) Projections by End Use, 2023 to 2033
Figure 141: South Asia and Pacific Market Attractiveness by Metal Type, 2023 to 2033
Figure 142: South Asia and Pacific Market Attractiveness by Machine Type, 2023 to 2033
Figure 143: South Asia and Pacific Market Attractiveness by End Use, 2023 to 2033
Figure 144: South Asia and Pacific Market Attractiveness by Country, 2023 to 2033
Figure 145: East Asia Market Value (US$ Million) by Metal Type, 2023 to 2033
Figure 146: East Asia Market Value (US$ Million) by Machine Type, 2023 to 2033
Figure 147: East Asia Market Value (US$ Million) by End Use, 2023 to 2033
Figure 148: East Asia Market Value (US$ Million) by Country, 2023 to 2033
Figure 149: East Asia Market Value (US$ Million) Analysis by Country, 2018 to 2033
Figure 150: East Asia Market Volume (Units) Analysis by Country, 2018 to 2033
Figure 151: East Asia Market Value Share (%) and BPS Analysis by Country, 2023 to 2033
Figure 152: East Asia Market Y-o-Y Growth (%) Projections by Country, 2023 to 2033
Figure 153: East Asia Market Value (US$ Million) Analysis by Metal Type, 2018 to 2033
Figure 154: East Asia Market Volume (Units) Analysis by Metal Type, 2018 to 2033
Figure 155: East Asia Market Value Share (%) and BPS Analysis by Metal Type, 2023 to 2033
Figure 156: East Asia Market Y-o-Y Growth (%) Projections by Metal Type, 2023 to 2033
Figure 157: East Asia Market Value (US$ Million) Analysis by Machine Type, 2018 to 2033
Figure 158: East Asia Market Volume (Units) Analysis by Machine Type, 2018 to 2033
Figure 159: East Asia Market Value Share (%) and BPS Analysis by Machine Type, 2023 to 2033
Figure 160: East Asia Market Y-o-Y Growth (%) Projections by Machine Type, 2023 to 2033
Figure 161: East Asia Market Value (US$ Million) Analysis by End Use, 2018 to 2033
Figure 162: East Asia Market Volume (Units) Analysis by End Use, 2018 to 2033
Figure 163: East Asia Market Value Share (%) and BPS Analysis by End Use, 2023 to 2033
Figure 164: East Asia Market Y-o-Y Growth (%) Projections by End Use, 2023 to 2033
Figure 165: East Asia Market Attractiveness by Metal Type, 2023 to 2033
Figure 166: East Asia Market Attractiveness by Machine Type, 2023 to 2033
Figure 167: East Asia Market Attractiveness by End Use, 2023 to 2033
Figure 168: East Asia Market Attractiveness by Country, 2023 to 2033
Figure 169: Middle East and Africa Market Value (US$ Million) by Metal Type, 2023 to 2033
Figure 170: Middle East and Africa Market Value (US$ Million) by Machine Type, 2023 to 2033
Figure 171: Middle East and Africa Market Value (US$ Million) by End Use, 2023 to 2033
Figure 172: Middle East and Africa Market Value (US$ Million) by Country, 2023 to 2033
Figure 173: Middle East and Africa Market Value (US$ Million) Analysis by Country, 2018 to 2033
Figure 174: Middle East and Africa Market Volume (Units) Analysis by Country, 2018 to 2033
Figure 175: Middle East and Africa Market Value Share (%) and BPS Analysis by Country, 2023 to 2033
Figure 176: Middle East and Africa Market Y-o-Y Growth (%) Projections by Country, 2023 to 2033
Figure 177: Middle East and Africa Market Value (US$ Million) Analysis by Metal Type, 2018 to 2033
Figure 178: Middle East and Africa Market Volume (Units) Analysis by Metal Type, 2018 to 2033
Figure 179: Middle East and Africa Market Value Share (%) and BPS Analysis by Metal Type, 2023 to 2033
Figure 180: Middle East and Africa Market Y-o-Y Growth (%) Projections by Metal Type, 2023 to 2033
Figure 181: Middle East and Africa Market Value (US$ Million) Analysis by Machine Type, 2018 to 2033
Figure 182: Middle East and Africa Market Volume (Units) Analysis by Machine Type, 2018 to 2033
Figure 183: Middle East and Africa Market Value Share (%) and BPS Analysis by Machine Type, 2023 to 2033
Figure 184: Middle East and Africa Market Y-o-Y Growth (%) Projections by Machine Type, 2023 to 2033
Figure 185: Middle East and Africa Market Value (US$ Million) Analysis by End Use, 2018 to 2033
Figure 186: Middle East and Africa Market Volume (Units) Analysis by End Use, 2018 to 2033
Figure 187: Middle East and Africa Market Value Share (%) and BPS Analysis by End Use, 2023 to 2033
Figure 188: Middle East and Africa Market Y-o-Y Growth (%) Projections by End Use, 2023 to 2033
Figure 189: Middle East and Africa Market Attractiveness by Metal Type, 2023 to 2033
Figure 190: Middle East and Africa Market Attractiveness by Machine Type, 2023 to 2033
Figure 191: Middle East and Africa Market Attractiveness by End Use, 2023 to 2033
Figure 192: Middle East and Africa Market Attractiveness by Country, 2023 to 2033
The global metal recycling equipment market is projected to reach USD 8,704.9 million by the end of 2025.
The market is anticipated to grow at a CAGR of 9.5% over the forecast period.
By 2035, the metal recycling equipment market is expected to reach USD 21,572.8 million.
The Shredders segment is expected to dominate the market due to its efficiency in processing large volumes of scrap metal and increasing demand from recycling facilities.
Key players in the metal recycling equipment market include Metso Corporation, Danieli Centro Recycling, American Pulverizer Company, JMC Recycling Systems Ltd., Eldan Recycling A/S, BHS Sonthofen GmbH, and CP Manufacturing Inc.
Explore Responsible Resource Management & Safety Insights
Thank you!
You will receive an email from our Business Development Manager. Please be sure to check your SPAM/JUNK folder too.