The metal membrane ammonia cracker market is poised for substantial growth, with the forecasted market value soaring from USD 204.1 million in 2025 to USD 1,350.9 million by 2035, reflecting an exceptional CAGR of 20.8%. This rapid growth is attributed to a variety of market dynamics, particularly the increasing adoption of ammonia as a clean fuel alternative in various industries.
A significant driver is the growing demand for hydrogen production, where metal membrane ammonia crackers are proving to be more efficient and cost-effective compared to traditional methods. This trend is aligned with shifting industrial practices that favor cleaner, more sustainable processes. Additionally, regulatory changes and government policies that incentivize the use of green technologies are further accelerating the demand for ammonia crackers. Companies across various sectors, including power generation and chemical manufacturing, are increasingly investing in these solutions, driven by both economic and environmental factors.
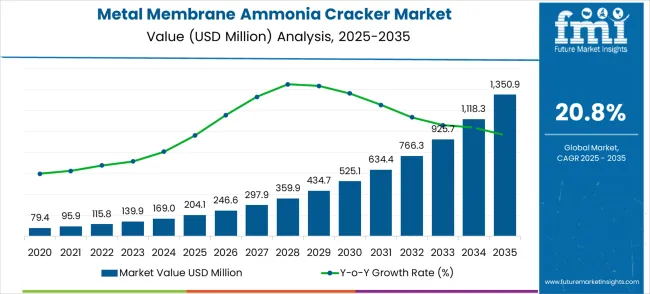
The rapid YoY spikes in the metal membrane ammonia cracker market are also reflective of broader shifts in the global energy and manufacturing landscapes. As industries face pressure to reduce their carbon footprint, there has been a growing trend toward adopting ammonia-based processes to meet sustainability targets. Consumer preferences, particularly in industries like agriculture and energy, are aligning with these changes, where ammonia is used as a cleaner alternative to conventional fuels. Moreover, growing infrastructure investments in ammonia production and distribution networks, supported by favorable policies, are helping fuel the adoption of ammonia crackers.
This accelerating pace is expected to persist through the forecast period, with key industry players actively expanding their product offerings to meet evolving consumer needs. The increasing integration of ammonia-based systems in various sectors promises to keep the market on a robust growth trajectory, reshaping the energy landscape along the way.
| Metric | Value |
|---|---|
| Market Value (2025) | USD 204.1 million |
| Market Forecast Value (2035) | USD 1,350.9 million |
| Forecast CAGR (2025-2035) | 20.8% |
The metal membrane ammonia cracker market has been assessed within various industrial domains, capturing an estimated 4.5% of the ammonia production market, 6.7% of the hydrogen production market, 5.2% of the chemical process equipment market, 3.9% of the industrial gas equipment market, and 2.8% of the renewable energy equipment market. In total, the market holds a combined share of approximately 23.1% across these parent industries. This reflects how metal membrane ammonia crackers are becoming increasingly significant in producing high-purity hydrogen while enhancing the efficiency of ammonia cracking processes. The adoption of these advanced systems has been recognized by manufacturers as a more reliable and effective solution, contributing to the growing interest in cleaner, more sustainable industrial processes.
The metal membrane ammonia cracker market expands through enabling efficient hydrogen extraction from ammonia carriers, reducing the operational complexity and energy requirements of hydrogen supply chains. Maritime industry decarbonization mandates drive adoption as shipping companies implement ammonia-to-hydrogen conversion for fuel cell propulsion systems. Industrial hydrogen users integrate these crackers to access hydrogen from ammonia storage and transportation networks. Government hydrogen economy investments across Asia Pacific and Europe accelerate deployment in industrial facilities and marine applications. Membrane technology advances improve hydrogen selectivity and system durability while reducing operational costs. However, high palladium-based membrane costs and limited manufacturing capacity create adoption barriers for price-sensitive industrial applications.
The metal membrane ammonia cracker market (USD 204.1M → 1,350.9M by 2035, CAGR ~21%) is accelerating due to the global hydrogen economy push, ammonia’s role as a hydrogen carrier, and advances in Pd-based membrane separation technologies. Together, membrane-type innovation and end-use diversification unlock USD 1.1–1.2B in incremental revenue opportunities by 2035 (aligned with the ~USD 1,146.8M market expansion).
Pathway A – Pd-Ag Membrane Technology for Maritime Fuel Transition Adoption of Pd-Ag membrane ammonia crackers to supply clean hydrogen for shipping decarbonization, backed by players like Fortescue and Siemens.
The market is segmented by membrane type, end-use, and region. By membrane type, the market is divided into Pd-Ag membrane technology, Pd-Cu membrane technology, ceramic membranes, and polymer membranes. Based on end-use, the market is categorized into ship, automobile, hydrogen generation plant, and industrial facilities. Regionally, the market is divided into North America, Latin America, Europe, East Asia, South Asia & Pacific, and Middle East & Africa.
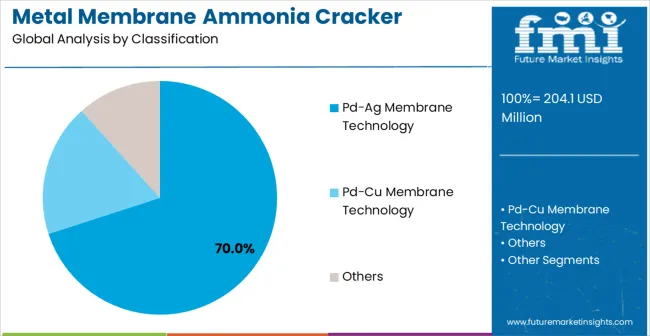
Pd-Ag membrane technology is projected to capture 76% of the global metal membrane ammonia cracker market in 2025, highlighting its dominance due to exceptional hydrogen selectivity and operational stability. These membranes excel in high-temperature ammonia cracking environments, maintaining permeability while resisting sulfur poisoning, a key challenge in hydrogen generation processes. Their ability to deliver consistently high hydrogen purity at moderate pressures makes them the most dependable choice for large-scale and commercial deployment. Pd-Ag membranes also enjoy a proven history of performance across harsh industrial and maritime applications, reinforcing their reputation as the industry benchmark. Ongoing R&D and advances in alloy formulations continue to enhance cost-effectiveness, efficiency, and scalability, further cementing their leadership.
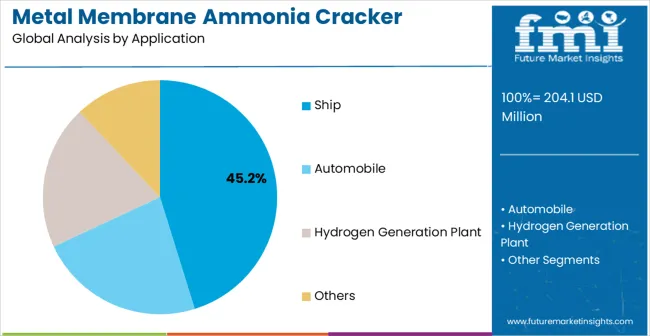
Ship applications are forecasted to account for 45.2% of demand in the global metal membrane ammonia cracker market in 2025. This dominance stems from the shipping industry’s accelerated transition toward ammonia as a carbon-neutral fuel to reduce reliance on fossil fuels. Onboard ammonia crackers provide flexible and reliable hydrogen generation to support both propulsion through fuel cells and auxiliary power needs, aligning with IMO decarbonization mandates. Their adoption ensures compliance with evolving emission standards while enabling vessel operators to adapt to carbon pricing mechanisms. Integration of ammonia cracking systems also supports global shipping route flexibility by allowing vessels to leverage ammonia as a widely traded, storable, and cost-effective energy carrier. As decarbonization pressure intensifies, ship-based applications will remain the leading growth engine for the industry.
Market growth stems from maritime decarbonization mandates requiring ammonia-to-hydrogen conversion for fuel cell propulsion, industrial hydrogen supply chain optimization reducing transportation costs, and government hydrogen economy investments accelerating technology deployment across multiple sectors. These drivers create measurable outcomes including reduced shipping emissions, lower hydrogen delivery costs, and improved energy security through diversified supply sources. Technology advances enable cost-per-outcome compression through improved membrane efficiency and system reliability.
Market expansion faces constraints from high palladium membrane costs limiting system economics, complex integration requirements with existing hydrogen infrastructure, and regulatory uncertainty surrounding ammonia handling and storage in marine applications. Technology substitutes including direct ammonia fuel cells and alternative hydrogen production methods compete for market share in specific applications. Limited manufacturing capacity creates supply bottlenecks for rapid deployment across multiple sectors.
Adoption accelerates in Asia Pacific maritime hubs and European industrial clusters where hydrogen infrastructure development supports membrane cracker deployment. System designs shift toward modular architectures enabling capacity scaling and improved membrane durability extending operational lifespans. The growth thesis breaks if membrane material costs fail to decline or direct ammonia combustion technologies achieve comparable efficiency without hydrogen conversion requirements.
| Country | CAGR (2025-2035) |
|---|---|
| China | 28.1% |
| India | 26% |
| Germany | 23.9% |
| Brazil | 21.8% |
| United States | 19.8% |
| United Kingdom | 17.7% |
| Japan | 15.6% |
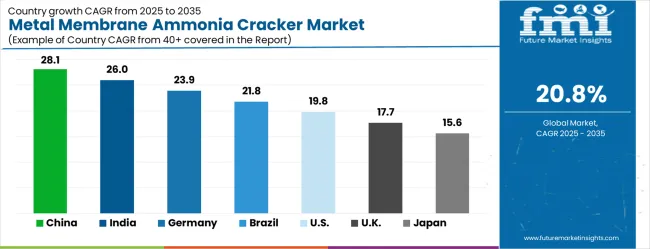
The metal membrane ammonia cracker market is gathering pace worldwide, with China taking the lead thanks to massive hydrogen economy investments and comprehensive maritime decarbonization programs. Close behind, India benefits from expanding industrial hydrogen demand and government clean energy initiatives, positioning itself as a strategic growth hub. Germany shows steady advancement, where advanced membrane technology development strengthens its role in the regional supply chain. Brazil is sharpening focus on industrial applications and maritime fuel diversification, signaling an ambition to capture niche opportunities. Meanwhile, United States stands out for its technology innovation capabilities, and United Kingdom and Japan continue to record consistent progress. Together, China and India anchor the global expansion story, while the rest build stability and diversity into the market's growth path.
The report covers an in-depth analysis of 40+ countries; seven top-performing countries are highlighted below.
China leads global metal membrane ammonia cracker adoption with comprehensive hydrogen economy development programs and extensive maritime industry transformation initiatives supported by government funding exceeding $15 billion for hydrogen infrastructure projects. Revenue growth at 28.1% CAGR through 2035 reflects deployment across shipping companies in Shanghai, Qingdao, and Ningbo, where ammonia-to-hydrogen conversion supports fuel cell vessel development and port infrastructure modernization. Chinese shipbuilders integrate cracking systems into new vessel designs while industrial manufacturers implement hydrogen supply chain optimization strategies. State-owned shipping companies adopt ammonia fuel systems requiring onboard hydrogen generation, creating substantial demand for membrane technologies. Technology companies receive government funding for membrane research and manufacturing capacity expansion to serve domestic and export markets across Asia Pacific regions.
In Mumbai, Chennai, and Kolkata, adoption of metal membrane ammonia crackers is accelerating across industrial facilities implementing hydrogen supply chain modernization programs. Industrial manufacturers integrate cracking systems into chemical processing and refining operations where hydrogen demand supports production efficiency improvements and environmental compliance requirements. Revenue expansion at 26.0% CAGR through 2035 stems from industrial decarbonization requirements and growing maritime fuel diversification initiatives in major shipping hubs. Government programs promote hydrogen economy development through technology incentives and infrastructure funding that facilitate membrane cracker adoption across industrial sectors. Educational initiatives and technology transfer programs develop domestic capabilities for advanced hydrogen production and ammonia conversion technologies.
Germany maintains technological leadership in membrane development with comprehensive research programs demonstrating system efficiency improvements exceeding 15% compared to conventional hydrogen production methods. Hamburg, Bremen, and Rostock serve as testing centers where shipping companies evaluate ammonia cracking systems for North Sea operations and European maritime routes. German maritime technology companies develop integrated solutions combining membrane crackers with fuel cell propulsion systems for commercial vessels and offshore applications. Industrial facilities across the Rhine region implement hydrogen supply diversification strategies that reduce dependence on pipeline networks through ammonia-based systems. Advanced technology partnerships facilitate innovation development and knowledge sharing across maritime and hydrogen production sectors. CAGR reaches 23.9% through 2035.
Brazilian industrial facilities demonstrate growing adoption through petrochemical complexes requiring hydrogen supply diversification and shipping companies implementing fuel flexibility strategies across South American trade routes. Santos, Rio de Janeiro, and Recife emerge as deployment centers where membrane crackers support industrial hydrogen requirements and maritime fuel infrastructure development programs. Government programs supporting industrial modernization facilitate access to advanced cracking technologies and technical expertise through international partnerships. The market faces challenges from limited membrane manufacturing capacity and integration complexity with existing hydrogen systems requiring specialized technical support. Regional industrial development centers establish specialized capabilities that support technology deployment and operational support across diverse geographic markets and industrial applications.
United States leads technological innovation with government funding supporting advanced membrane research and commercial demonstration projects across multiple industries including maritime, industrial, and power generation sectors. Revenue growth at 19.8% CAGR through 2035 reflects cost-per-outcome compression under compliance and reliability constraints as industrial users optimize hydrogen supply economics through ammonia cracking systems. Houston, Long Beach, and New York serve as deployment centers where shipping companies and industrial facilities implement membrane technologies for operational efficiency improvements and environmental compliance. Maritime operators adopt ammonia fuel systems requiring reliable hydrogen generation for fuel cell propulsion and auxiliary power applications. Technology development initiatives create opportunities for advanced technology deployment and market expansion across North American markets.
United Kingdom develops comprehensive maritime applications through shipping companies implementing ammonia fuel systems and industrial facilities adopting hydrogen supply diversification strategies across European shipping routes. London, Liverpool, and Aberdeen serve as development centers where membrane crackers support fuel cell vessel operations and industrial hydrogen requirements for manufacturing and power generation. Revenue expansion reflects maritime industry leadership and government support for clean energy technology deployment across shipping and industrial sectors. The country's established maritime research infrastructure facilitates technology development and commercial deployment through comprehensive testing and validation programs. Industry collaboration initiatives create sustained demand for advanced ammonia conversion technologies that enable efficient hydrogen production and fuel system integration. Growth reaches 17.7% CAGR through 2035.
Japan focuses on high-precision membrane manufacturing and system integration for demanding maritime and industrial applications requiring superior reliability and performance characteristics across diverse operational environments. Tokyo, Yokohama, and Osaka serve as development centers where manufacturers implement advanced quality control systems and precision engineering capabilities for specialized applications. Japanese companies develop sophisticated membrane materials and system designs that demonstrate superior performance in challenging operational environments including high-temperature and corrosive conditions. The country's extensive research capabilities and manufacturing excellence support technology leadership in specialized applications requiring precise hydrogen production and system reliability. Quality management systems and continuous improvement principles drive adoption of advanced cracking technologies that enhance operational excellence and environmental performance across diverse maritime and industrial applications. Revenue growth maintains steady advancement at 15.6% CAGR through 2035.
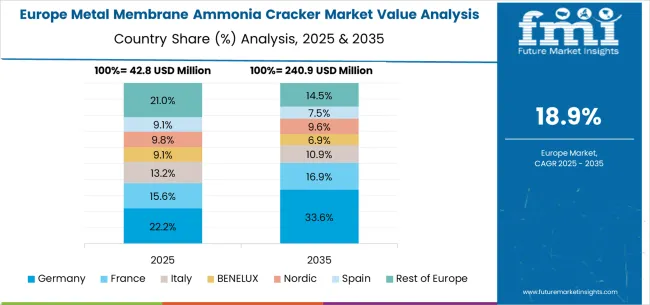
The European metal membrane ammonia cracker market reflects a coordinated approach to maritime decarbonization and industrial hydrogen development across member states pursuing common environmental targets and technology standardization. Germany establishes technological leadership through comprehensive research programs and manufacturing capabilities while maintaining focus on precision engineering and quality standards. United Kingdom focuses on maritime applications and system integration expertise leveraging established shipping industry relationships. France develops industrial hydrogen infrastructure supporting chemical manufacturing and shipping operations through government-backed technology programs. Netherlands leverages port infrastructure advantages for ammonia fuel systems deployment across major European shipping routes. Eastern European countries demonstrate growing interest in hydrogen economy development, supported by EU funding programs and technology transfer initiatives that accelerate adoption. Nordic countries emphasize maritime applications aligned with shipping industry decarbonization commitments and environmental regulations. Southern European markets focus on industrial applications supporting manufacturing sector modernization and environmental compliance requirements.
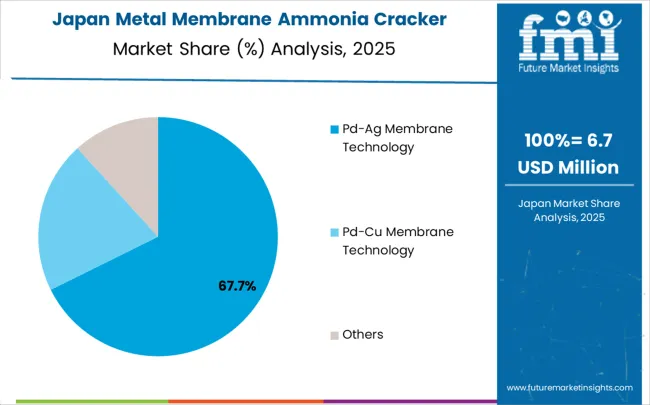
In Japan, the metal membrane ammonia cracker market is largely driven by the Pd-Ag membrane technology segment, which accounts for 82% of total market revenues in 2025. The superior hydrogen selectivity and proven reliability in high-temperature applications make these membranes essential for demanding maritime and industrial environments requiring consistent performance and operational safety. Ship applications follow with a 55% share, primarily in commercial vessels implementing fuel cell propulsion systems and auxiliary power generation for domestic and international shipping routes. Industrial facilities contribute 30% through hydrogen generation plants serving chemical manufacturing and steel production operations across major industrial regions. Automotive applications account for 15% as fuel cell vehicle infrastructure incorporates ammonia cracking technologies for distributed hydrogen supply systems supporting transportation sector decarbonization initiatives.
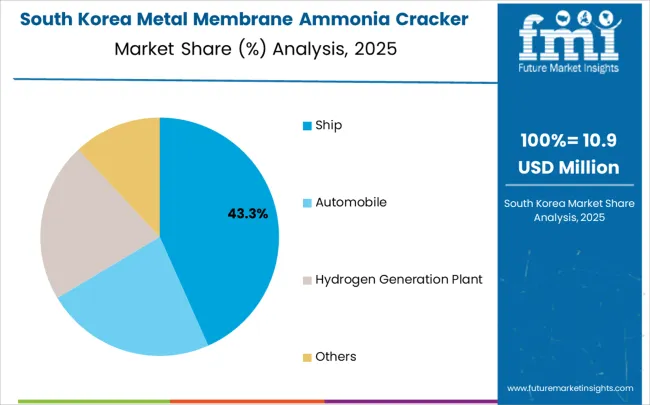
In South Korea, the market is expected to remain dominated by ship applications, which hold a 48% share in 2025. These vessels serve as the primary deployment platform for ammonia-to-hydrogen conversion systems where fuel cell propulsion requires reliable hydrogen generation capabilities for domestic and international shipping operations. Industrial facilities and hydrogen generation plants each hold 25% market share, with expanding adoption in petrochemical complexes and steel manufacturing operations across major industrial regions. Automotive applications account for the remaining 2%, but are gradually gaining traction in fuel cell vehicle infrastructure due to government support programs and manufacturer partnerships supporting transportation sector development. The market benefits from established shipbuilding capabilities and maritime technology expertise that facilitate system integration and deployment.
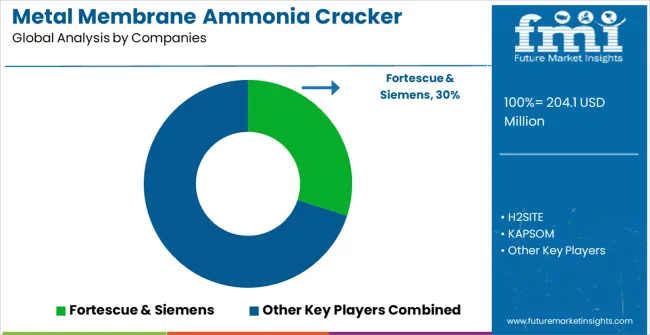
The metal membrane ammonia cracker market operates with moderate concentration among approximately 15-20 meaningful players, including specialized technology providers, membrane manufacturers, and system integrators. The top three companies control roughly 45% market share while the top five hold approximately 65%, indicating moderately fragmented competition. Market leaders leverage advanced membrane materials, proven system integration capabilities, and established customer relationships across maritime and industrial segments. Competition focuses on membrane performance optimization, system reliability improvement, and cost reduction through manufacturing scale and technology advancement rather than price competition alone.
Leaders including Fortescue & Siemens dominate through comprehensive project development capabilities spanning ammonia supply chains and integrated technology solutions for large-scale commercial applications. Their competitive moats include extensive project management experience, established shipbuilder relationships, and integrated technology platforms combining multiple hydrogen technologies. H2SITE provides innovative membrane reactor technologies with focus on compact designs and high efficiency performance, leveraging proprietary membrane materials and system optimization capabilities. KAPSOM specializes in maritime applications with proven system integration expertise and comprehensive technical support capabilities developed through years of marine industry experience.
Challengers including Topsoe leverage catalyst technology expertise and process engineering capabilities to develop comprehensive ammonia conversion solutions for industrial applications. Advanced Membrane Technologies focuses on specialized membrane development and manufacturing capabilities targeting niche applications requiring superior performance characteristics. Johnson Matthey applies precious metals expertise and catalysis knowledge to advanced membrane systems, competing through materials science leadership and established industrial relationships. Specialist providers including Ammonia Crackers Ltd contribute specialized expertise in niche applications and emerging market segments, competing through technical differentiation and customer-specific solutions rather than scale advantages.
| Item | Value |
|---|---|
| Quantitative Units | USD 204.1 million |
| Membrane Type | Pd-Ag Membrane Technology, Pd-Cu Membrane Technology, Ceramic Membranes, Polymer Membranes |
| End-Use | Ship, Automobile, Hydrogen Generation Plant, Industrial Facilities |
| Regions Covered | North America, Latin America, Europe, East Asia, South Asia & Pacific, Middle East & Africa |
| Country Covered | United States, Canada, United Kingdom, Germany, France, China, Japan, South Korea, India, Brazil, Australia and 40+ countries |
| Key Companies Profiled | Fortescue & Siemens, H2SITE, KAPSOM, Topsoe, Advanced Membrane Technologies, Johnson Matthey, Ammonia Crackers Ltd |
| Additional Attributes | Dollar sales by membrane type and end-use segments, regional hydrogen demand trends across North America, Europe, and Asia-Pacific, competitive landscape with specialized technology providers and membrane manufacturers, adoption patterns across maritime and industrial applications, integration with ammonia supply chains and hydrogen infrastructure, innovations in membrane materials and system optimization technologies, and development of modular system architectures with enhanced durability capabilities. |
The global metal membrane ammonia cracker market is estimated to be valued at USD 204.1 million in 2025.
The market size for the metal membrane ammonia cracker market is projected to reach USD 1,350.9 million by 2035.
The metal membrane ammonia cracker market is expected to grow at a 20.8% CAGR between 2025 and 2035.
The key product types in metal membrane ammonia cracker market are pd-ag membrane technology, pd-cu membrane technology and others.
In terms of application, ship segment to command 45.2% share in the metal membrane ammonia cracker market in 2025.


Our Research Products

The "Full Research Suite" delivers actionable market intel, deep dives on markets or technologies, so clients act faster, cut risk, and unlock growth.

The Leaderboard benchmarks and ranks top vendors, classifying them as Established Leaders, Leading Challengers, or Disruptors & Challengers.

Locates where complements amplify value and substitutes erode it, forecasting net impact by horizon

We deliver granular, decision-grade intel: market sizing, 5-year forecasts, pricing, adoption, usage, revenue, and operational KPIs—plus competitor tracking, regulation, and value chains—across 60 countries broadly.

Spot the shifts before they hit your P&L. We track inflection points, adoption curves, pricing moves, and ecosystem plays to show where demand is heading, why it is changing, and what to do next across high-growth markets and disruptive tech

Real-time reads of user behavior. We track shifting priorities, perceptions of today’s and next-gen services, and provider experience, then pace how fast tech moves from trial to adoption, blending buyer, consumer, and channel inputs with social signals (#WhySwitch, #UX).

Partner with our analyst team to build a custom report designed around your business priorities. From analysing market trends to assessing competitors or crafting bespoke datasets, we tailor insights to your needs.
Supplier Intelligence
Discovery & Profiling
Capacity & Footprint
Performance & Risk
Compliance & Governance
Commercial Readiness
Who Supplies Whom
Scorecards & Shortlists
Playbooks & Docs
Category Intelligence
Definition & Scope
Demand & Use Cases
Cost Drivers
Market Structure
Supply Chain Map
Trade & Policy
Operating Norms
Deliverables
Buyer Intelligence
Account Basics
Spend & Scope
Procurement Model
Vendor Requirements
Terms & Policies
Entry Strategy
Pain Points & Triggers
Outputs
Pricing Analysis
Benchmarks
Trends
Should-Cost
Indexation
Landed Cost
Commercial Terms
Deliverables
Brand Analysis
Positioning & Value Prop
Share & Presence
Customer Evidence
Go-to-Market
Digital & Reputation
Compliance & Trust
KPIs & Gaps
Outputs
Full Research Suite comprises of:
Market outlook & trends analysis
Interviews & case studies
Strategic recommendations
Vendor profiles & capabilities analysis
5-year forecasts
8 regions and 60+ country-level data splits
Market segment data splits
12 months of continuous data updates
DELIVERED AS:
PDF EXCEL ONLINE
Metallurgical Lighting Market Size and Share Forecast Outlook 2025 to 2035
Metal Evaporation Boat Market Size and Share Forecast Outlook 2025 to 2035
Metal Miniature Bone Plates Market Size and Share Forecast Outlook 2025 to 2035
Metal Locking Plate and Screw System Market Size and Share Forecast Outlook 2025 to 2035
Metal Pallet Market Size and Share Forecast Outlook 2025 to 2035
Metal Oxide Varistor (MOV) Surge Arresters Market Size and Share Forecast Outlook 2025 to 2035
Metal Straw Market Size and Share Forecast Outlook 2025 to 2035
Metal Can Market Size and Share Forecast Outlook 2025 to 2035
Metal IBC Market Forecast and Outlook 2025 to 2035
Metalized Barrier Film Market Forecast and Outlook 2025 to 2035
Metal Packaging Market Size and Share Forecast Outlook 2025 to 2035
Metal Bellow Market Size and Share Forecast Outlook 2025 to 2035
Metal based Safety Gratings Market Size and Share Forecast Outlook 2025 to 2035
Metal Modifiers Market Size and Share Forecast Outlook 2025 to 2035
Metallic Stearate Market Size and Share Forecast Outlook 2025 to 2035
Metallic Labels Market Size and Share Forecast Outlook 2025 to 2035
Metal Recycling Market Size and Share Forecast Outlook 2025 to 2035
Metal Forming Fluids Market Size and Share Forecast Outlook 2025 to 2035
Metal Removal Fluids Market Size and Share Forecast Outlook 2025 to 2035
Metal Deactivators Market Size and Share Forecast Outlook 2025 to 2035

Thank you!
You will receive an email from our Business Development Manager. Please be sure to check your SPAM/JUNK folder too.
Chat With
MaRIA