The global straw market is valued at USD 4,827 million in 2025 and is set to reach USD 8,965 million by 2035, growing at a CAGR of 6.4%. The market stands at the forefront of a transformative decade that promises to redefine beverage consumption infrastructure and drinking accessory excellence across food service, retail, healthcare, and hospitality sectors. The market's journey from USD 4,827 million in 2025 to USD 8,965 million by 2035 represents substantial growth, demonstrating the accelerating adoption of eco-friendly drinking solutions and sophisticated disposable beverage systems across restaurants, cafes, retail establishments, and institutional feeding applications.
The first half of the decade (2025-2030) will witness the market climbing from USD 4,827 million to approximately USD 6,289 million, adding USD 1,462 million in value, which constitutes 35% of the total forecast growth period. This phase will be characterized by the rapid adoption of alternative straw materials, driven by increasing demand for biodegradable options and enhanced functional performance requirements worldwide. Superior durability characteristics and liquid compatibility will become standard expectations rather than premium options.
The latter half (2030-2035) will witness sustained growth from USD 6,289 million to USD 8,965 million, representing an addition of USD 2,676 million or 65% of the decade's expansion. This period will be defined by mass market penetration of specialized straw systems, integration with comprehensive beverage service platforms, and seamless compatibility with existing food service and packaging infrastructure. The market trajectory signals fundamental shifts in how food service operators and beverage brands approach drinking accessory solutions, with participants positioned to benefit from sustained demand across multiple application segments.
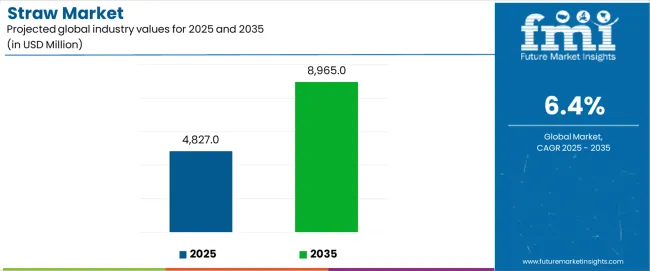
The straw market demonstrates distinct growth phases with varying market characteristics and competitive dynamics. Between 2025 and 2030, the market progresses through its alternative material adoption phase, expanding from USD 4,827 million to USD 6,289 million with steady annual increments averaging 5.4% growth. This period showcases the transition from traditional plastic straws to advanced biodegradable systems with enhanced liquid resistance and integrated functional performance becoming mainstream features.
The 2025-2030 phase adds USD 1,462 million to market value, representing 35% of total decade expansion. Market maturation factors include standardization of material specifications, declining costs for eco-friendly production, and increasing food service awareness of alternative straw benefits reaching 70-75% effectiveness in beverage applications. Competitive landscape evolution during this period features established manufacturers like Huhtamaki Group and Berry Global expanding their product portfolios while new entrants focus on specialized bamboo and wheat-based solutions with enhanced durability technology.
From 2030 to 2035, market dynamics shift toward advanced customization and multi-sector deployment, with growth accelerating from USD 6,289 million to USD 8,965 million, adding USD 2,676 million or 65% of total expansion. This phase transition logic centers on universal straw systems, integration with automated beverage dispensing equipment, and deployment across diverse application scenarios, becoming standard rather than specialized food service formats. The competitive environment matures with focus shifting from basic material composition to comprehensive functional performance and compatibility with high-volume beverage operations.
At-a-Glance Metrics
| Metric | Value |
|---|---|
| Market Value (2025) | USD 4,827 million |
| Market Forecast (2035) | USD 8,965 million |
| Growth Rate | 6.40% CAGR |
| Leading Material Type | Paper |
| Primary Application | Food Service Segment |
The market demonstrates strong fundamentals with paper straw systems capturing a dominant share through superior liquid resistance and biodegradable design capabilities. Food service applications drive primary demand, supported by increasing regulatory compliance requirements and premium beverage presentation solutions. Geographic expansion remains concentrated in developed markets with established food service infrastructure, while emerging economies show accelerating adoption rates driven by hospitality modernization projects and rising beverage consumption activity.
The straw market represents a compelling intersection of eco-friendly material innovation, beverage service enhancement, and regulatory compliance management. With robust growth projected from USD 4,827 million in 2025 to USD 8,965 million by 2035 at a 6.40% CAGR, this market is driven by increasing environmental regulation trends, food service modernization requirements, and commercial demand for high-performance drinking accessories.
The market's expansion reflects a fundamental shift in how food service operators and beverage brands approach drinking accessory infrastructure. Strong growth opportunities exist across diverse applications, from quick-service restaurants requiring durable straws to healthcare facilities demanding sterile solutions. Geographic expansion is particularly pronounced in Asia-Pacific markets, led by China (7.6% CAGR) and India (7.3% CAGR), while established markets in North America and Europe drive innovation and specialized segment development.
The dominance of paper systems and food service applications underscores the importance of proven biodegradable technology and functional reliability in driving adoption. Material durability and liquid compatibility remain key challenges, creating opportunities for companies that can deliver reliable performance while maintaining environmental compliance.
Market expansion rests on three fundamental shifts driving adoption across food service and beverage sectors. Environmental regulations create compelling advantages through alternative straw systems that provide comprehensive compliance with plastic reduction mandates, enabling food service operators to maintain beverage service while meeting regulatory requirements and justifying investment over traditional plastic options. Consumer awareness accelerates as beverage brands worldwide seek eco-friendly accessory systems that deliver environmental responsibility directly to point-of-consumption, enabling brand differentiation that aligns with consumer expectations and maximizes environmental impact messaging. Functional performance drives adoption from beverage operators requiring reliable drinking solutions that maintain liquid compatibility while providing durability during extended beverage consumption and service operations.
The growth faces headwinds from material cost variations that differ across production facilities regarding raw material sourcing and processing complexity, potentially limiting performance reliability in high-volume food service categories. Durability concerns also persist regarding liquid resistance and structural integrity that may increase replacement frequency in markets with demanding beverage service standards.
Primary Classification: The market segments by material type into paper, bamboo, wheat-based, PLA (polylactic acid), and metal categories, representing the evolution from traditional plastic straws to eco-friendly drinking solutions for comprehensive beverage service operations.
Secondary Breakdown: Application segmentation divides the market into food service, retail, healthcare, hospitality, and others sectors, reflecting distinct requirements for durability, hygiene standards, and functional performance.
Regional Classification: Geographic distribution covers North America, Europe, Asia Pacific, Latin America, and the Middle East & Africa, with developed markets leading regulatory compliance while emerging economies show accelerating growth patterns driven by food service modernization programs.
The segmentation structure reveals technology progression from standard paper straws toward integrated multi-material platforms with enhanced liquid resistance and functional capabilities, while application diversity spans from quick-service restaurants to healthcare facilities requiring comprehensive beverage service and regulatory compliance solutions.
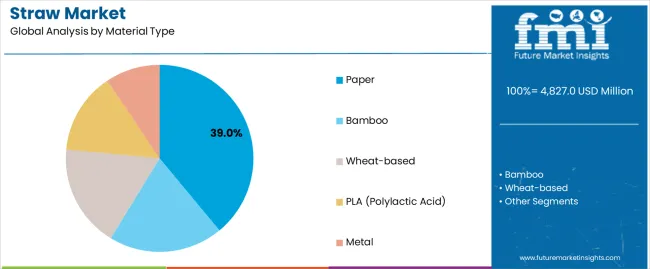
Paper segment is estimated to account for 39% of the straw market share in 2025. The segment's leading position stems from its fundamental role as a critical component in biodegradable drinking applications and its extensive use across multiple food service and retail sectors. Paper's dominance is attributed to its superior liquid resistance properties, including moisture barrier capabilities, excellent structural integrity, and proven biodegradable characteristics that make it indispensable for eco-friendly beverage service operations.
Market Position: Paper straw systems command the leading position in the straw market through advanced coating technologies, including comprehensive moisture protection, uniform wall thickness, and reliable functional performance that enable manufacturers to deploy drinking solutions across diverse beverage environments.
Value Drivers: The segment benefits from food service preference for proven biodegradable materials that provide exceptional liquid compatibility without requiring specialized dispensing equipment. Efficient material sourcing enables deployment in restaurant applications, retail beverage service, and institutional feeding where environmental compliance and functional reliability represent critical selection requirements.
Competitive Advantages: Paper straw systems differentiate through excellent liquid resistance, proven biodegradable performance, and compatibility with standard beverage dispensing equipment that enhance drinking capabilities while maintaining economical material profiles suitable for diverse food service applications.
Key market characteristics:
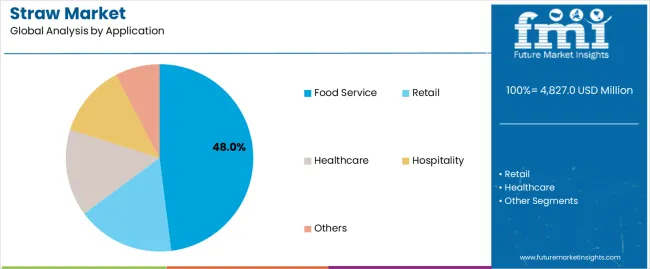
Food service segment is projected to hold 48% of the straw market share in 2025. The segment's market leadership is driven by the extensive use of straws in restaurants, cafes, quick-service establishments, and institutional feeding operations, where drinking accessories serve as both functional components and brand presentation elements. The food service industry's consistent investment in eco-friendly materials supports the segment's dominant position.
Market Context: Food service applications dominate the market due to widespread adoption of biodegradable materials and increasing focus on regulatory compliance, beverage presentation, and customer satisfaction that enhance brand value while maintaining functional performance.
Appeal Factors: Food service operators prioritize liquid resistance, durability, and integration with beverage dispensing systems that enable coordinated deployment across multiple service points. The segment benefits from substantial regulatory compliance requirements and consumer preference standards that emphasize eco-friendly accessories for beverage consumption applications.
Growth Drivers: Restaurant modernization programs incorporate straws as standard accessories for beverage service. At the same time, chain operator initiatives are increasing demand for standardized drinking solutions that comply with environmental regulations and enhance consumer dining experiences.
Market Challenges: Material cost variations and durability limitations may limit deployment flexibility in ultra-high-volume operations or extreme cost-sensitive scenarios.
Application dynamics include:
Growth Accelerators: Environmental regulation drives primary adoption as alternative straw systems provide exceptional compliance capabilities that enable regulatory adherence without compromising beverage service functionality, supporting cost reduction and brand enhancement that require eco-friendly drinking formats. Consumer awareness accelerates market growth as beverage brands seek environmentally responsible accessory solutions that maintain drinking performance while enhancing environmental perception through refined material selection. Food service modernization increases worldwide, creating demand for high-performance drinking systems that complement beverage positioning and provide competitive advantages in environmental responsibility.
Growth Inhibitors: Material cost premium challenges differ across production facilities regarding raw material sourcing and processing efficiency, which may limit market penetration and profitability in high-volume categories with demanding cost requirements. Durability limitations persist regarding liquid resistance and structural integrity that may increase replacement frequency in demanding beverage service applications with extended usage specifications. Market fragmentation across multiple material types and functional specifications creates compatibility concerns between different dispensing equipment and existing food service infrastructure.
Market Evolution Patterns: Adoption accelerates in food service and retail sectors where environmental compliance justifies material investments, with geographic concentration in developed markets transitioning toward mainstream adoption in emerging economies driven by hospitality modernization and beverage consumption expansion. Technology development focuses on enhanced liquid resistance, improved structural durability, and integration with automated dispensing systems that optimize beverage service and operational efficiency. The market could face disruption if alternative drinking solutions or technology innovations significantly challenge straw advantages in beverage consumption applications.
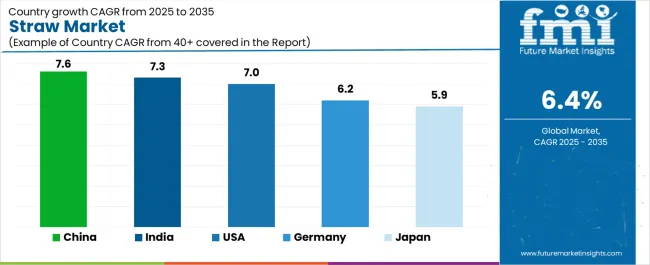
The straw market demonstrates varied regional dynamics with Growth Leaders including China (7.6% CAGR) and India (7.3% CAGR) driving expansion through food service growth and environmental awareness campaigns. Steady Performers encompass the U.S. (7.0% CAGR), Germany (6.2% CAGR), and Japan (5.9% CAGR), benefiting from established food service sectors and regulatory compliance adoption.
| Country | CAGR (2025-2035) |
|---|---|
| China | 7.6% |
| India | 7.3% |
| USA | 7.0% |
| Germany | 6.2% |
| Japan | 5.9% |
Regional synthesis reveals Asia-Pacific markets leading growth through food service expansion and beverage consumption development, while European countries maintain steady expansion supported by environmental regulations and eco-friendly product requirements. North American markets show strong growth driven by regulatory compliance and food service modernization applications.
China establishes regional leadership through explosive restaurant sector expansion and comprehensive beverage consumption modernization, integrating advanced straw systems as standard components in food service operations and premium beverage applications. The country's 7.6% CAGR through 2035 reflects consumer spending growth promoting dining experiences and domestic food service activity that mandate the use of eco-friendly drinking accessories in hospitality operations. Growth concentrates in major metropolitan areas, including Beijing, Shanghai, and Guangzhou, where food service networks showcase integrated straw systems that appeal to domestic brands seeking enhanced environmental responsibility and international compliance standards.
Chinese manufacturers are developing innovative straw solutions that combine local production advantages with international environmental specifications, including biodegradable materials and advanced liquid-resistant capabilities.
Strategic Market Indicators:
The Indian market emphasizes food service applications, including rapid restaurant development and comprehensive beverage service expansion that increasingly incorporates straws for drinking enhancement and service standardization applications. The country is projected to show a 7.3% CAGR through 2035, driven by massive food service activity under hospitality modernization initiatives and commercial demand for affordable, high-performance drinking systems. Indian food service operators prioritize cost-effectiveness with straws delivering functional reliability through economical material usage and efficient dispensing capabilities.
Technology deployment channels include major restaurant chains, beverage service providers, and hospitality operators that support high-volume usage for domestic and tourist applications.
Performance Metrics:
The U.S. market emphasizes advanced straw features, including innovative biodegradable technologies and integration with comprehensive food service platforms that manage beverage service, environmental compliance, and customer satisfaction applications through unified drinking systems. The country is projected to show a 7.0% CAGR through 2035, driven by restaurant sector expansion under consumer dining trends and commercial demand for premium, eco-friendly drinking accessories. American food service operators prioritize customer experience with straws delivering comprehensive functionality through refined materials and operational innovation.
Technology deployment channels include major restaurant chains, coffee shop networks, and specialty beverage providers that support custom development for premium operations.
Performance Metrics:
In Berlin, Munich, and Hamburg, German food service operators and beverage companies are implementing advanced straw systems to enhance environmental compliance and support brand differentiation that aligns with regulatory protocols and consumer standards. The German market demonstrates sustained growth with a 6.2% CAGR through 2035, driven by environmental regulation programs and consumer brand investments that emphasize eco-friendly drinking accessories for food service and retail applications. German food service facilities are prioritizing straw systems that provide exceptional biodegradable performance while maintaining compliance with environmental standards and minimizing material waste, particularly important in restaurant operations and specialty beverage service.
Market expansion benefits from regulatory compliance programs that mandate eco-friendly materials in food service specifications, creating sustained demand across Germany's hospitality and beverage sectors, where environmental responsibility and functional reliability represent critical requirements.
Strategic Market Indicators:
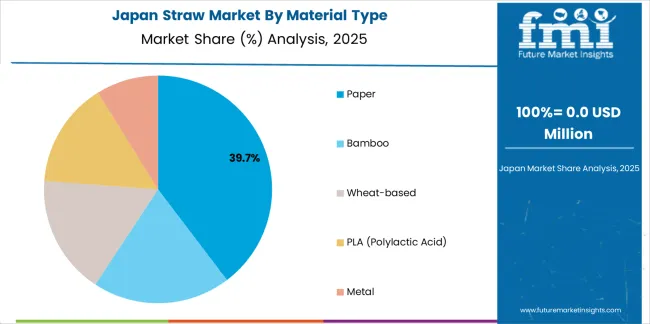
Japan's sophisticated food service market demonstrates meticulous straw deployment, growing at 5.9% CAGR, with documented operational excellence in beverage service and customer satisfaction applications through integration with existing dispensing systems and quality assurance infrastructure. The country leverages engineering expertise in material processing and functional precision to maintain market leadership. Food service centers, including Tokyo, Osaka, and Kyoto, showcase advanced installations where straw systems integrate with comprehensive beverage platforms and service standardization systems to optimize customer experience and operational efficiency.
Japanese food service operators prioritize functional precision and material consistency in accessory development, creating demand for premium straw systems with advanced features, including ultra-smooth surfaces and integration with automated dispensing protocols. The market benefits from established food service infrastructure and willingness to invest in specialized material technologies that provide superior performance and regulatory compliance.
Market Intelligence Brief:
The straw market in Europe is projected to grow from USD 1,274 million in 2025 to USD 2,087 million by 2035, registering a CAGR of 5.1% over the forecast period. Germany is expected to maintain its leadership position with a 36.4% market share in 2025, declining slightly to 36.0% by 2035, supported by its environmental regulation excellence and major food service centers, including Bavaria and North Rhine-Westphalia.
France follows with a 24.1% share in 2025, projected to reach 24.6% by 2035, driven by comprehensive hospitality sector modernization and restaurant chain initiatives. The United Kingdom holds a 18.7% share in 2025, expected to maintain 19.1% by 2035 through established food service sectors and beverage service adoption. Italy commands a 12.3% share, while Spain accounts for 7.2% in 2025. The Rest of Europe region is anticipated to gain momentum, expanding its collective share from 1.3% to 1.7% by 2035, attributed to increasing food service development in Eastern European countries and emerging hospitality brands implementing eco-friendly drinking programs.
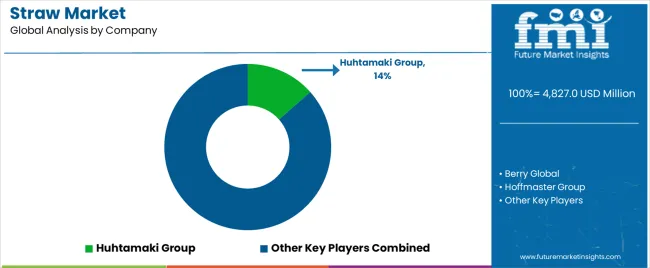
The straw market operates with moderate concentration, featuring approximately 25-35 participants, where leading companies control roughly 42-50% of the global market share through established distribution networks and comprehensive material technology capabilities. Competition emphasizes environmental compliance, functional performance, and cost efficiency rather than price-based rivalry.
Market leaders encompass Huhtamaki Group, Berry Global, and Hoffmaster Group, which maintain competitive advantages through extensive material processing expertise, global manufacturing networks, and comprehensive technical support capabilities that create distributor loyalty and support application requirements. These companies leverage decades of packaging experience and ongoing material technology investments to develop advanced straw systems with exceptional liquid resistance and biodegradable features. Huhtamaki Group leads with 14% share.
Specialty challengers include Aardvark Straws, Eco-Products, and StrawDot, which compete through specialized eco-friendly innovation focus and efficient manufacturing solutions that appeal to food service operators seeking premium environmental compliance and custom functional flexibility. These companies differentiate through material engineering emphasis and specialized application focus.
Market dynamics favor participants that combine reliable functional performance with advanced environmental compliance, including biodegradable certification and liquid resistance capabilities. Competitive pressure intensifies as traditional packaging manufacturers expand into straw systems. At the same time, specialized eco-friendly converters challenge established players through innovative material treatments and cost-effective production targeting emerging food service segments.
| Item | Value |
|---|---|
| Quantitative Units | USD 4,827 million |
| Material Type | Paper, Bamboo, Wheat-based, PLA, Metal |
| Application | Food Service, Retail, Healthcare, Hospitality, Others |
| Regions Covered | North America, Europe, Asia Pacific, Latin America, Middle East & Africa |
| Countries Covered | U.S., Germany, Japan, China, India, and 25+ additional countries |
| Key Companies Profiled | Huhtamaki Group, Berry Global, Hoffmaster Group, Aardvark Straws, Eco-Products, StrawDot |
| Additional Attributes | Dollar sales by material type and application categories, regional adoption trends across North America, Europe, and Asia-Pacific, competitive landscape with material manufacturers and food service distributors, brand owner preferences for environmental compliance and functional reliability, integration with beverage dispensing equipment and service systems, innovations in biodegradable technology and liquid resistance treatments, and development of specialized eco-friendly solutions with enhanced durability capabilities and cost-effective features |
The global straw market is estimated to be valued at USD 4,827.0 million in 2025.
The market size for the straw market is projected to reach USD 8,965.0 million by 2035.
The straw market is expected to grow at a 6.4% CAGR between 2025 and 2035.
The key product types in straw market are paper , bamboo, wheat-based, pla (polylactic acid) and metal.
In terms of application, food service segment to command 48.0% share in the straw market in 2025.


Full Research Suite comprises of:
Market outlook & trends analysis
Interviews & case studies
Strategic recommendations
Vendor profiles & capabilities analysis
5-year forecasts
8 regions and 60+ country-level data splits
Market segment data splits
12 months of continuous data updates
DELIVERED AS:
PDF EXCEL ONLINE
Strawberry Seed Oil Market Analysis by Application, End-use, Distribution channel and Region Through 2035
Leading Providers & Market Share in the Straw Industry
Straw Paper Market Trends - Growth & Sustainability 2025 to 2035
Strawless Lids Market
Metal Straw Market Size and Share Forecast Outlook 2025 to 2035
Bamboo Straw Market Size and Share Forecast Outlook 2025 to 2035
Canada Straws Market Size and Share Forecast Outlook 2025 to 2035
Market Share Insights for Bamboo Straw Providers
Reusable Straws Market Analysis - Trends, Growth & Forecast 2025 to 2035
Compostable Straws Market Growth - Demand & Forecast 2025 to 2035
Eco-Friendly Straws Market Growth - Demand & Forecast 2025 to 2035

Thank you!
You will receive an email from our Business Development Manager. Please be sure to check your SPAM/JUNK folder too.
Chat With
MaRIA