Reports

- Global Locations -

Headquarters

Future Market Insights, Inc.

Christiana Corporate, 200
Continental Drive, Suite 401,
Newark, Delaware - 19713,
United States

T: +1-845-579-5705

Americas

Future Market Insights, Inc.

616 Corporate Way, Suite 2-9018,
Valley Cottage, NY 10989, United States

T: +1-347-918-3531

MEA

Future Market Insights

1602-6 Jumeirah Bay X2 Tower, Plot No: JLT-PH2-X2A,
Jumeirah Lakes Towers, Dubai,
United Arab Emirates

Europe

Future Market Insights

3rd Floor, 207 Regent Street,
W1B 3HH London
United Kingdom

T: + 44 (0) 20 8123 9659
D: +44 (0) 20 3287 4268

Asia Pacific

Future Market Insights

IndiaLand Global Tech Park, Unit UG-1, Behind Grand HighStreet, Phase 1, Hinjawadi, MH, Pune – 411057, India

Non-opioid Pain Patches Market Outlook – 2022-2029

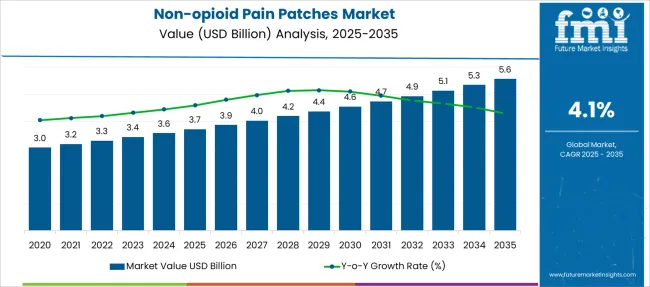
[195 Pages Report] Sales in the global Non-Opioid Pain Patches Market are slated to top US$ 3.3 Bn in 2022. Expanding at a healthy 4.1% CAGR, the market size is projected to total US$ 4.4 Bn by 2029.

Attribute Details
Non-opioid Pain Patches Market Estimated Size 2022 US$ 3.3 Billion
Non-opioid Pain Patches Market Value-based CAGR (2022-2029) ~ 4.1%
Non-opioid Pain Patches Market Size in Projected 2029 US$ 4.4 Billion

The deeper impact of pain on the socio-economic system than the combination of diabetes, cancer, and cardiovascular diseases together is likely to drive the sales in this market. The rising cases of chronic pain stoked by back strain due to heavy lifting, accident, or underlying diseases, such as arthritis, spine disease, and pancreatitis are projected to propel the demand for non-narcotic pain patches.

The increasing preference for non-opioid pain relief patches owing to their ability to prevent the risk of addiction, as compared to fentanyl patches when released over a long period of time, is another vital factor that is anticipated to drive the market. The surging demand for minimally invasive treatments is expected to affect the growth positively in the near future.

Don't pay for what you don't need

Customize your report by selecting specific countries or regions and save 30%!

How The Market Progressed Till June 2022?

Particulars Details
H1, 2021 3.64%
H1, 2022 Projected 4.09%
H1, 2022 Outlook 3.29%
BPS Change - H1, 2022 (O) - H1, 2022 (P) (-) 20 ↓
BPS Change - H1, 2022 (O) - H1, 2021 (+) 25 ↑

The variation between the BPS values observed within this market in H1, 2022 - outlook over H1, 2022 projected reflects a decline of 20 BPS units. However, a positive BPS growth in H1-2022 over H1-2021 by 25 Basis Point Share (BPS) is demonstrated by the market. The on-opioid pain patches market is highly subject to regulatory considerations, licensing of products, and patented approvals of non-opioid pain therapies.

The use of opioids for non-malignant chronic pain in limited situations due to the opioid epidemic that is presently raging in the United States, according to the most recent Centers for Disease Control (CDC) guidelines, is a prime factor resulting in a major decline in the BPS values.

Conversely, the presence of pain relieving products such as prescription and over-the-counter aspirin, ibuprofen, and acetaminophen, and nondrug remedies, have contributed to the positive BPS outlook. The key developments in the market include the development of bio-compatible surgical patches which release the non-opioid painkillers directly to the site of the wound.

2014-2021 Non-opioid Pain Patches Market Outlook in Comparison to 2022-2029 Growth Forecast

The non-opioid pain patches market is expected to register 4.1% CAGR between 2022 and 2029, up from 2.6% CAGR recorded during 2014-2021, predicts Future Market Insights.

The ability of non-opioid heat therapy patches to release Active Pharmaceutical Ingredients (APIs) for delivering therapeutic effects by blocking the body’s sensation of pain signals through receptors is set to accelerate the market in the evaluation period. The urgent need to ease muscle spasms and reduce discomfort in patients suffering from muscular or joint disorders is likely to spur the market.

Non-opioid Pain Patches Market

The emergence of capsaicin heat therapy patches to temporarily relieve joint or muscle pain caused by minor injuries, such as sprains and strains, is another crucial factor that is estimated to positively affect the growth. Capsaicin is an active ingredient that is commonly found in chili peppers and it is highly effective for the treatment of pain occurring because of osteoarthritis, diabetic neuropathy, and post-operative shingles.

Is the Rising Prevalence of Osteoarthritis Driving the Non-opioid Pain Patches Market?

The increasing prevalence of osteoarthritis across the globe backed by the rising geriatric population, prevalence of joint injuries, obesity, repeated stress on the joint, genetics, metabolic diseases, and bone deformities is set to drive the demand for non-opioid pain relief patches. It is considered to be the most common form of arthritis and occurs very frequently in the knees, hips, and hands.

According to the Osteoarthritis Action Alliance (OAAA), about 54.4 million adults have some form of arthritis in the U.S. and by 2040, this figure is expected to reach 78 million. Amongst these, approximately 32.5 million adults are affected by osteoarthritis. This trend is likely to continue throughout the forthcoming years in various parts of the world, thereby propelling the market.

How are the Increasing Cases of Cancer Propelling the Non-opioid Pain Patches Market?

The growing cases of various types of cancer such as breast, bowel, colorectal, and lungs are expected to drive the market in the upcoming years. The rising awareness by governments of various countries to educate the masses regarding the availability of innovative non-opioid heat patches for the treatment of pain associated with cancer is projected to aid the market.

As per the World Health Organization (WHO), cancer accounted for about 10 million deaths globally in 2020. The same year, there were nearly 6, 85, 000 deaths associated with breast cancer, 8, 30, 000 deaths because of liver cancer, and 1.80 million deaths due to lung cancer. This showcases that the prevalence of cancer is set to surge at a fast pace in the near future, which would drive the market.
Sabyasachi Ghosh
Sabyasachi Ghosh

Principal Consultant

Talk to Analyst

Find your sweet spots for generating winning opportunities in this market.

Country-wise Insights

What is the U.S. Non-opioid Pain Patches Market Outlook?

“Increasing Geriatric Population to Propel Usage of Non-opioid Heat Patches”

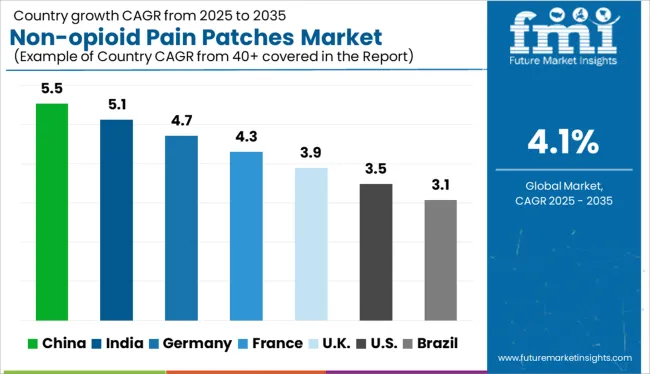
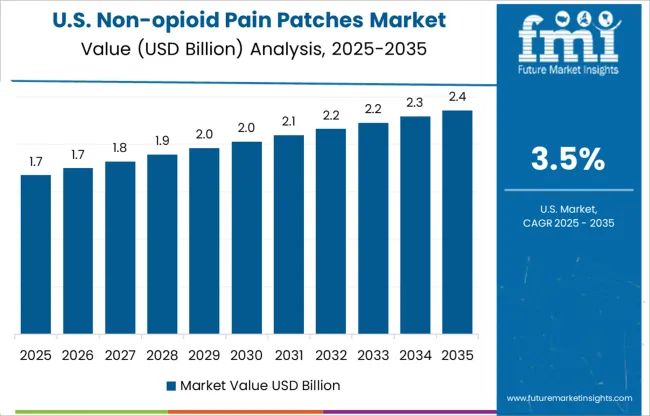
The growing geriatric population in the U.S. is anticipated to boost the non-opioid pain patches market in North America in the assessment period. The geriatric population is prone to chronic and acute pain owing to the higher prevalence of arthritis, musculoskeletal disorders, and cancer among them.

As per U.S. Census Bureau, there were 40.3 million residents belonging to the age group of 65 years and above in 2010 and the number surged by 54.1 million in 2019 in the U.S. The ever-increasing aging population in the country is set to augment the demand for non-opioid heat patches.

How is the U.K. Non-opioid Pain Patches Market Faring?

“Non-opioid Heat Therapy Patches are Being Used by Migraine Patients”

The rising cases of persistent migraines or fibromyalgia in the U.K. is one of the primary factors accelerating the non-opioid pain patches market growth in Europe. Hormonal changes in women, high stress levels, intense physical exertion, changes in sleeping patterns, and increasing consumption of alcohol are some of the leading factors that can often cause migraine.

According to the National Institute for Health and Clinical Excellence, about 190,000 migraine attacks are experienced by people in England every day and approximately 6 million people suffer from this condition in the U.K. The prevalence of migraine has been reported to be 2-10% in men and 5-25% in women. This proves that the cases of migraine are set to surge at a rapid pace in the forthcoming years, which would help in driving the sales of non-opioid heat therapy patches.

Will the India Non-opioid Pain Patches Market Grow at a Steady Pace?

“High Cases of Chronic Pain-related Conditions to Bolster the Sales of Non-opioid Heat Patches”

The increasing cases of chronic pain among people in India is set to propel the South Asia non-opioid pain patches market. The rising investments by the government in the development of a well-established healthcare infrastructure to treat pain-related conditions is also projected to aid the market.

In December 2018, for instance, scientists at the All India Institute of Medical Sciences and Homi Bhabha National Institute conducted a study to understand the impact and magnitude of chronic pain in Southeast Asia. Around 4326 Indian patients were screened and out of these, 836 patients completed a pain questionnaire. The prevalence was higher in females (25.2%) and it increased steeply among people belonging to the age group of 65 years and above. The numbers are estimated to grow in the near future, thereby augmenting the demand for non-opioid heat patches in India. 

Category-wise Insights

Which is the Leading Product Type in the Non-opioid Pain Patches Market?

“Acute and Chronic Pain Patients are Adopting Lidocaine Pain Relief Patches”

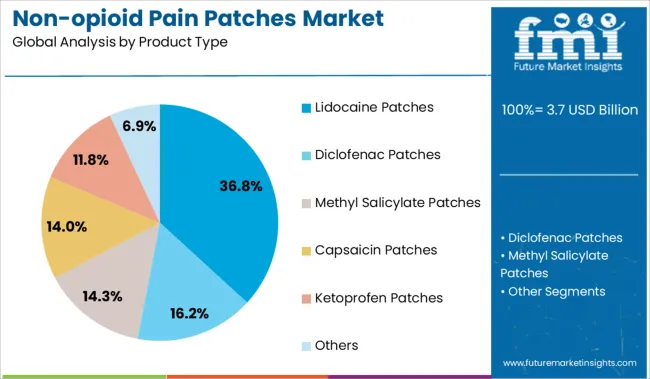
Based on product type, the lidocaine patches segment is likely to account for around 68.7% in terms of the global non-opioid pain patches market share in 2022, estimates FMI. These are considered to be the most easily available patches for the treatment of acute and chronic pain.

As per the Centers for Disease Control and Prevention (CDC), nearly 20.4% of adults were suffering from chronic pain in 2019 and the percentage of adults with this type of pain increased as their place of residence became more rural. Thus, the rising cases of chronic pain and the easy availability of lidocaine pain relief patches are anticipated to drive the segment.  

Which is the Preferred Distribution Channel in the Non-opioid Pain Patches Market?

“Senior Citizens are Preferring Online Pharmacies to Order Non-narcotic Pain Patches”

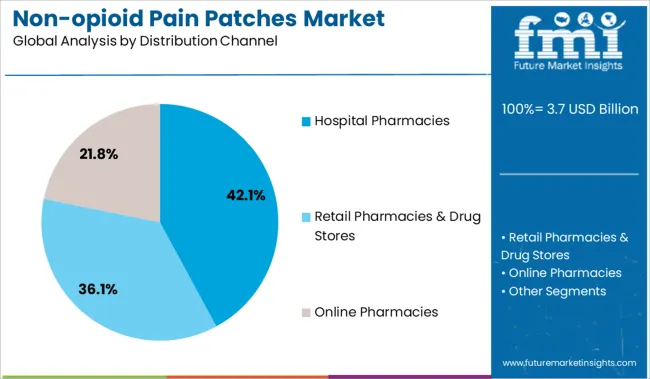
By distribution channel, the online pharmacies segment is set to remain at the forefront in the global non-opioid pain patches market. The emergence of a large number of online pharmacies providing non-narcotic pain patches for treating conditions, such as severe, moderate, and mild chronic and acute pain is a major factor that is projected to bolster the segment.

These pharmacies are also suitable for senior citizens who cannot always get out of their homes to buy medicines. The doorstep delivery facility of these pharmacies would therefore help them to order the required medications from the comfort of their homes.
Get the data you need at a Fraction of the cost

Personalize your report by choosing insights you need
and save 40%!

Competition Landscape

Majority of the key players operating in the global non-opioid pain patches market are focusing on the development of non-addictive topical pain patches for chronic and acute pain. They are also striving to enhance skin adhesion and increase the duration of analgesic action by developing innovative alternative therapeutics. Meanwhile, a few other players are engaging in extensive research and development activities by collaborating with educational institutions to introduce new non-narcotic pain patches.

For instance,

  • In January 2021, a Duke-led team of scientists discovered a novel bio-compatible surgical patch that releases non-opioid painkillers for days to the site of a wound and then dissolves away. The new polymer patch delivers a controlled release of a drug that is capable of blocking the enzyme COX-2 (cyclooxygenase-2,) that propels inflammation and pain.
  • In July 2020, the U.S. Food and Drug Administration (FDA) approved an 8% capsaicin patch for the treatment of neuropathic pain related to diabetic peripheral neuropathy of the feet in adults. The patch is a non-opioid, non-systemic, and topical pain treatment and is considered to be the only treatment available to provide prescription strength capsaicin directly into the patient’s skin.

Scope of Report

Attribute Details
Forecast Period 2014 to 2021
Historical Data Available for 2022 to 2029
Market Analysis Units for Volume and US$ Billion for Value
Key Regions Covered North America, Latin America, Europe, East Asia, South Asia, Oceania, and the Middle East & Africa.
Key Countries Covered United States, Canada, Brazil, Mexico, Germany, UK, France, Italy, Spain, Nordic, Russia, Poland, China, India, Thailand, Indonesia, Australia and New Zealand, Japan, GCC countries, North Africa, South Africa, others.
Key Market Segments Covered Product Type, Distribution Channel, and Region
Key Companies Profiled
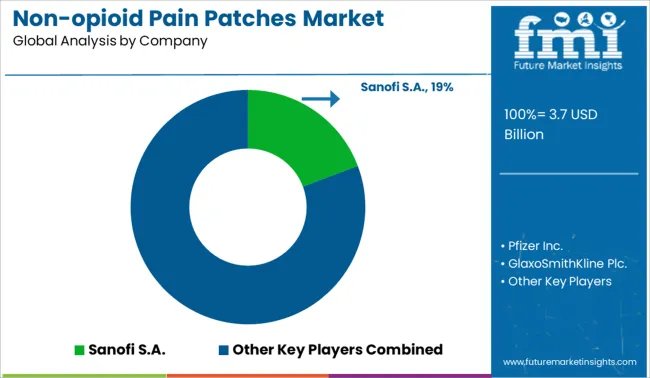
  • Sanofi S.A.
  • Pfizer Inc.
  • GlaxoSmithKline Plc.
  • Hisamitsu Pharmaceutical Co., Inc.
  • Clarion Brands
  • Endo Pharmaceuticals
  • TEH SENG Pharmaceutical
  • Veridian Healthcare
  • Sorrento Therapeutics (SCILEX Pharmaceuticals Inc.
  • Teva Pharmaceutical Industries Ltd.
  • Teikoku Seiyaku Co. Ltd.
Pricing Available upon Request

Non-opioid Pain Patches Market by Category

Product Type:

  • Lidocaine Patches
  • Diclofenac Patches
  • Methyl Salicylate Patches
  • Capsaicin Patches
  • Ketoprofen Patches
  • Others

Distribution Channel:

  • Hospital Pharmacies
  • Retail Pharmacies & Drug Stores
  • Online Pharmacies

Region:

  • North America
  • Latin America
  • Europe
  • East Asia
  • South Asia
  • Oceania
  • Middle East & Africa (MEA)

Frequently Asked Questions

What is the global non-opioid pain patches market size?

The global non-opioid pain patches market is expected to reach a valuation of US$ 3.3 Bn in 2022.

At what rate did the global non-opioid pain patches market grow between 2014 and 2021?

The global non-opioid pain patches market grew at a healthy 2.6% CAGR between 2014 and 2021.

What are the key trends boosting sales of non-opioid pain patches?

The increasing prevalence of cancer and the rising number of online pharmacies are the key trends boosting the sales of non-opioid pain patches.

Who are the leading non-opioid pain patches market players?

Sanofi S.A., Pfizer Inc., GlaxoSmithKline Plc., Hisamitsu Pharmaceutical Co., Inc., Clarion Brands, and Endo Pharmaceuticals are some of the leading players present in the global non-opioid pain patches market.

What is the share of the lidocaine patches segment in the non-opioid pain patches market?

The lidocaine patches segment is anticipated to account for 68.7% of the share in the non-opioid pain patches market in 2022.

What is the share of the diclofenac patches segment in the non-opioid pain patches market?

The diclofenac patches segment is projected to account for 22.6% of the share in the non-opioid pain patches market in the forecast period.

Table of Content

1. Executive Summary

    1.1. Global Market Outlook

    1.2. Demand Side Trends

    1.3. Supply Side Trends

    1.4. Technology Roadmap

    1.5. Analysis and Recommendations

2. Market Overview

    2.1. Market Coverage / Taxonomy

    2.2. Market Definition / Scope / Limitations

    2.3. Inclusions and Exclusions

3. Key Market Trends

    3.1. Key Trends Impacting the Market

    3.2. Product Innovation / Development Trends

4. Market Background

    4.1. Macro-Economic Factors

        4.1.1. Global GDP Growth Outlook

        4.1.2. Global Healthcare Outlook

    4.2. Forecast Factors - Relevance & Impact

        4.2.1. Research and Developmental Activities

        4.2.2. Technological Advancement

        4.2.3. Adoption of Non-opioid Pain Patches

        4.2.4. Cost of Non-opioid Pain Patches

        4.2.5. Increasing Pain Epidemic  

    4.3. Market Dynamics

        4.3.1. Drivers

        4.3.2. Restraints

        4.3.3. Opportunities 

5. Market Context

    5.1. Product USPs/ Features

    5.2. Product  Adoption / Usage Analysis

    5.3. Regulatory Scenario

    5.4. Pain Epidemiology 

    5.5. Key Promotional Strategies

6. Global Market Value (US$ Mn) Analysis 2014-2021 and Forecast, 2022-2029

    6.1. Historical Market Value (US$ Mn) Analysis, 2014-2021

    6.2. Current and Future Market Value (US$ Mn) Projections, 2022-2029

        6.2.1. Y-o-Y Growth Trend Analysis

        6.2.2. Opportunity Analysis, 2022-2029

7. Global Market - Pricing Analysis

    7.1. Regional Pricing Analysis By Product Type

    7.2. Pricing Break-up

        7.2.1. Manufacturer Level Pricing

        7.2.2. Distributor Level Pricing

    7.3. Global Average Pricing Analysis Benchmark

8. Global Market Analysis 2014-2021 and Forecast 2022-2029, By Product Type

    8.1. Introduction / Key Findings

    8.2. Historical Market Size (US$ Mn) Analysis By Product Type, 2014–2021

    8.3. Current and Future Market Size (US$ Mn) Analysis and Forecast By Product Type, 2022-2029

        8.3.1. Lidocaine Patches

        8.3.2. Diclofenac Patches

        8.3.3. Methyl Salicylate Patches

        8.3.4. Capsaicin Patches

        8.3.5. Ketoprofen Patches

        8.3.6. Others 

    8.4. Market Attractiveness Analysis By Product Type

9. Global Market Analysis 2014-2021 and Forecast 2022-2029, By Distribution Channels

    9.1. Introduction / Key Findings

    9.2. Historical Market Size (US$ Mn) Analysis By Distribution Channels, 2014–2021

    9.3. Current and Future Market Size (US$ Mn) Analysis and Forecast By Distribution Channels, 2022-2029

        9.3.1. Hospital Pharmacies

        9.3.2. Retail Pharmacies & Drug Stores

        9.3.3. Online Pharmacies 

    9.4. Market Attractiveness Analysis By Distribution Channels

10. Global Market Analysis 2014-2021 and Forecast 2022-2029, by Region

    10.1. Introduction / Key Findings

    10.2. Historical Market Size (US$ Mn) Analysis By Region, 2014–2021

    10.3. Current and Future Market Size (US$ Mn) Analysis and Forecast By Region, 2022-2029

        10.3.1. North America

        10.3.2. Latin America

        10.3.3. Europe

        10.3.4. East Asia

        10.3.5. South Asia Pacific

        10.3.6. Middle East and Africa (MEA)

    10.4. Market Attractiveness Analysis By Region

11. North America Market Analysis 2014-2021 and Forecast 2022-2029

    11.1. Introduction

    11.2. Historical Market Size (US$ Mn) Analysis By Market Taxonomy, 2014–2021

    11.3. Current and Future Market Size (US$ Mn) Analysis and Forecast By Market Taxonomy, 2022-2029

        11.3.1.  By Country

            11.3.1.1. U.S.

            11.3.1.2. Canada

        11.3.2. By Product Type

        11.3.3. By Distribution Channels

        11.3.4. By Region

    11.4. Market Attractiveness Analysis

    11.5. Key Market Participants - Intensity Mapping

    11.6. Drivers and Restraints - Impact Analysis

12. Latin America Market Analysis 2014-2021 and Forecast 2022-2029

    12.1. Introduction

    12.2. Historical Market Size (US$ Mn) Analysis By Market Taxonomy, 2014–2021

    12.3. Current and Future Market Size (US$ Mn) Analysis and Forecast By Market Taxonomy, 2022-2029

        12.3.1. By Country

            12.3.1.1. Brazil

            12.3.1.2. Mexico

            12.3.1.3. Argentina

            12.3.1.4. Rest of Latin America

        12.3.2. By Product Type

        12.3.3. By Distribution Channels

        12.3.4. By Region

    12.4. Market Attractiveness Analysis

    12.5. Key Market Participants - Intensity Mapping

    12.6. Drivers and Restraints - Impact Analysis

13. Europe Market Analysis 2014-2021 and Forecast 2022-2029

    13.1. Introduction

    13.2. Historical Market Size (US$ Mn) Analysis By Market Taxonomy, 2014–2021

    13.3. Current and Future Market Size (US$ Mn) Analysis and Forecast By Market Taxonomy, 2022-2029

        13.3.1. By Country

            13.3.1.1. Germany

            13.3.1.2. Italy

            13.3.1.3. France

            13.3.1.4. U.K.

            13.3.1.5. Spain

            13.3.1.6. Russia

            13.3.1.7. Rest of Europe

        13.3.2. By Product Type

        13.3.3. By Distribution Channels

        13.3.4. By Region

    13.4. Market Attractiveness Analysis

    13.5. Key Market Participants - Intensity Mapping

    13.6. Drivers and Restraints - Impact Analysis

14. South Asia and Oceania Market Analysis 2014-2021 and Forecast 2022-2029

    14.1. Introduction

    14.2. Historical Market Size (US$ Mn) Analysis By Market Taxonomy, 2014–2021

    14.3. Current and Future Market Size (US$ Mn) Analysis and Forecast By Market Taxonomy, 2022-2029

        14.3.1. By Country

            14.3.1.1. India

            14.3.1.2. ASEAN

            14.3.1.3. Australia

            14.3.1.4. New Zealand

        14.3.2. By Product Type

        14.3.3. By Distribution Channels

        14.3.4. By Region

    14.4. Market Attractiveness Analysis

    14.5. Key Market Participants - Intensity Mapping

    14.6. Drivers and Restraints - Impact Analysis

15. East Asia Market Analysis 2014-2021 and Forecast 2022-2029

    15.1. Introduction

    15.2. Historical Market Size (US$ Mn) Analysis By Market Taxonomy, 2014–2021

    15.3. Current and Future Market Size (US$ Mn) Analysis and Forecast By Market Taxonomy, 2022-2029

        15.3.1. By Country

            15.3.1.1. China

            15.3.1.2. Japan

            15.3.1.3. South Korea

        15.3.2. By Product Type

        15.3.3. By Distribution Channels

        15.3.4. By Region

    15.4. Market Attractiveness Analysis

    15.5. Key Market Participants - Intensity Mapping

    15.6. Drivers and Restraints - Impact Analysis

16. Middle East and Africa Market Analysis 2014-2021 and Forecast 2022-2029

    16.1. Introduction

    16.2. Historical Market Size (US$ Mn) Analysis By Market Taxonomy, 2014–2021

    16.3. Current and Future Market Size (US$ Mn) Analysis and Forecast By Market Taxonomy, 2022-2029

        16.3.1.  By Country

            16.3.1.1. GCC Countries

            16.3.1.2. Turkey

            16.3.1.3. South Africa

            16.3.1.4. Rest of Middle East and Africa

        16.3.2. By Product Type

        16.3.3. By Distribution Channels

        16.3.4. By Distribution Channels

        16.3.5. By Region

        16.3.6. By Region

    16.4. Market Attractiveness Analysis

    16.5. Key Market Participants - Intensity Mapping

    16.6. Drivers and Restraints - Impact Analysis

17. Key and Emerging Countries Market Analysis 2014-2021 and Forecast 2022-2029

    17.1. Introduction

        17.1.1. Market Value Proportion Analysis, By Key Countries

        17.1.2. Global Vs. Country Growth Comparison

    17.2. U.S. Market Analysis

        17.2.1. By Product Type

        17.2.2. By Distribution Channels

        17.2.3. By Region

    17.3. Canada Market Analysis

        17.3.1. By Product Type

        17.3.2. By Distribution Channels

        17.3.3. By Region

    17.4. Mexico Market Analysis

        17.4.1. By Product Type

        17.4.2. By Distribution Channels

        17.4.3. By Region

    17.5. Brazil Market Analysis

        17.5.1. By Product Type

        17.5.2. By Distribution Channels

        17.5.3. By Region

    17.6. U.K. Market Analysis

        17.6.1. By Product Type

        17.6.2. By Distribution Channels

        17.6.3. By Region

    17.7. Germany Market Analysis

        17.7.1. By Product Type

        17.7.2. By Distribution Channels

        17.7.3. By Region

    17.8. France Market Analysis

        17.8.1. By Product Type

        17.8.2. By Distribution Channels

        17.8.3. By Region

    17.9. Italy Market Analysis

        17.9.1. By Product Type

        17.9.2. By Distribution Channels

        17.9.3. By Region

    17.10. Spain Market Analysis

        17.10.1. By Product Type

        17.10.2. By Distribution Channels

        17.10.3. By Region

    17.11. BENELUX Market Analysis

        17.11.1. By Product Type

        17.11.2. By Distribution Channels

        17.11.3. By Region

    17.12. Russia Market Analysis

        17.12.1. By Product Type

        17.12.2. By Distribution Channels

        17.12.3. By Region

    17.13. China Market Analysis

        17.13.1. By Product Type

        17.13.2. By Distribution Channels

        17.13.3. By Region

    17.14. Japan Market Analysis

        17.14.1. By Product Type

        17.14.2. By Distribution Channels

        17.14.3. By Region

    17.15. South Korea Market Analysis

        17.15.1. By Product Type

        17.15.2. By Distribution Channels

        17.15.3. By Region

    17.16. India Market Analysis

        17.16.1. By Product Type

        17.16.2. By Distribution Channels

        17.16.3. By Region

    17.17. ASEAN Market Analysis

        17.17.1. By Product Type

        17.17.2. By Distribution Channels

        17.17.3. By Region

    17.18. Australia Market Analysis

        17.18.1. By Product Type

        17.18.2. By Distribution Channels

        17.18.3. By Region

    17.19. New Zealand Market Analysis

        17.19.1. By Product Type

        17.19.2. By Raw Material

        17.19.3. By Region

    17.20. GCC Countries Market Analysis

        17.20.1. By Product Type

        17.20.2. By Distribution Channels

        17.20.3. By Region

    17.21. Turkey Market Analysis

        17.21.1. By Product Type

        17.21.2. By Distribution Channels

        17.21.3. By Region

    17.22. South Africa Market Analysis

        17.22.1. By Product Type

        17.22.2. By Distribution Channels

        17.22.3. By Region

18. Market Structure Analysis

    18.1. Market Analysis by Tier of Companies 

    18.2. Market Share Analysis of Top Players

    18.3. Market Presence Analysis

        18.3.1. Regional Footprint by Players

        18.3.2. Product Foot print by Players

        18.3.3. Channel Foot Print by Players

19. Competition Analysis

    19.1. Competition Dashboard

    19.2. Competition Benchmarking

    19.3. Competition Deep Dive (Tentative List)

        19.3.1. Sanofi S.A.

            19.3.1.1. Overview

            19.3.1.2. Product  Portfolio

            19.3.1.3. Profitability by Market Segments (Product/Channel/Region)

            19.3.1.4. Sales Footprint

            19.3.1.5. Strategy Overview

            19.3.1.6. Marketing Strategy

            19.3.1.7. Product Strategy

            19.3.1.8. Channel Strategy

        19.3.2. Pfizer Inc. 

            19.3.2.1. Overview

            19.3.2.2. Product  Portfolio

            19.3.2.3. Profitability by Market Segments (Product/Channel/Region)

            19.3.2.4. Sales Footprint

            19.3.2.5. Strategy Overview

            19.3.2.6. Marketing Strategy

            19.3.2.7. Product Strategy

            19.3.2.8. Channel Strategy

        19.3.3. GlaxoSmithKline Plc. 

            19.3.3.1. Overview

            19.3.3.2. Product  Portfolio

            19.3.3.3. Profitability by Market Segments (Product/Channel/Region)

            19.3.3.4. Sales Footprint

            19.3.3.5. Strategy Overview

            19.3.3.6. Marketing Strategy

            19.3.3.7. Product Strategy

            19.3.3.8. Channel Strategy

        19.3.4. Hisamitsu Pharmaceutical Co., Inc. 

            19.3.4.1. Overview

            19.3.4.2. Product  Portfolio

            19.3.4.3. Profitability by Market Segments (Product/Channel/Region)

            19.3.4.4. Sales Footprint

            19.3.4.5. Strategy Overview

            19.3.4.6. Marketing Strategy

            19.3.4.7. Product Strategy

            19.3.4.8. Channel Strategy

        19.3.5. Clarion Brands

            19.3.5.1. Overview

            19.3.5.2. Product  Portfolio

            19.3.5.3. Profitability by Market Segments (Product/Channel/Region)

            19.3.5.4. Sales Footprint

            19.3.5.5. Strategy Overview

            19.3.5.6. Marketing Strategy

            19.3.5.7. Product Strategy

            19.3.5.8. Channel Strategy

        19.3.6. Endo Pharmaceuticals 

            19.3.6.1. Overview

            19.3.6.2. Product  Portfolio

            19.3.6.3. Profitability by Market Segments (Product/Channel/Region)

            19.3.6.4. Sales Footprint

            19.3.6.5. Strategy Overview

            19.3.6.6. Marketing Strategy

            19.3.6.7. Product Strategy

            19.3.6.8. Channel Strategy

        19.3.7. TEH SENG Pharmaceutical 

            19.3.7.1. Overview

            19.3.7.2. Product  Portfolio

            19.3.7.3. Profitability by Market Segments (Product/Channel/Region)

            19.3.7.4. Sales Footprint

            19.3.7.5. Strategy Overview

            19.3.7.6. Marketing Strategy

            19.3.7.7. Product Strategy

            19.3.7.8. Channel Strategy

        19.3.8. Veridian Healthcare 

            19.3.8.1. Overview

            19.3.8.2. Product  Portfolio

            19.3.8.3. Profitability by Market Segments (Product/Channel/Region)

            19.3.8.4. Sales Footprint

            19.3.8.5. Strategy Overview

            19.3.8.6. Marketing Strategy

            19.3.8.7. Product Strategy

            19.3.8.8. Channel Strategy

        19.3.9. Sorrento Therapeutics (SCILEX Pharmaceuticals Inc.) 

            19.3.9.1. Overview

            19.3.9.2. Product  Portfolio

            19.3.9.3. Profitability by Market Segments (Product/Channel/Region)

            19.3.9.4. Sales Footprint

            19.3.9.5. Strategy Overview

            19.3.9.6. Marketing Strategy

            19.3.9.7. Product Strategy

            19.3.9.8. Channel Strategy

        19.3.10. Teva Pharmaceutical Industries Ltd.

            19.3.10.1. Overview

            19.3.10.2. Product  Portfolio

            19.3.10.3. Profitability by Market Segments (Product/Channel/Region)

            19.3.10.4. Sales Footprint

            19.3.10.5. Strategy Overview

            19.3.10.6. Marketing Strategy

            19.3.10.7. Product Strategy

            19.3.10.8. Channel Strategy

        19.3.11. Teikoku Seiyaku Co. Ltd. 

            19.3.11.1. Overview

            19.3.11.2. Product  Portfolio

            19.3.11.3. Profitability by Market Segments (Product/Channel/Region)

            19.3.11.4. Sales Footprint

            19.3.11.5. Strategy Overview

            19.3.11.6. Marketing Strategy

            19.3.11.7. Product Strategy

            19.3.11.8. Channel Strategy

20. Assumptions and Acronyms Used

21. Research Methodology

Don't pay for what you don't need

Customize your report by selecting specific countries or regions and save 30%!

List of Tables

Table 01: Global Market Value (US$ Mn) Analysis and Opportunity Assessment 2014-2029, By Product Type

Table 02: Global Market Value (US$ Mn) Analysis and Opportunity Assessment 2014-2029, By Distribution Channel

Table 03: Global Market Value (US$ Mn) Analysis and Opportunity Assessment 2014-2029, By Region 

Table 04: North America Market Value (US$ Mn) Analysis 2014-2021 and Forecast 2022-2029, By Country

Table 05: North America Market Value (US$ Mn) Analysis 2014-2021 and Forecast 2022-2029, By Product Type

Table 06: North America Market Value (US$ Mn) Analysis 2014-2021 and Forecast 2022-2029, By Distribution Channel

Table 07: Latin America Market Value (US$ Mn) Analysis 2014-2021 and Forecast 2022-2029, By Country

Table 08: Latin America Market Value (US$ Mn) Analysis 2014-2021 and Forecast 2022-2029, By Product Type

Table 09: Latin America Market Value (US$ Mn) Analysis 2014-2021 and Forecast 2022-2029, By Distribution Channel

Table 10: Europe Market Value (US$ Mn) Analysis 2014-2021 and Forecast 2022-2029, By Country

Table 11: Europe Market Value (US$ Mn) Analysis 2014-2021 and Forecast 2022-2029, By Product Type

Table 12: Europe Market Value (US$ Mn) Analysis 2014-2021 and Forecast 2022-2029, By Distribution Channel

Table 13: South Asia Market Value (US$ Mn) Analysis 2014-2021 and Forecast 2022-2029, By Country

Table 14: South Asia Market Value (US$ Mn) Analysis 2014-2021 and Forecast 2022-2029, By Product Type

Table 15: South Asia Market Value (US$ Mn) Analysis 2014-2021 and Forecast 2022-2029, By Distribution Channel

Table 16: East Asia Market Value (US$ Mn) Analysis 2014-2021 and Forecast 2022-2029, By Country

Table 17: East Asia Market Value (US$ Mn) Analysis 2014-2021 and Forecast 2022-2029, By Product Type

Table 18: East Asia Market Value (US$ Mn) Analysis 2014-2021 and Forecast 2022-2029, By Distribution Channel

Table 19: Oceania Market Value (US$ Mn) Analysis 2014-2021 and Forecast 2022-2029, By Country

Table 20: Oceania Market Value (US$ Mn) Analysis 2014-2021 and Forecast 2022-2029, By Product Type

Table 21: Oceania Market Value (US$ Mn) Analysis 2014-2021 and Forecast 2022-2029, By Distribution Channel

Table 22: MEA Market Value (US$ Mn) Analysis 2014-2021 and Forecast 2022-2029, By Country

Table 23: MEA Market Value (US$ Mn) Analysis 2014-2021 and Forecast 2022-2029, By Product Type

Table 24: MEA Market Value (US$ Mn) Analysis 2014-2021 and Forecast 2022-2029, By Distribution Channel

Table 25: Japan Market Value (US$ Mn) Analysis 2014-2021 and Forecast 2022-2029, By Product Type

Table 26: Japan Market Value (US$ Mn) Analysis 2014-2021 and Forecast 2022-2029, By Distribution Channels

Table 27: China Market Value (US$ Mn) Analysis 2014-2021 and Forecast 2022-2029, By Product Type

Table 28: China Market Value (US$ Mn) Analysis 2014-2021 and Forecast 2022-2029, By Distribution Channels

Table 29: Brazil Market Value (US$ Mn) Analysis 2014-2021 and Forecast 2022-2029, By Product Type

Table 41: Brazil Market Value (US$ Mn) Analysis 2014-2021 and Forecast 2022-2029, By Distribution Channels
Sabyasachi Ghosh
Sabyasachi Ghosh

Principal Consultant

Talk to Analyst

Find your sweet spots for generating winning opportunities in this market.

List of Charts

Figure 01: Global Market Value Analysis (US$ Mn), 2014-2021

Figure 02: Global Market Value Forecast (US$ Mn), 2022-2029

Figure 03: Global Market Absolute $ Opportunity, 2022 - 2029

Figure 04: Global Market Share Analysis (%), By Product Type, 2022-2029

Figure 05: Global Market Y-o-Y Analysis (%), By Product Type, 2022-2029

Figure 06: Global Market Attractiveness Analysis by Product Type, 2022-2029

Figure 07: Global Market Share Analysis (%), By Distribution Channel, 2022-2029

Figure 08: Global Market Y-o-Y Analysis (%), By Distribution Channel, 2022-2029

Figure 09: Global Market Attractiveness Analysis by Distribution Channel, 2022-2029

Figure 10: Global Market Share Analysis (%), By Region, 2022-2029

Figure 11: Global Market Y-o-Y Analysis (%), By Region, 2022-2029

Figure 12: Global Market Attractiveness Analysis by Region, 2022-2029

Figure 13: North America Market Value Share, By Product Type, 2022 (E)

Figure 14: North America Market Value Share, By Distribution Channel, 2022 (E)

Figure 15: North America Market Value Share, By Country, 2022 (E)

Figure 16: North America Market Value Analysis (US$ Mn), 2014-2021

Figure 17: North America Market Value Forecast (US$ Mn), 2022-2029

Figure 18: North America Market Attractiveness Analysis by Product Type, 2022-2029

Figure 19: North America Market Attractiveness Analysis by Distribution Channels, 2022-2029

Figure 20: North America Market Attractiveness Analysis by Country, 2022-2029

Figure 21: Latin America Market Value Share, By Product Type, 2022 (E)

Figure 22: Latin America Market Value Share, By Distribution Channel, 2022 (E)

Figure 23: Latin America Market Value Share, By Country, 2022 (E)

Figure 24: Latin America Market Value Analysis (US$ Mn), 2014-2021

Figure 25: Latin America Market Value Forecast (US$ Mn), 2022-2029

Figure 26: Latin America Market Attractiveness Analysis by Product Type, 2022-2029

Figure 27: Latin America Market Attractiveness Analysis by Distribution Channels, 2022-2029

Figure 28: Latin America Market Attractiveness Analysis by Country, 2022-2029

Figure 29: Europe Market Value Share, By Product Type, 2022 (E)

Figure 30: Europe Market Value Share, By Distribution Channel, 2022 (E)

Figure 31: Europe Market Value Share, By Country, 2022 (E)

Figure 32: Europe Market Value Analysis (US$ Mn), 2014-2021

Figure 33: Europe Market Value Forecast (US$ Mn), 2022-2029

Figure 34: Europe Market Attractiveness Analysis by Product Type, 2022-2029

Figure 35: Europe Market Attractiveness Analysis by Distribution Channels, 2022-2029

Figure 36: Europe Market Attractiveness Analysis by Country, 2022-2029

Figure 37: South Asia Market Value Share, By Product Type, 2022 (E)

Figure 38: South Asia Market Value Share, By Distribution Channel, 2022 (E)

Figure 39: South Asia Market Value Share, By Country, 2022 (E)

Figure 40: South Asia Market Value Analysis (US$ Mn), 2014-2021

Figure 41: South Asia Market Value Forecast (US$ Mn), 2022-2029

Figure 42: South Asia Market Attractiveness Analysis by Product Type, 2022-2029

Figure 43: South Asia Market Attractiveness Analysis by Distribution Channels, 2022-2029

Figure 44: South Asia Market Attractiveness Analysis by Country, 2022-2029

Figure 45: East Asia Market Value Share, By Product Type, 2022 (E)

Figure 46: East Asia Market Value Share, By Distribution Channel, 2022 (E)

Figure 47: East Asia Market Value Share, By Country, 2022 (E)

Figure 48: East Asia Market Value Analysis (US$ Mn), 2014-2021

Figure 49: East Asia Market Value Forecast (US$ Mn), 2022-2029

Figure 50: East Asia Market Attractiveness Analysis by Product Type, 2022-2029

Figure 51: East Asia Market Attractiveness Analysis by Distribution Channels, 2022-2029

Figure 52: East Asia Market Attractiveness Analysis by Country, 2022-2029

Figure 53: Oceania Market Value Share, By Product Type, 2022 (E)

Figure 54: Oceania Market Value Share, By Distribution Channel, 2022 (E)

Figure 55: Oceania Market Value Share, By Country, 2022 (E)

Figure 56: Oceania Market Value Analysis (US$ Mn), 2014-2021

Figure 57: Oceania Market Value Forecast (US$ Mn), 2022-2029

Figure 58: Oceania Market Attractiveness Analysis by Product Type, 2022-2029

Figure 59: Oceania Market Attractiveness Analysis by Distribution Channels, 2022-2029

Figure 60: Oceania Market Attractiveness Analysis by Country, 2022-2029

Figure 61: MEA Market Value Share, By Product Type, 2022 (E)

Figure 62: MEA Market Value Share, By Distribution Channel, 2022 (E)

Figure 63: MEA Market Value Share, By Country, 2022 (E

Figure 64: MEA Market Value Analysis (US$ Mn), 2014-2021

Figure 65: MEA Market Value Forecast (US$ Mn), 2022-2029

Figure 66: MEA Market Attractiveness Analysis by Product Type, 2022-2029

Figure 67: MEA Market Attractiveness Analysis by Distribution Channels, 2022-2029

Figure 68: MEA Market Attractiveness Analysis by Country, 2022-2029

Figure 69: India Market Value Analysis (US$ Mn), 2014-2021

Figure 70: India Market Value Forecast (US$ Mn), 2022-2029

Figure 71: China Market Value Analysis (US$ Mn), 2014-2021

Figure 72: China Market Value Forecast (US$ Mn), 2022-2029

Figure 73: Brazil Market Value Analysis (US$ Mn), 2014-2021

Figure 74: Brazil Market Value Forecast (US$ Mn), 2022-2029

Figure 75: U. S. Market Value Analysis (US$ Mn), 2022 & 2029

Figure 76: U. S. Market Value Share, By Product Type, 2022 (E)

Figure 77: U. S. Market Value Share, By Distribution Channel, 2022 (E)

Figure 78: Canada Market Value Analysis (US$ Mn), 2022 & 2029

Figure 79: Canada Market Value Share, By Product Type, 2022 (E)

Figure 80: Canada Market Value Share, By Distribution Channel, 2022 (E)

Figure 81: Mexico Market Value Analysis (US$ Mn), 2022 & 2029

Figure 82: Mexico Market Value Share, By Product Type, 2022 (E)

Figure 83: Mexico Market Value Share, By Distribution Channel, 2022 (E)

Figure 84: Germany Market Value Analysis (US$ Mn), 2022 & 2029

Figure 85: Germany Market Value Share, By Product Type, 2022 (E)

Figure 86: Germany Market Value Share, By Distribution Channel, 2022 (E)

Figure 87: U.K. Market Value Analysis (US$ Mn), 2022 & 2029

Figure 88: U.K. Market Value Share, By Product Type, 2022 (E)

Figure 89: U.K. Market Value Share, By Distribution Channel, 2022 (E)

Figure 90: France Market Value Analysis (US$ Mn), 2022 & 2029

Figure 91: France Market Value Share, By Product Type, 2022 (E)

Figure 92: France Market Value Share, By Distribution Channel, 2022 (E)

Figure 93: Italy Market Value Analysis (US$ Mn), 2022 & 2029

Figure 94: Italy Market Value Share, By Product Type, 2022 (E)

Figure 95: Italy Market Value Share, By Distribution Channel, 2022 (E)

Figure 96: Spain Market Value Analysis (US$ Mn), 2022 & 2029

Figure 97: Spain Market Value Share, By Product Type, 2022 (E)

Figure 98: Spain Market Value Share, By Distribution Channel, 2022 (E)

Figure 99: Russia Market Value Analysis (US$ Mn), 2022 & 2029

Figure 100: Russia Market Value Share, By Product Type, 2022 (E)

Figure 101: Russia Market Value Share, By Distribution Channel, 2022 (E)

Figure 102: Japan Market Value Analysis (US$ Mn), 2022 & 2029

Figure 103: Japan Market Value Share, By Product Type, 2022 (E)

Figure 104: Japan Market Value Share, By Distribution Channel, 2022 (E)

Figure 105: South Korea Market Value Analysis (US$ Mn), 2022 & 2029

Figure 106: South Korea Market Value Share, By Product Type, 2022 (E)

Figure 107: South Korea Market Value Share, By Distribution Channel, 2022 (E)

Figure 108: Australia Market Value Analysis (US$ Mn), 2022 & 2029

Figure 109: Australia Market Value Share, By Product Type, 2022 (E)

Figure 110: Australia Market Value Share, By Distribution Channel, 2022 (E)

Figure 111: New Zealand Market Value Analysis (US$ Mn), 2022 & 2029

Figure 112: New Zealand Market Value Share, By Product Type, 2022 (E)

Figure 113: New Zealand Market Value Share, By Distribution Channel, 2022 (E)

Figure 114: GCC Countries Market Value Analysis (US$ Mn), 2022 & 2029

Figure 115: GCC Countries Market Value Share, By Product Type, 2022 (E)

Figure 116: GCC Countries Market Value Share, By Distribution Channel, 2022 (E)

Figure 117: South Africa Market Value Analysis (US$ Mn), 2022 & 2029

Figure 118: South Africa Market Value Share, By Product Type, 2022 (E)

Figure 119: South Africa Market Value Share, By Distribution Channel, 2022 (E)

Figure 120: Turkey Market Value Analysis (US$ Mn), 2022 & 2029

Figure 121: Turkey Market Value Share, By Product Type, 2022 (E)

Figure 122: Turkey Market Value Share, By Distribution Channel, 2022 (E)

Recommendations

Healthcare

Opioid Analgesics Market

Published : August 2023

Healthcare

Pain Patches Market

Published : March 2023

Healthcare

Analgesics Market

Published : December 2022

Healthcare

Vascular Patches Market

Published : May 2022

Explore Healthcare Insights

View Reports

Non-opioid Pain Patches Market