The Corporate Event Planner Market is estimated to be valued at USD 678.7 billion in 2025 and is projected to reach USD 9508.6 billion by 2035, registering a compound annual growth rate (CAGR) of 30.2% over the forecast period.
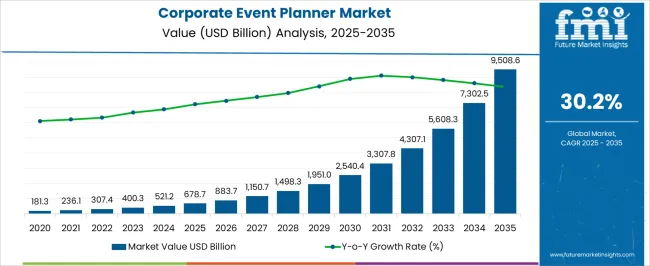
| Metric | Value |
|---|---|
| Corporate Event Planner Market Estimated Value in (2025 E) | USD 678.7 billion |
| Corporate Event Planner Market Forecast Value in (2035 F) | USD 9508.6 billion |
| Forecast CAGR (2025 to 2035) | 30.2% |
The Corporate Event Planner market is experiencing steady growth, driven by increasing demand for structured and professionally managed corporate events across multiple industries. The current market landscape is shaped by organizations seeking to enhance engagement, brand visibility, and internal communications through well-organized events.
Technological advancements in event management software, virtual and hybrid event platforms, and real-time analytics are enabling planners to provide more tailored and impactful experiences. Rising corporate budgets for events, combined with the growing importance of employee engagement, networking, and client relationship management, are further supporting market expansion.
The market is also influenced by the globalization of business operations and the increasing focus on cross-border collaboration, which has amplified the need for professional event planning services As companies continue to prioritize strategic communication and branding initiatives, the demand for corporate event planners is expected to remain strong, offering opportunities for service differentiation, innovation, and scalable event solutions.
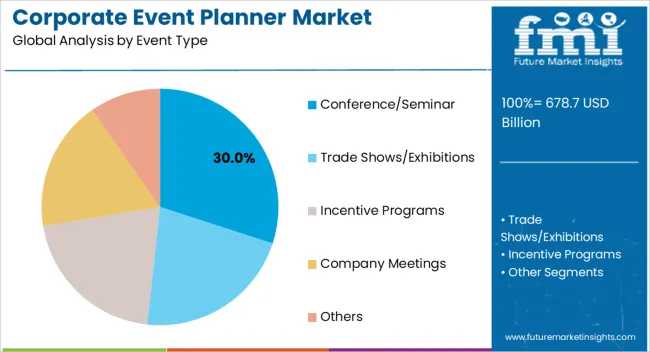
The Conference and Seminar event type is projected to account for 30.00% of the Corporate Event Planner market revenue share in 2025, making it the leading event type. This prominence is being driven by the demand for knowledge-driven and networking-focused gatherings, where organizations aim to facilitate industry discussions, skill development, and stakeholder engagement.
The growth of this segment is supported by increasing investments in thought leadership initiatives and corporate training programs. Conferences and seminars are valued for their ability to bring together large audiences in a structured environment, while allowing event planners to implement innovative formats, technologies, and logistical management practices.
Adoption has also been reinforced by the shift toward hybrid events, where digital platforms complement physical venues, enabling wider participation and measurable outcomes The scalability of conference and seminar formats and their ability to deliver high visibility and impactful experiences continue to strengthen their position as the leading event type segment in the market.
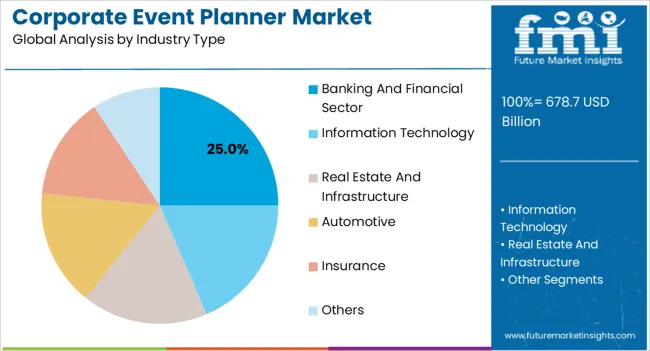
The Banking and Financial Sector industry segment is expected to capture 25.00% of the Corporate Event Planner market revenue in 2025, emerging as the largest industry segment. This leadership has been attributed to the high frequency of investor meetings, shareholder events, regulatory workshops, product launches, and client engagement initiatives within this sector.
The segment’s growth has been supported by the need for professionally executed events that maintain compliance, confidentiality, and a strong corporate image. Financial institutions place emphasis on delivering highly polished events to reinforce brand reputation and client trust.
Additionally, the adoption of technology-enabled event solutions, including virtual and hybrid platforms, has further increased efficiency and participation, allowing events to reach a wider audience with reduced logistical complexity The sector’s focus on relationship management, knowledge dissemination, and regulatory compliance continues to drive demand for corporate event planning services, positioning the Banking and Financial Sector as a dominant contributor to overall market growth.
Consumers' Expendable Income
Customers' disposable income has boosted their interest in organizing the event with the help of various event planners and event management companies, which is expected to drive the corporate event planner market during the forecast period.
Everyone wants their events to go smoothly, and with the help of an events management company, the client can reduce stress and enjoy their event.
Proper event management is essential for any successful event. With the increase in disposable income, people prefer to hire an event planner and get the event done. Consumers' rising disposable income is expected to drive the global corporate event planner market during the forecast period.
Growing Youth Interest in Entrepreneurship and Business Seminars are a Motivating Force in the Market.
One of the most interesting and challenging jobs is event management. Today's youth are eager to pursue careers in event planning because it is a job that allows them to work and have fun at the same time. Event management allows them to meet new people and work in groups.
Due to the numerous benefits of being an event planner, most young people are drawn to this profession, which is expected to drive the market. Furthermore, companies are surging at a faster rate and investing heavily in organizing events where they can showcase products or meet employees to convey a message, which is expected to boost the market.
The Emergence of Social Media Advertising and Marketing to Facilitate Gains
Social media is a robust and free online platform for event planners to support their business goals. Social media advertising and marketing enable event planners to track website traffic, gain more clients, and help shape the organization's reputation.
Social media tools such as Twitter, Facebook, LinkedIn, and Instagram are used by event planners for social media outreach.
They can analyze the most successful channels and the type of content that users are sharing using tools like Hootsuite, Oktopost, or Mention. As a result, the use of social media for event marketing is expected to boost the corporate event planner market growth during the forecast period.
High Initial Cost and Complex Integration of Event Management Software to Encumber Growth
Integrating event management software solutions with CRM systems allows event planners to easily plan, promote, and track all activities. However, integrating this software with CRM or other business functions is difficult because it necessitates a high level of technical expertise.
Lack of technical knowledge, particularly in SMEs, may result in the software's integration with other business systems failing, resulting in the loss of critical business information. Furthermore, high initial costs, as well as a lack of expertise, are some key factors impeding the growth and opportunities.
High Prices are Projected to Pose the Most Significant Market Restraint
The cost of organizing the event is very high, and this is expected to restraint the global market during the forecast period.
Most organizations and individuals are interested in organizing an event, but the high cost and the event planners' fees limit market growth. Most organizations and the general public avoid hiring an event planner due to the higher costs.
Key corporate event planner market players are adopting cloud technology because it allows end-users to store massive amounts of data and files in a remote location and access them from any internet-enabled location.
Cloud-based software solutions allow corporate event planners to interact with employees, suppliers, and clients easily. Cloud-based solutions assist corporate event planners in creating and managing location lists, representing pictorial images or charts for better management, and even identifying potential custom events.
Cloud-based event management software can manage event teams from any location at any time and support and manage booking requests in a streamlined manner. Similarly, this software can handle event promotions, bookings, cancellations, and financial transactions.
Corporate event planners can use cloud-based software to prioritize and resolve event tasks in a single platform. Aside from providing all cloud-related information, this software simplifies all the day-to-day tasks associated with event planning. The cloud-based solution may automate and streamline the majority of the time-consuming and labor-intensive tasks.
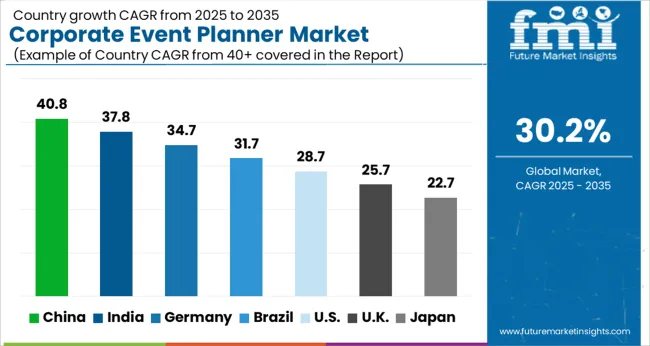
The North American region in the corporate event planner market is expected to provide corporate event planner market growth and opportunities for the regional market during the forecast period.
During the forecast period, the North American market held a market share of 29.1% in 2025. The presence of many companies throughout the region and companies investing heavily in event organization is expected to be a key driving factor for the market in the estimated timeframe.
North America's corporate event planner market is so large that it employs many people. Such factors are expected to drive the regional market during the forecast.
| Category | By Event Type |
|---|---|
| Leading Segment | Trade Shows/Exhibitions |
| Market Share (2025) | 36.8% |
| Category | By Industry Type |
|---|---|
| Leading Segment | Information Technology (IT) |
| Market Share (2025) | 33.5% |
According to the forecast, company meetings segment is expected to have a substantial CAGR in the corporate event market over the forecast period.
This is due to the growth of the travel and tourism industry, an increase in international business travel, and the expansion of the information technology sector. The conference/seminar segment dominated the corporate event planner market and is expected to continue throughout the forecast period.
This is due to increased meeting activities in various industries, including information technology, banking and finance, food and beverage, real estate and infrastructure, and automotive.
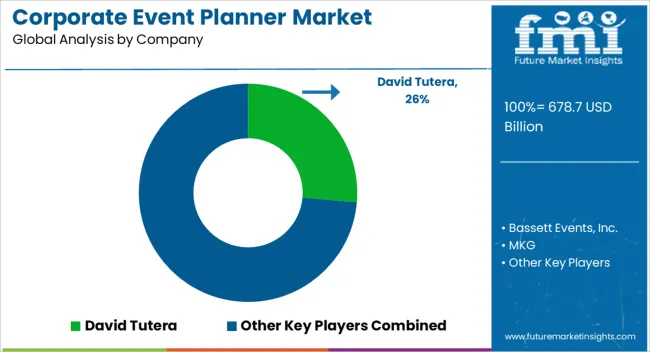
Players in the market have used diverse development strategies to increase their market share, capitalize on the corporate event planner market opportunity, and increase profitability. Large initial investments are required to launch a new event organization. However, new entrants in the market pose a moderate threat.
Bassett Events, Inc., MKG, Colin Cowie, David Tutera, JR Global Events, Rafanelli Events, Oren Co, Wonderland, Event Solutions, MGM Resorts, and AJ Williams Events are among the key players profiled.
Recent Developments:
MKG collaborated with creative director Willo Perron to design and produce a larger-than-life launch event for press and influencers in Los Angeles to build excitement around the new Razr and re-establish Motorola as a key player in the corporate event planner market.
MKG produced a short film and projected it onto the iconic Griffith Observatory using the actual cityscape of Los Angeles to showcase Delta and the LA28 Olympic Committee's future vision for the games to announce Delta Air Lines as the founding partner of the 2035 Olympic and Paralympic Games.
Bassett Events has experienced tremendous corporate event planner market growth and continues to do so year after year. Bassett Events is always looking for new clients who may challenge us and allow us to stretch our creative muscles.
Creating one-of-a-kind and never-before-seen experiences for event guests is always a goal and necessary in this industry to stay relevant. Maintaining international clients and events is a top priority.
JR Global Events is a unique full-service international meeting and corporate event planning company. Their inventiveness and can-do attitude combine to offer their clients one-of-a-kind solutions.
The revenue of JR Global Events is USD 5 million. JR Global Events employs the following technologies: HubSpot Sales, HubSpot CRM, HubSpot Calls-to-Action, and Google Cloud Platform.
With the launch of their revamped website and registration solution, Cvent, the market-leading provider of meetings, events, and hospitality technology, has revolutionized event website design. The new interface, dubbed registration reimagined, gives the user complete design control and combines flexible design capabilities with drag-and-drop usability.
Event professionals and marketers in Australia can now create customizable registration pages and interactive websites that are easy to use, mobile-responsive, flexible, and consistent with their event branding.
Active Network, LLC has emerged as a corporate event planner market leader. The SaaS-based EMS solution from the company provides smart registration, secure payment processing, and data-driven tools that assist event organizers in driving participation and increasing revenue while improving administration.
Key players are proactively fortifying their market position by collaborating with other small players and introducing new technologies to the corporate event planner market.
Aventri collaborated with Plannernet to offer customers access to a network of 1,500 specialists in 70 countries. It may assist meeting and event planners in locating Aventri-experienced meeting and event professionals.
However, regional and domestic players with innovative solutions, such as Active Network, LLC, Bizzabo, Cvent Inc., and Eventbank, have entered the corporate event planner market. This is expected to benefit the global market because these companies are expected to gain significant corporate event planner market share during the forecast period.
The global corporate event planner market is estimated to be valued at USD 678.7 billion in 2025.
The market size for the corporate event planner market is projected to reach USD 9,508.6 billion by 2035.
The corporate event planner market is expected to grow at a 30.2% CAGR between 2025 and 2035.
The key product types in corporate event planner market are conference/seminar, trade shows/exhibitions, incentive programs, company meetings and others.
In terms of industry type, banking and financial sector segment to command 25.0% share in the corporate event planner market in 2025.


Our Research Products

The "Full Research Suite" delivers actionable market intel, deep dives on markets or technologies, so clients act faster, cut risk, and unlock growth.

The Leaderboard benchmarks and ranks top vendors, classifying them as Established Leaders, Leading Challengers, or Disruptors & Challengers.

Locates where complements amplify value and substitutes erode it, forecasting net impact by horizon

We deliver granular, decision-grade intel: market sizing, 5-year forecasts, pricing, adoption, usage, revenue, and operational KPIs—plus competitor tracking, regulation, and value chains—across 60 countries broadly.

Spot the shifts before they hit your P&L. We track inflection points, adoption curves, pricing moves, and ecosystem plays to show where demand is heading, why it is changing, and what to do next across high-growth markets and disruptive tech

Real-time reads of user behavior. We track shifting priorities, perceptions of today’s and next-gen services, and provider experience, then pace how fast tech moves from trial to adoption, blending buyer, consumer, and channel inputs with social signals (#WhySwitch, #UX).

Partner with our analyst team to build a custom report designed around your business priorities. From analysing market trends to assessing competitors or crafting bespoke datasets, we tailor insights to your needs.
Supplier Intelligence
Discovery & Profiling
Capacity & Footprint
Performance & Risk
Compliance & Governance
Commercial Readiness
Who Supplies Whom
Scorecards & Shortlists
Playbooks & Docs
Category Intelligence
Definition & Scope
Demand & Use Cases
Cost Drivers
Market Structure
Supply Chain Map
Trade & Policy
Operating Norms
Deliverables
Buyer Intelligence
Account Basics
Spend & Scope
Procurement Model
Vendor Requirements
Terms & Policies
Entry Strategy
Pain Points & Triggers
Outputs
Pricing Analysis
Benchmarks
Trends
Should-Cost
Indexation
Landed Cost
Commercial Terms
Deliverables
Brand Analysis
Positioning & Value Prop
Share & Presence
Customer Evidence
Go-to-Market
Digital & Reputation
Compliance & Trust
KPIs & Gaps
Outputs
Full Research Suite comprises of:
Market outlook & trends analysis
Interviews & case studies
Strategic recommendations
Vendor profiles & capabilities analysis
5-year forecasts
8 regions and 60+ country-level data splits
Market segment data splits
12 months of continuous data updates
DELIVERED AS:
PDF EXCEL ONLINE
Corporate Wellness Solution Market Size and Share Forecast Outlook 2025 to 2035
Event Tourism Market Size and Share Forecast Outlook 2025 to 2035
Corporate Wellness Software Market Size and Share Forecast Outlook 2025 to 2035
Event Logistics Market Size and Share Forecast Outlook 2025 to 2035
Corporate Web Security Market Size and Share Forecast Outlook 2025 to 2035
Event Management Software Market Analysis - Size, Share, and Forecast 2025 to 2035
Event Apps Market Analysis – Size, Trends & Forecast 2025 to 2035
Leadership Training – AI-Powered Growth for Enterprises
Preventive Medicine Market Growth - Trends & Forecast 2025 to 2035
Korea Event Management Software Market Insights – Demand & Growth Forecast 2025 to 2035
Japan Event Management Software Market Growth - Trends & Forecast 2025 to 2035
Video Event Data Recorder Market Report – Trends & Forecast 2016-2026
Virtual Event Platforms Market Trends - Growth & Forecast 2025 to 2035
Competitive Landscape of Virtual Event Platforms Market Share
On-site Preventive Care Market Analysis - Size, Share, and Forecast Outlook 2025 to 2035
Embolic Prevention Systems Market
Blowout Preventers Market
Backflow Preventers Market Size and Share Forecast Outlook 2025 to 2035
Automotive Event Data Recorder Market Size and Share Forecast Outlook 2025 to 2035
Competitive Overview of Backflow Preventers Companies

Thank you!
You will receive an email from our Business Development Manager. Please be sure to check your SPAM/JUNK folder too.
Chat With
MaRIA