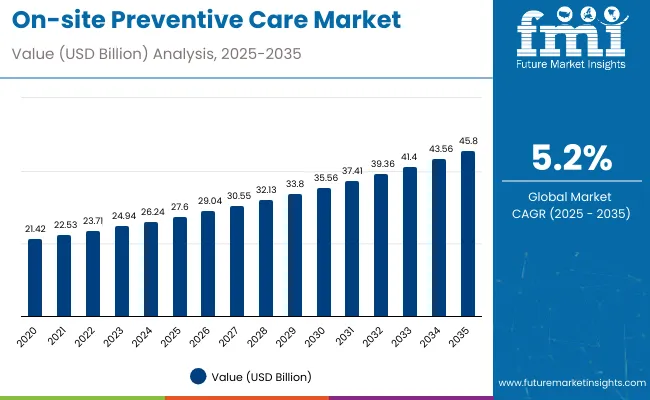
The on-site preventive care market is estimated to be valued at USD 27.6 billion in 2025. It is projected to reach USD 45.8 billion by 2035, registering a compound annual growth rate (CAGR) of 5.2% over the forecast period. The market is projected to generate an incremental opportunity of USD 18.21 billion over the forecast period.
| Metric | Value |
|---|---|
| Estimated Size (2025E) | USD 27.6 billion |
| Projected Value (2035F) | USD 45.8 billion |
| CAGR (2025 to 2035) | 5.2% |
This reflects a 1.66 times growth at a compound annual growth rate of 5.2%. The market's evolution is expected to be shaped by rising corporate wellness investments, increasing emphasis on employee health and productivity, and growing demand for cost-effective preventive healthcare solutions, particularly where immediate medical intervention and proactive health management are required.
By 2030, the market is likely to reach USD 36.5 billion, accounting for USD 8.93 billion in incremental value over the first half of the decade. The remaining USD 9.28 billion is expected during the second half, suggesting a moderately back-loaded growth pattern. Innovation in telehealth integration and digital wellness platforms is gaining traction, supported by on-site preventive care’s proven ROI and employee satisfaction benefits.
Companies such as Premise Health and OnSite Care, Inc. are advancing their competitive positions through investment in comprehensive health screening technologies and integrated wellness program formulations. Corporate wellness trends and rising demand for chronic disease prevention are driving expansion into manufacturing, technology, and healthcare applications. Market performance will remain anchored in regulatory compliance, service integration innovation, and measurable health outcome benchmarks.
The market holds a significant share within its parent industry segments. Within the corporate wellness market, it accounts for 15.2% due to its comprehensive on-site nature. In the preventive healthcare services segment, it commands a 6.8% share, supported by rising workplace health consciousness. It contributes nearly 4.1% to the occupational health market and 3.6% to the employee benefits category. In workplace healthcare solutions, on-site preventive care holds around 18.5% share, driven by its productivity enhancement benefits. Across the broader healthcare services market, its share is close to 2.4%, owing to its specialized corporate-focused applications.
The market is undergoing a strategic transformation driven by rising demand for comprehensive, cost-effective, and accessible workplace healthcare solutions. Advanced technologies, including telehealth integration, digital health platforms, and data analytics, have enhanced service delivery, health outcome measurement, and program personalization, making on-site preventive care programs viable alternatives to traditional employee health benefits.
Providers are introducing specialized service packages, including chronic disease management programs and mental health support tailored for specific industry applications, expanding their role beyond basic health screening functionality. Strategic partnerships between healthcare providers and technology companies have accelerated innovation in service delivery and corporate health integration. Regulatory compliance and HIPAA transparency have increased employer acceptanceacross diverse industry sectors, reshaping traditional workplace healthcare patterns and forcing conventional healthcare providers to develop on-site service capabilities.
On-site preventive care's exceptional convenience, cost-effectiveness, and comprehensive health management capabilities make it an attractive workplace healthcare solution for employers seeking to improve employee wellness while managing healthcare costs. Its direct access to preventive services, reduced absenteeism benefits, and integrated wellness programming appeal to companies prioritizing employee retention and productivity enhancement through proactive health management.
Growing awareness of corporate wellness ROI, preventive healthcare cost savings, and employee satisfaction benefits is further propelling adoption, especially in manufacturing, technology, and healthcare service sectors. Rising healthcare costs, expanding corporate wellness budgets, and government initiatives supporting workplace health programs are also enhancing market accessibility and employer adoption.
As workforce health priorities accelerate across industries and employee retention becomes critical, the market outlook remains favorable. With employers and healthcare providers prioritizing preventive care delivery, measurable health outcomes, and cost containment benefits, on-site preventive care is well-positioned to expand across various corporate, educational, and government workplace applications.
The market is segmented by service type, management model, and region. By service type, the market is divided into acute care, chronic disease management, wellness and coaching, nutrition management, diagnostic and screening, and others. Based on management model, the market is categorized intoin-house management model, the hybrid management model, and the outsourced management model. Regionally, the market is divided into North America, Latin America, Western Europe, Eastern Europe, South Asia & Pacific, East Asia, and the Middle East & Africa.
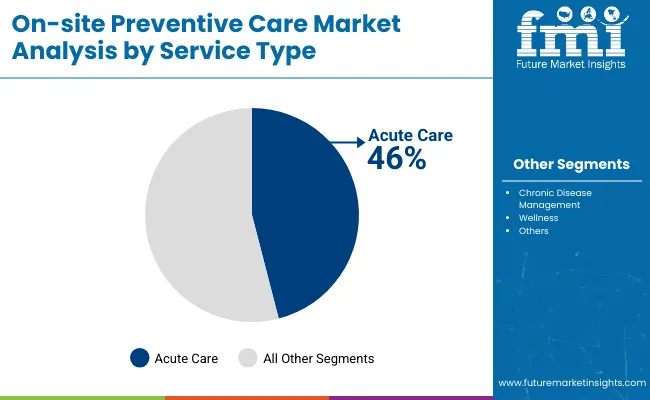
The acute care segment holds a dominant position with 46% of the market share in the service type category, owing to its immediate healthcare response capabilities, comprehensive medical intervention services, and critical role in workplace emergency health management. Acute Care services are widely utilized across corporate and institutional environments due to their ability to provide immediate medical attention, reduce emergency room visits, and deliver cost-effective urgent healthcare solutions directly at the workplace.
It enables employers and healthcare providers to deliver immediate medical intervention while maintaining employee productivity and reducing healthcare-related downtime in workplace settings. As demand for comprehensive, accessible, and immediate healthcare services grows, Acute Care continues to gain preference in both corporate wellness programs and institutional health management applications.
Providers are investing in advanced medical equipment, certified healthcare professionals, and emergency response protocols to enhance service quality, response time, and clinical outcomes. The segment is poised to expand further as workplace safety regulations and employee health expectations favor immediate, professional medical intervention formats.
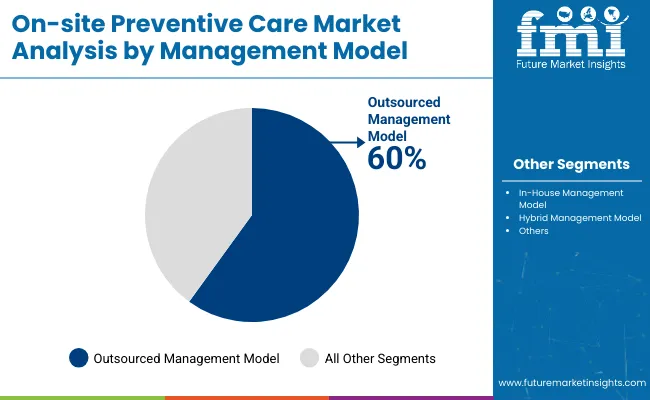
The outsourced management model remains the leading approach, holding 60% of the market share in 2025, as external healthcare providers offer specialized expertise, comprehensive service delivery, and cost-effective healthcare management solutions that enhance workplace health programs while reducing administrative burden on employers. Its operational efficiency supports program scalability in multi-location corporate environments, integrated health service delivery, and professional healthcare management.
Outsourced management model also provides access to specialized medical professionals and advanced healthcare technologies while offering regulatory compliance and quality assurance that internal programs may lack. This makes it indispensable in modern corporate wellness and institutional health environments.
Ongoing demand for specialized healthcare expertise and the cost advantages of external service provision are key trends driving the sustained relevance of outsourced management in this sector.
In 2024, global on-site preventive care adoption grew by 12% year-on-year, with North America taking a 45% regional share. Applications include corporate wellness programs, employee health screenings, and chronic disease management. Providers are introducing specialized service packages and telehealth-integrated platforms that deliver superior health outcomes and workplace productivity benefits. Comprehensive wellness programs now support employee retention strategies. Health-conscious corporate cultures and preventive healthcare preferences support employer confidence. Technology providers increasingly supply ready-to-implement wellness platforms with integrated health monitoring capabilities to reduce program complexity.
Corporate Wellness Investment Accelerates On-site Preventive Care Demand
Employers and healthcare providers are choosing on-site preventive care services to achieve superior employee health outcomes, enhance workplace productivity, and meet corporate demands for cost-effective, accessible healthcare solutions. In workplace health assessments, on-site preventive care programs deliver up to 25% reduction in healthcare costs compared to traditional employee health benefits at 15-20% cost savings.
Programs integrated with on-site care maintain employee satisfaction throughout health management cycles and extended wellness program participation. In ready-to-implement formats, Comprehensive wellness platforms help reduce administrative complexity and improve health outcome quality by up to 40%. On-site preventive care applications are now being deployed for corporate wellness certification, increasing adoption in sectors demanding measurable health ROI. These advantages help explain why on-site preventive care adoption rates in corporate environments rose 28% in 2024 across North America and Europe.
Infrastructure Costs, Regulatory Complexity and Space Requirements Limit Growth
Market expansion faces constraints due to high initial setup costs, specialized healthcare professional requirements, and compliance infrastructure needs. Healthcare facility setup costs can vary from $150,000 to $400,000, depending on service scope and regulatory requirements, impacting program accessibility and leading to implementation delays of up to 12 months in corporate applications. Healthcare professional certification requirements and regulatory compliance standards add 8 to 12 weeks to program development cycles.
Specialized medical equipment and ongoing compliance monitoring extend operational costs by 35-40% compared to traditional employee health programs. Limited availability of certified healthcare professionals restricts scalable implementation, especially for comprehensive medical service projects. These constraints make on-site preventive care adoption challenging in smaller organizations despite growing health benefits and corporate interest.
| Countries | CAGR (2025 to 2035) |
|---|---|
| India | 9.1% |
| China | 8.3% |
| Brazil | 7.6% |
| USA | 7.1% |
| Germany | 6.9% |
| UK | 6.2% |
| France | 5.8% |
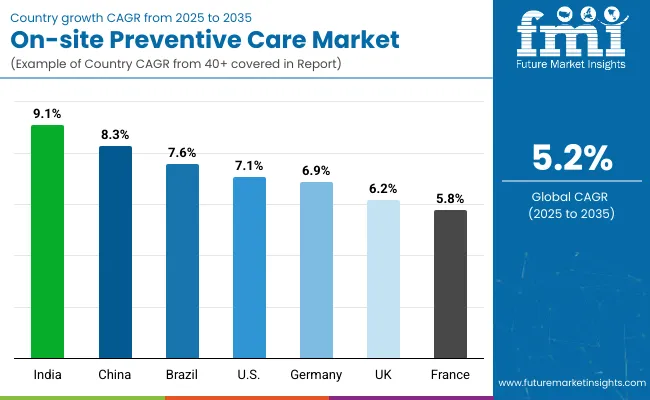
In the on-site preventive care market, India leads with the highest projected CAGR of 9.1% from 2025 to 2035, driven by rapid corporate sector expansion and growing workplace wellness awareness. China follows with a CAGR of 8.3%, supported by government healthcare initiatives and expanding manufacturing sector employee health programs. Brazil shows strong growth at 7.6%, benefiting from corporate wellness investment and healthcare modernization. The USA demonstrates robust growth at 7.1%, supported by an established corporate wellness culture and regulatory support. Germany and the UK show consistent moderate growth at 6.9% and 6.2% respectively, supported by advanced workplace health regulations and corporate wellness adoption. France, with a CAGR of 5.8%, experiences steady expansion supported by European workplace health standards, reflecting regional differences in corporate wellness investment patterns.
The report covers an in-depth analysis of 40+ countries; seven top-performing OECD countries are highlighted below.
Revenue from on-site preventive care in India is projected to grow at a CAGR of 9.1% from 2025 to 2035, significantly exceeding the global average. Growth is fueled by rapid corporate sector expansion, increasing workplace wellness awareness, and growing emphasis on employee health programs across major business centers, including Mumbai, Delhi, and Bangalore. Indian corporations are increasingly embracing workplace health solutions as skilled workforce retention becomes critical and healthcare costs rise.
Revenue from on-site preventive care in China is projected to grow at a CAGR of 8.3% from 2025 to 2035, significantly exceeding the global average by 3.1%. Growth is driven by rapid industrialization, expanding corporate wellness awareness, and government healthcare initiatives across the Beijing, Shanghai, and Shenzhen regions. Chinese corporations are increasingly investing in employee health programs as workforce retention becomes critical in competitive manufacturing and technology sectors. Government support for workplace health standards and corporate wellness tax incentives is accelerating market adoption.
Sales of on-site preventive care in Brazil are slated to flourish at a CAGR of 7.6% from 2025 to 2035, exceeding the global average by 2.4%. Growth has been concentrated in corporate wellness expansion and workplace health program development in São Paulo, Rio de Janeiro, and Brasília regions. On-site preventive care adoption is shifting from limited occupational health services toward comprehensive employee wellness programs and chronic disease management. Local healthcare provider partnerships and competitive service pricing lead commercial deployment strategies.
The on-site preventive care market in the USA is anticipated to expand at a CAGR of 7.1% from 2025 to 2035, exceeding the global rate by 1.9%. Growth is centered on established corporate wellness programs and comprehensive employee health initiatives in California, Texas, and New York regions. Advanced healthcare technologies and regulatory compliance frameworks are being deployed for workplace health management, occupational health services, and employee wellness applications.
The demand for on-site preventive care in Germany is expected to increase at a CAGR of 6.9% from 2025 to 2035, exceeding the global average by 1.7%. Robust workplace health regulations and comprehensive corporate wellness adoption in Berlin, Munich, and Hamburg markets drive demand. Health-conscious employers and advanced manufacturing companies are increasingly adopting on-site preventive care to enhance employee retention and productivity. However, stringent healthcare regulations and high operational costs constrain broader market penetration among smaller enterprises.
The on-site preventive care market in the UK is expected to grow at a CAGR of 6.2% from 2025 to 2035, exceeding the global average by 1.0%. Growth is driven by workplace wellness trends and employee health benefit enhancement in the London, Manchester, and Edinburgh regions. Corporate wellness programs and occupational health services are expanding on-site preventive care accessibility, while employers incorporate it into comprehensive employee benefit packages. Market development focuses on productivity-oriented employers and specialized industry applications, supported by growing awareness of workplace health ROI benefits.
The demand for on-site preventive care in France is projected to expand at a CAGR of 5.8% from 2025 to 2035, slightly above the global average due to established workplace health frameworks and corporate wellness investment. Growth is concentrated in corporate sectors across Paris, Lyon, and Marseille, where employee health benefits and occupational wellness programs are expanding. French labor regulations supporting workplace health initiatives and employer healthcare obligations drive market development, while comprehensive social healthcare systems complement on-site preventive services.
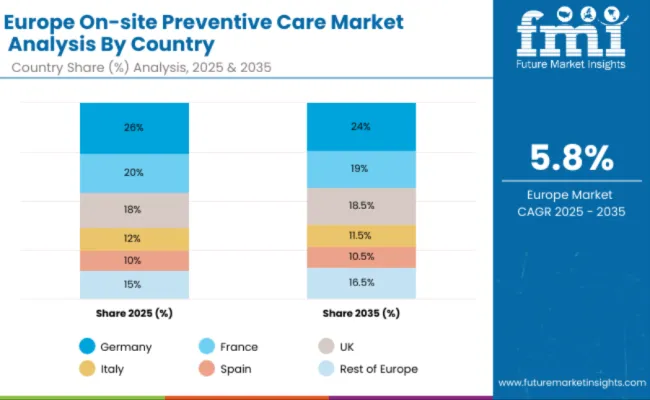
The on-site preventive care market in Europe is projected to grow from USD 7.4 billion in 2025 to USD 13.0 billion by 2035, registering a CAGR of 5.8% over the forecast period. Germany is expected to maintain its leadership position with a 25.0% market share in 2025, declining slightly to 24.0% by 2035, supported by its large manufacturing base, stringent workplace health regulations, and concentration of large employers in industrial hubs including Berlin, Munich, and the Ruhr area.
The United Kingdom follows with a 20.0% share in 2025, projected to reach 19.0% by 2035, driven by demand for hybrid and outsourced delivery models and employer expansion of mental health and telehealth offerings. France holds an 18.0% share in 2025, expected to increase to 18.5% by 2035, supported by scaling corporate wellness programs across large urban centers and adoption of integrated preventive services. Italy commands a 12.0% share in 2025, declining to 11.5% by 2035, while Spain accounts for 10.0% in 2025, expected to reach 10.5% by 2035. The Rest of Europe region, including Nordics, Benelux, and Eastern Europe, is anticipated to gain momentum, expanding its collective share from 15.0% to 16.5% by 2035, attributed to modernization of occupational health services in Nordic countries and rising investment in workplace health across emerging Eastern European markets implementing digital platforms and outsourced clinic models.
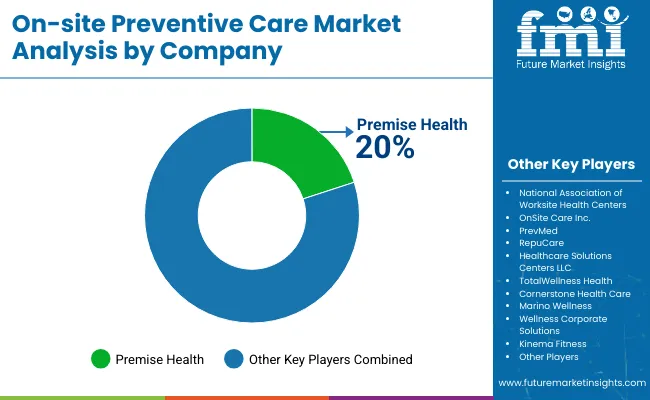
The market is moderately consolidated, featuring a mix of comprehensive healthcare providers, specialized wellness companies, and regional occupational health specialists with varying degrees of service integration, technology capabilities, and corporate partnership expertise. Premise Health leads the market with an estimated 20% market share, supplying comprehensive on-site healthcare services for corporate wellness programs, employee health management, and integrated preventive care applications. Their strength lies in extensive service delivery capabilities, established corporate relationships, and comprehensive healthcare professional networks.
OnSite Care, Inc. and RepuCare differentiate themselves through specialized service delivery, customized wellness program development, and industry-specific solutions for manufacturing, technology, and healthcare sectors. Healthcare Solutions Centers, LLC focuses on scalable service delivery and integrated health management, addressing growing demand from multi-location corporations and institutional clients.
Regional specialists such as PrevMed emphasize technology integration, data analytics capabilities, and measurable health outcome systems, creating value in corporate wellness markets and specialized occupational health applications.
Entry barriers remain significant, driven by challenges in healthcare professional recruitment, regulatory compliance requirements, and substantial initial capital investment across multiple service categories. Competitiveness increasingly depends on service integration capabilities, technology platform development, and demonstrable ROI expertise for diverse corporate and institutional healthcare environments.
| Items | Value |
|---|---|
| Quantitative Units (2025) | USD 27.6 billion |
| Service Type | Acute Care, Chronic Disease Management, Wellness and Coaching, Nutrition Management, Diagnostic and Screening, Others |
| Management Model | In-House Management Model, Hybrid Management Model, Outsourced Management Model |
| Regions Covered | North America, Latin America, Europe, East Asia, South Asia & Pacific, Middle East & Africa |
| Countries Covered | United States, Canada, United Kingdom, Germany, France, China, Japan, South Korea, Brazil, Australia, India and 40+ Countries |
| Key Companies Profiled | Premise Health, National Association of Worksite Health Centers, OnSite Care Inc., PrevMed, RepuCare, Healthcare Solutions Centers LLC, TotalWellness Health, Cornerstone Health Care, Marino Wellness, Wellness Corporate Solutions, Kinema Fitness |
| Additional Attributes | Dollar sales by application and purity grade, regional demand trends, competitive landscape, consumer preferences for natural versus synthetic alternatives, integration with sustainable sourcing practices, innovations in extraction technology and quality standardization for diverse industrial applications |
The global on-site preventive care market is estimated to be valued at USD 27.6 billion in 2025.
The market size for on-site preventive care is projected to reach USD 45.8 billion by 2035.
The on-site preventive care market is expected to grow at a 5.2% CAGR between 2025 and 2035.
The acute care service type is projected to lead in the on-site preventive care market with 46% share in 2025.
The outsourced management model is projected to command 60% share in the on-site preventive care market in 2025.


Full Research Suite comprises of:
Market outlook & trends analysis
Interviews & case studies
Strategic recommendations
Vendor profiles & capabilities analysis
5-year forecasts
8 regions and 60+ country-level data splits
Market segment data splits
12 months of continuous data updates
DELIVERED AS:
PDF EXCEL ONLINE
Preventive Medicine Market Growth - Trends & Forecast 2025 to 2035
CAPA Management (Corrective Action / Preventive Action) Market
Onsite Hydrogen Generator Market Size and Share Forecast Outlook 2025 to 2035
Suncare Products Market Size and Share Forecast Outlook 2025 to 2035
Skincare Supplement Market Size and Share Forecast Outlook 2025 to 2035
Skincare Oil Market Size and Share Forecast Outlook 2025 to 2035
Lip Care Market Analysis - Size and Share Forecast Outlook 2025 to 2035
Skincare Nutritional Serum Market Size and Share Forecast Outlook 2025 to 2035
Haircare Supplement Market - Size, Share, and Forecast Outlook 2025 to 2035
Skincare Products Market Size and Share Forecast Outlook 2025 to 2035
Lip Care Packaging Market Size and Share Forecast Outlook 2025 to 2035
Skincare Market Analysis - Size, Share, and Forecast Outlook 2025 to 2035
Sun Care Products Market Analysis – Growth, Applications & Outlook 2025–2035
Skincare Packaging Market Size, Share & Forecast 2025 to 2035
Pet Care Market Analysis – Demand, Trends & Forecast 2025–2035
Car Care Products Market Trends - Growth, Demand & Analysis 2025 to 2035
Pet Care Packaging Market Insights - Growth & Forecast 2025 to 2035
Eye Care Supplement Analysis by Ingredients, Dosage Form, Route of Administration, Indication, Distribution channel and Region 2025 to 2035
Homecare Medical Devices Market Outlook – Industry Growth & Forecast 2025 to 2035
Skincare Industry in India – Trends & Growth Forecast 2024-2034

Thank you!
You will receive an email from our Business Development Manager. Please be sure to check your SPAM/JUNK folder too.
Chat With
MaRIA