The global backflow preventers market is projected to reach USD 614.1 million by 2035, recording an absolute increase of USD 191.7 million over the forecast period. The market is valued at USD 422.9 million in 2025 and is set to rise at a CAGR of 3.8% during the assessment period. The overall market size is expected to grow by nearly 1.5 times during the same period, supported by increasing demand for water safety systems and regulatory compliance requirements worldwide, driving demand for advanced backflow prevention technologies and increasing investments in infrastructure modernization and water quality protection projects globally. However, high installation costs and technical complexity challenges may pose challenges to market expansion.
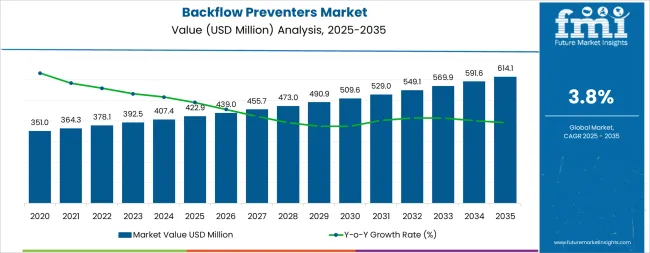
Between 2025 and 2030, the backflow preventers market is projected to expand from USD 422.9 million to USD 512.8 million, resulting in a value increase of USD 89.9 million, which represents 46.9% of the total forecast growth for the decade. This phase of development will be shaped by rising demand for water safety systems and infrastructure modernization, product innovation in IoT-enabled monitoring technologies and smart valve systems, as well as expanding integration with municipal water management and regulatory compliance initiatives. Companies are establishing competitive positions through investment in advanced prevention technologies, corrosion-resistant materials, and strategic market expansion across residential, commercial, and municipal applications.
From 2030 to 2035, the market is forecast to grow from USD 512.8 million to USD 614.1 million, adding another USD 101.8 million, which constitutes 53.1% of the overall ten-year expansion. This period is expected to be characterized by the expansion of specialized prevention systems, including advanced smart monitoring formulations and integrated water safety solutions tailored for specific application requirements, strategic collaborations between equipment manufacturers and water utility industries, and an enhanced focus on operational efficiency and regulatory compliance. The growing emphasis on water quality optimization and advanced prevention processes will drive demand for comprehensive, high-performance backflow prevention solutions across diverse infrastructure applications.
| Metric | Value |
|---|---|
| Market Value (2025) | USD 422.9 million |
| Market Forecast Value (2035) | USD 614.1 million |
| Forecast CAGR (2025-2035) | 3.8% |
The backflow preventers market grows by enabling water utilities and facility operators to achieve superior water safety and contamination prevention across water distribution systems, ranging from small-scale residential installations to mega municipal water complexes. Water system operators face mounting pressure to improve water quality and regulatory compliance, with backflow prevention systems typically providing 85-95% improvement in contamination risk reduction compared to unprotected systems, making advanced prevention technologies essential for safe water operations. The municipal water industry's need for maximum contamination protection creates demand for advanced prevention solutions that can minimize backflow risks, enhance system reliability, and ensure consistent performance across diverse operational conditions. Government initiatives promoting water safety and public health protection drive adoption in municipal, commercial, and residential applications, where water quality has a direct impact on public health and regulatory compliance. High installation costs and the complexity of achieving consistent performance across different water pressure conditions may limit adoption rates among cost-sensitive operators and developing regions with limited infrastructure budgets.
The market is segmented by product type, material type, application, and region. By product type, the market is divided into atmospheric vacuum breaker, pressure vacuum breaker, double check valve assembly, and reduced pressure zone. Based on material type, the market is categorized into stainless steel, plastic, ductile iron, bronze, and other materials. By application, the market is segmented into residential, commercial, industrial, and municipal water systems. Regionally, the market is divided into North America, Latin America, Western Europe, Eastern Europe, East Asia, South Asia, and Middle East & Africa.
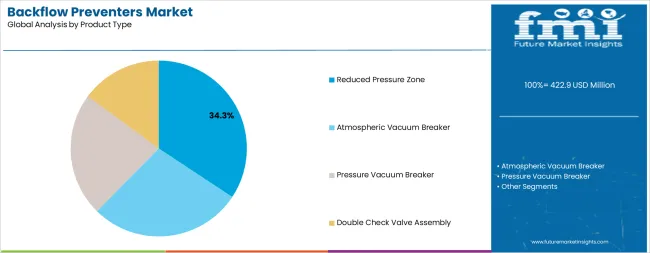
The Reduced Pressure Zone (RPZ) segment represents the dominant force in the backflow preventers market, capturing approximately 34.3% of total market share in 2025. This advanced prevention category encompasses formulations featuring superior contamination protection characteristics, including enhanced safety reliability and optimized performance combinations that enable superior backflow prevention and enhanced water quality characteristics. The RPZ segment's market leadership stems from its exceptional performance capabilities in high-risk contamination environments, with systems capable of handling severe hazard conditions while maintaining consistent performance and safety reliability across diverse water system operations.
The double check valve assembly segment maintains a substantial market share, serving operators who require cost-effective prevention solutions for standard protection applications. These systems offer reliable performance for general-purpose water safety applications while providing sufficient protection to meet basic safety requirements in residential and commercial applications.
Key technological advantages driving the RPZ segment include:
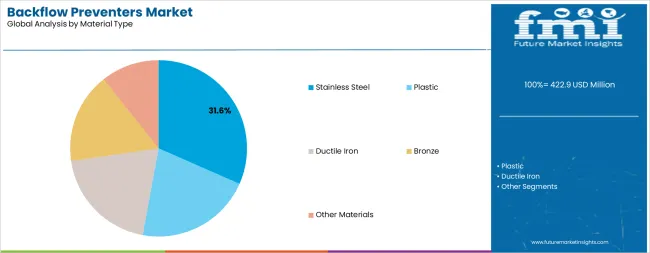
Stainless Steel applications dominate the backflow preventers market with approximately 31.6% market share in 2025, reflecting the critical role of corrosion resistance in serving water safety demand and supporting long-term durability initiatives. The stainless steel segment's market leadership is reinforced by increasing durability requirements, corrosion resistance needs, and rising demand for cost-effective maintenance optimization that directly correlates with operational flexibility and system longevity.
The bronze segment represents the second-largest material category, capturing significant market share through specialized requirements for traditional plumbing systems, heritage building applications, and high-durability installations. This segment benefits from growing demand for traditional material systems that meet specific aesthetic, compatibility, and performance requirements in demanding water applications.
The plastic segment accounts for substantial market share, serving applications requiring lightweight and cost-effective solutions. The ductile iron segment captures market share through heavy-duty applications, while other material ranges represent specialized market segments.
Key market dynamics supporting material growth include:
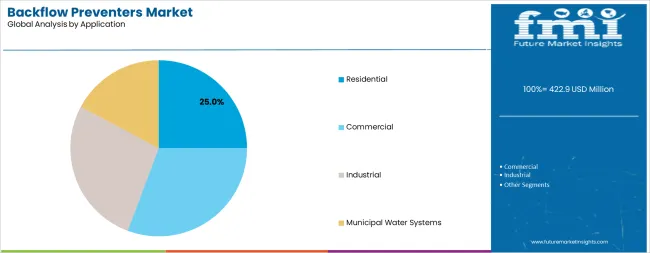
Residential applications represent a dominant portion of the backflow preventers market, reflecting the critical role of safeguarding household water systems and supporting regulatory compliance initiatives. The residential segment's market position is reinforced by increasing awareness of water contamination risks, urban housing growth, and adoption of modern plumbing standards, capturing an estimated 25% market share globally.
The commercial segment maintains substantial market share, serving businesses that require reliable prevention solutions for building water systems. This segment benefits from growing demand for commercial building safety systems that meet specific performance, reliability, and compliance requirements across diverse commercial applications.
The industrial segment accounts for specialized market share, serving facilities that require high-performance prevention systems for process water protection. The municipal water systems segment represents a smaller but critical portion of the market, ensuring safe drinking water in urban areas and supporting regulatory compliance initiatives.
Key market dynamics supporting application growth include:
The market is driven by three concrete demand factors tied to water safety and operational optimization outcomes. First, global water safety regulation growth and infrastructure modernization create increasing demand for high-performance prevention solutions, with water contamination incidents projected to drive stricter requirements, requiring specialized prevention technologies for maximum safety protection. Second, modernization of aging water infrastructure and regulatory compliance drive the adoption of superior prevention technologies, with operators seeking 85-95% improvement in contamination risk reduction and regulatory compliance enhancement. Third, technological advancements in IoT monitoring and smart valve technologies enable more effective and intelligent prevention systems that reduce operational risks while improving long-term performance and cost-effectiveness.
Market restraints include high installation costs that can impact system adoption and profitability margins, particularly during periods of budget constraints or infrastructure investment limitations affecting key municipal and commercial sectors. Technical complexity in system integration poses another significant challenge, as achieving consistent performance standards across different water pressure conditions and regulatory frameworks requires specialized expertise and quality control systems, potentially causing project delays and increased implementation costs. Skills shortage in system maintenance and operation creates additional challenges for operators, demanding ongoing investment in training capabilities and compliance with varying water safety standards.
Key trends indicate accelerated adoption in emerging markets, particularly ASEAN countries, India, and Latin America, where rapid urbanization and water infrastructure development drive comprehensive backflow prevention system development. Technology advancement trends toward smart integration with enhanced IoT monitoring, real-time pressure tracking, and multi-functional system capabilities enable next-generation product development that addresses multiple safety requirements simultaneously. However, the market thesis could face disruption if alternative water protection technologies or significant changes in water distribution practices minimize reliance on traditional backflow prevention approaches.
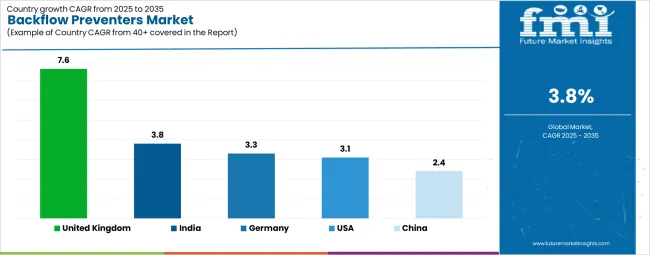
| Country | CAGR (2025-2035) |
|---|---|
| India | 3.8% |
| United Kingdom | 7.6% |
| Germany | 3.3% |
| United States | 3.1% |
| China | 2.4% |
The backflow preventers market is gaining momentum worldwide, with India taking the lead thanks to massive urbanization, industrial expansion, and government-backed infrastructure modernization programs, supported by a projected CAGR of 3.8% from 2025 to 2035. Close behind, United Kingdom benefits from growing water safety regulations and advanced infrastructure upgrade initiatives, with a CAGR of 7.6%, positioning itself as a strategic growth hub in the European region. Germany shows steady advancement, where integration of advanced prevention technologies strengthens its role in the European water safety supply chain, with a CAGR of 3.3%. United States is focusing on infrastructure renewal and regulatory compliance development, signalling an ambition to capitalize on growing opportunities in North American municipal markets, with a CAGR of 3.1%. China stands out for its advanced infrastructure technology development in existing water system applications, recording consistent progress in water safety advancement, with a CAGR of 2.4%. Together, India and United Kingdom anchor the global expansion story, while the rest build stability and diversity into the market's growth path.
The report covers an in-depth analysis of 40+ countries top-performing countries are highlighted below.
India demonstrates strong growth potential in the backflow preventers market with a CAGR of 3.8% from 2025 to 2035. The country’s growth is driven by massive urbanization projects, industrial expansion, government-backed infrastructure modernization programs, and increasing focus on water safety regulations, fueling the adoption of high-performance prevention systems. Growth is concentrated in major urban regions, including Mumbai, Delhi, Bengaluru, and Hyderabad, where municipal authorities, industrial facilities, and commercial developers are implementing advanced prevention solutions for enhanced water safety performance and regulatory compliance. Distribution channels through established water equipment suppliers and direct manufacturer relationships support wider deployment across municipal facilities, industrial plants, and commercial building centers. India’s infrastructure development strategy provides policy and regulatory support for advanced prevention technologies, encouraging the adoption of high-performance systems.
Key market factors:
In London, Manchester, Birmingham, and Glasgow, the adoption of backflow prevention systems is accelerating across municipal facilities and commercial building centers, driven by water safety targets and government infrastructure modernization initiatives. The market demonstrates strong growth momentum with a CAGR of 7.6% through 2035, linked to comprehensive infrastructure capacity expansion and increasing focus on water safety solutions. British utilities are implementing advanced prevention systems and monitoring platforms to enhance water quality while meeting growing demand for safe water in domestic and commercial markets. The country's infrastructure development programs create continued demand for high-performance prevention solutions, while increasing emphasis on local manufacturing drives adoption of advanced technologies and safety systems.
Advanced water infrastructure in Germany demonstrates sophisticated implementation of backflow prevention systems, with documented case studies showing safety improvements in municipal applications through optimized prevention solutions. The country's water infrastructure in major urban centers, including Berlin, Munich, Hamburg, and Frankfurt, showcases integration of advanced prevention technologies with existing water systems, leveraging expertise in water management and precision engineering. German utilities emphasize quality standards and regulatory compliance, creating demand for high-performance prevention solutions that support safety initiatives and regulatory requirements. The market maintains steady growth through focus on infrastructure innovation and water safety competitiveness, with a CAGR of 3.3% through 2035.
Key development areas:
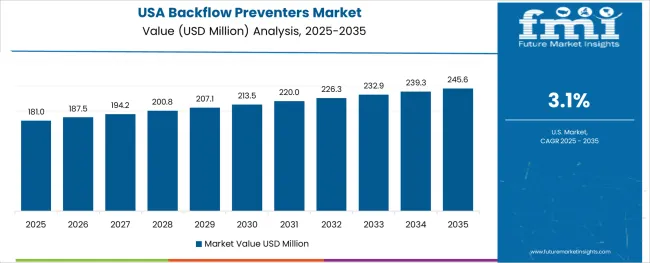
The expansion of the market in united states is driven by diverse infrastructure demand, including municipal water systems in California and Florida regions, commercial building development in Texas and New York, and comprehensive infrastructure modernization across multiple metropolitan areas. The country demonstrates promising growth potential with a CAGR of 3.1% through 2035, supported by national infrastructure programs and regional safety development initiatives. American utilities face implementation challenges related to aging infrastructure and regulatory compliance requirements, requiring prevention system upgrade approaches and federal partnership support. However, growing infrastructure targets and water safety competitiveness requirements create compelling business cases for backflow prevention system adoption, particularly in municipal regions where safety performance has a direct impact on public health protection.
Market characteristics:
The market in China leads in advanced infrastructure innovation based on integration with next-generation water technologies and sophisticated prevention applications for enhanced safety characteristics. The country shows solid potential with a CAGR of 2.4% through 2035, driven by infrastructure modernization programs and advanced water management initiatives across major urban regions, including Beijing, Shanghai, Guangzhou, and Shenzhen. Chinese utilities are adopting advanced prevention systems for water safety optimization and regulatory compliance, particularly in regions with environmental mandates and advanced processing facilities requiring superior safety differentiation. Technology deployment channels through established water distributors and direct manufacturer relationships expand coverage across municipal facilities and commercial water operations.
Leading market segments:

The backflow preventers market in Europe is projected to grow from USD 98.4 million in 2025 to USD 138.7 million by 2035, registering a CAGR of 3.5% over the forecast period. Germany is expected to maintain its leadership position with a 24.6% market share in 2025, declining slightly to 24.2% by 2035, supported by its extensive water infrastructure and major municipal centers, including Bavaria, North Rhine-Westphalia, and Baden-Württemberg water facilities.
United Kingdom follows with a 23.8% share in 2025, projected to reach 24.2% by 2035, driven by comprehensive infrastructure development programs and advanced water safety initiatives implementing prevention technologies. France holds a 18.4% share in 2025, expected to maintain 18.0% by 2035 through ongoing municipal facility upgrades and water technology development. Italy commands a 15.7% share, while Netherlands accounts for 11.2% in 2025. The Rest of Europe region is anticipated to gain momentum, expanding its collective share from 6.3% to 7.4% by 2035, attributed to increasing backflow prevention system adoption in Nordic countries and emerging Eastern European water facilities implementing advanced safety programs.
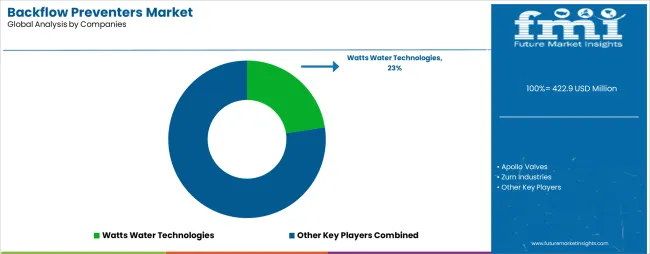
The backflow preventers market features approximately 15-20 meaningful players with moderate concentration, where the top three companies control roughly 20-27% of global market share through established technology platforms and extensive water infrastructure relationships. Competition centers on product reliability, regulatory compliance, and technical innovation rather than price competition alone.
Market leaders include Apollo Valves, Watts Water Technologies, and Zurn Industries, which maintain competitive advantages through comprehensive water safety solution portfolios, global manufacturing networks, and deep expertise in the water infrastructure and municipal systems sectors, creating high switching costs for customers. These companies leverage research and development capabilities and ongoing technical support relationships to defend market positions while expanding into adjacent commercial and residential applications.
Challengers encompass Honeywell International and Schneider Electric, which compete through specialized prevention solutions and strong regional presence in key infrastructure markets. Technology specialists, including Mueller Water Products, Brady Corporation, and Spirax Sarco Engineering, focus on specific valve configurations or vertical applications, offering differentiated capabilities in materials technology, customization services, and specialized performance characteristics.
Regional players and emerging water technology providers create competitive pressure through cost-effective solutions and rapid customization capabilities, particularly in high-growth markets including ASEAN, India, and Latin America, where local presence provides advantages in customer service and regulatory compliance. Market dynamics favor companies that combine advanced prevention technologies with comprehensive technical support offerings that address the complete system lifecycle from design development through ongoing operational optimization.
Backflow preventers represent specialized water safety systems that enable operators to achieve 85-95% improvement in contamination risk reduction compared to unprotected systems, delivering superior water quality protection and safety assurance with enhanced compliance capabilities in demanding water infrastructure applications. With the market projected to grow from USD 422.9 million in 2025 to USD 614.1 million by 2035 at a 3.8% CAGR, these prevention systems offer compelling advantages - enhanced water safety, customizable prevention configurations, and operational durability - making them essential for municipal applications, commercial buildings, and residential facilities seeking alternatives to unprotected water systems that compromise safety through contamination risks. Scaling market adoption and technological advancement requires coordinated action across water safety policy, infrastructure standards development, equipment manufacturers, water utilities, and prevention system investment capital.
How Governments Could Spur Local Production and Adoption?
How Industry Bodies Could Support Market Development?
How OEMs and Technology Players Could Strengthen the Ecosystem?
How Suppliers Could Navigate the Shift?
How Investors and Financial Enablers Could Unlock Value?
| Items | Values |
|---|---|
| Quantitative Units | USD 422.9 million |
| Product Type | Atmospheric Vacuum Breaker, Pressure Vacuum Breaker, Double Check Valve Assembly, Reduced Pressure Zone |
| Material Type | Stainless Steel, Plastic, Ductile Iron, Bronze, Other Materials |
| Application | Residential, Commercial, Industrial, Municipal Water Systems |
| Regions Covered | North America, Latin America, Western Europe, Eastern Europe, East Asia, South Asia, Middle East & Africa |
| Country Covered | ASEAN, United Kingdom, Germany, United States, China, and 40+ countries |
| Key Companies Profiled | Apollo Valves, Watts Water Technologies, Zurn Industries, Honeywell International, Schneider Electric, Mueller Water Products, Brady Corporation, Spirax Sarco Engineering |
| Additional Attributes | Dollar sales by product type and material type categories, regional adoption trends across East Asia, South Asia, and Western Europe, competitive landscape with prevention system providers and technology integrators, water facility requirements and specifications, integration with municipal initiatives and water systems, innovations in prevention technology and safety systems, and development of specialized configurations with performance and durability capabilities. |
The global backflow preventers market is estimated to be valued at USD 422.9 million in 2025.
The market size for the backflow preventers market is projected to reach USD 614.1 million by 2035.
The backflow preventers market is expected to grow at a 3.8% CAGR between 2025 and 2035.
The key product types in backflow preventers market are reduced pressure zone, atmospheric vacuum breaker, pressure vacuum breaker and double check valve assembly.
In terms of material type, stainless steel segment to command 31.6% share in the backflow preventers market in 2025.


Full Research Suite comprises of:
Market outlook & trends analysis
Interviews & case studies
Strategic recommendations
Vendor profiles & capabilities analysis
5-year forecasts
8 regions and 60+ country-level data splits
Market segment data splits
12 months of continuous data updates
DELIVERED AS:
PDF EXCEL ONLINE
Competitive Overview of Backflow Preventers Companies
North America Backflow Preventer Market - Growth & Demand 2025 to 2035
Blowout Preventers Market

Thank you!
You will receive an email from our Business Development Manager. Please be sure to check your SPAM/JUNK folder too.
Chat With
MaRIA