Considering the crucial role that power meters have in improving performance for cycling enthusiasts, professional and competitive cyclists, and a slight but steady growth in sales of power meters is forecast during the latter part of the coming decade driving the global cycling power meter market. Cycling power meters devices that measure a cyclist's power in watts are invaluable tools for monitoring training, gauging workout intensity, and increasing efficiency.
The increasing popularity of cycling, not only as a sport but also as a form of fitness and a greener mode of transportation, has created a need for accurate, robust, easy-to-use power meters. In addition, continues to drive product innovation through advances in connectivity, data integration and lightweight designs.
With an increasing number of cyclists embracing these devices to enhance experience and manufacturers able to provide more economical and versatile options, the trend is projected continue growing for the market through 2035.
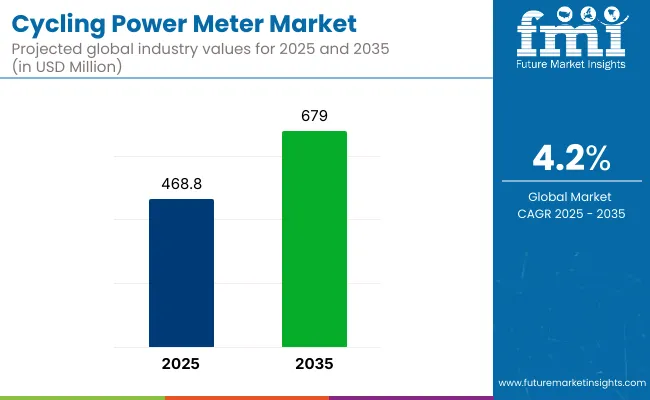
Field: Cycle power meter market worth approximately USD 468.8 Million by 2025. And is expected to reach USD 679.0 Million by 2035, growing at a CAGR of 4.2% during the forecast period. The surge comes on the back of more amateurs and pros using them, more power meter technology development and the emergence of connected data-centred exercise kit.

Key Market Metrics
| Metric | Value |
|---|---|
| Market Size in 2025 | USD 468.8 Million |
| Projected Market Size in 2035 | USD 679.0 Million |
| CAGR (2025 to 2035) | 4.2% |
The cycling power meters market in North America is expected to hold a significant market share during the forecast period owing to established cycling community, high participation in competitive events and increased focus on fitness technologies. Power meters have had thriving markets in the United States and Canada, especially over the past decade with serious riding enthusiasts and athletes wanting accurate, real-time stats on their training efforts.
Another key market is Europe, which has a strong cycling culture, a number of professional races, and an emphasis on technology innovations. Germany, France and the Netherlands are among the leading countries in terms of riding with power meters, spurred on by the region’s high level of cycling participation and the proliferation of amateur and semi-professional races. Europe’s leading cycling infrastructure and commitment to sustainable mobility also underpin continued growth in this market.
The Asia-Pacific region is a fast-growing market for cycling power meters due to rising disposable income, increasing affinity for cycling as a sport and leisure activity, and growing awareness of one fitness technologies. In places like China, Japan, and Australia, cycling fanatics are shelling out for performance-based tracking devices. An increase in cycling events across the region along with a growing acceptance of cycling as a mainstream sport are some of the trends contributing toward strong market growth.
Challenges
High Costs, Accuracy Variability, and Compatibility Issues
The most challenging aspects of the cycling power meter market stem from high costs associated with precision sensor technology, wireless connectivity, and real-time data processing. Power meters, measuring output by cyclists in watts, need sophisticated strain gauge technology, making them costly for recreational cyclists.
Moreover, power meter type-specific differences in accuracy (e.g. pedal vs crank vs hub based) lead to inconsistencies in data reliability and thus performance analysis. Wiring for electronic drivetrains must also be compatible, as various designs will involve slightly different plug-n-play pedal systems, wireless protocols (ANT+, Bluetooth) which makes interchangeability between brands and models much more limited than one would expect.
Opportunities
Growth in Smart Fitness, Connected Devices, and AI-Driven Training Systems
Despite these challenges, the cycling power meter market is witnessing significant growth, owing to the increasing demand for smart cycling analytics, fitness tracking, AI-driven training systems, and other emerging technologies that are redefining the sport. Rising adoption of connected cycling devices such as mobile coaching apps, smart trainers, and wearable fitness trackers, is increasing the demand for real-time performance monitoring.
Meanwhile, advances in miniaturized sensors, AI-based power analytics, and cloud-enabled cycling dashboards are paving the way for cheaper, more accurate and user-friendly power meters. The growing trend of e-sports cycling (indoor training platforms, professional racing analytics also speeding up the adoption of the market.
| Market Shift | 2020 to 2024 Trends |
|---|---|
| Regulatory Landscape | Compliance with wireless transmission standards (ANT+, Bluetooth) and sensor calibration guidelines. |
| Consumer Trends | Demand for real-time cycling data, performance optimization, and connected training solutions. |
| Industry Adoption | High use in professional cycling, endurance training, and competitive racing. |
| Supply Chain and Sourcing | Dependence on strain gauge technology, wireless communication chips, and lightweight materials. |
| Market Competition | Dominated by high-performance cycling brands and premium fitness technology companies. |
| Market Growth Drivers | Growth fueled by rising interest in cycling analytics, competitive endurance training, and smart fitness tracking. |
| Sustainability and Environmental Impact | Moderate adoption of low-energy Bluetooth and long-lasting rechargeable batteries. |
| Integration of Smart Technologies | Early adoption of wireless connectivity, cloud-based analytics, and mobile training apps. |
| Advancements in Sensor Technology | Development of multi-point power sensing with improved torque and cadence analysis. |
| Market Shift | 2025 to 2035 Projections |
|---|---|
| Regulatory Landscape | Stricter industry certification for accuracy, smart device interoperability, and standardized cycling metrics. |
| Consumer Trends | Growth in AI-powered coaching, integrated biomechanics tracking, and precision endurance training analytics. |
| Industry Adoption | Expansion into mainstream fitness, AI-driven cycling recommendations, and personalized training platforms. |
| Supply Chain and Sourcing | Shift toward nano-sensor development, AI-enhanced calibration, and self-learning power tracking systems. |
| Market Competition | Entry of smart fitness startups, AI-driven cycling analytics firms, and modular power meter innovators. |
| Market Growth Drivers | Accelerated by AI-based power optimization, immersive virtual cycling simulations, and next-gen smart sensor integration. |
| Sustainability and Environmental Impact | Large-scale shift toward solar-powered power meters, ultra-efficient energy harvesting sensors, and carbon-neutral materials. |
| Integration of Smart Technologies | Expansion into AI-driven predictive performance insights, biometric tracking integration, and voice-assisted cycling coaching. |
| Advancements in Sensor Technology | Evolution toward real-time AI-assisted power monitoring, muscle fatigue prediction, and adaptive training algorithms. |

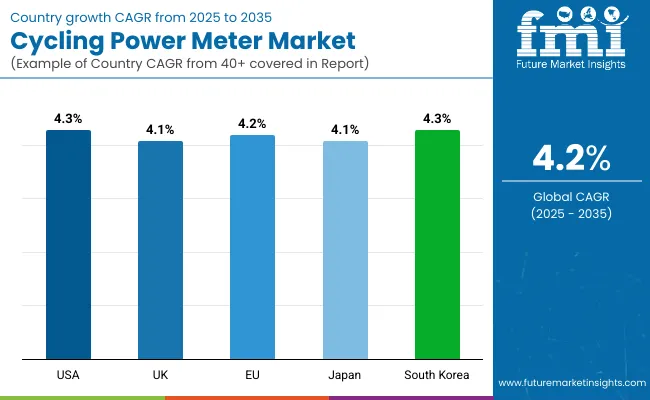
Cycling power meter market growth in focus in the USA. Market growth is driven by the increasing demand for intelligent, Bluetooth-enabled, and app-integrated power meters. The sudden boom of the recently growing endurance cycling events alongside the rise of e-bikes is another major reason to keep advanced cycling performance measurement tools in demand.
| Country | CAGR (2025 to 2035) |
|---|---|
| USA | 4.3% |
The cycling power meter market in the United Kingdom is growing, with more consumers investing in high-performance cycling equipment for both training and competitive racing.
Growing awareness of cycling as an environmentally friendly means of transportation, as well as development of innovative lightweight and wireless power meters are some additional factors boosting the growth in this market. Moreover, sales are also gaining from the popularity of indoor cycling training programs.
| Country | CAGR (2025 to 2035) |
|---|---|
| UK | 4.1% |
Across the European Union, the Cycling Power Meter market is growing steadily due to the rising number of cycling enthusiasts, professional athletes, and fitness-conscious individuals. The demand for accurate and real-time cycling performance data is increasing, leading to greater adoption of high-tech power meters. Additionally, the presence of leading cycling brands and strong investments in cycling infrastructure are supporting market expansion.
| Country | CAGR (2025 to 2035) |
|---|---|
| European Union (EU) | 4.2% |
Japan Cycling Power Meter Market is growing at moderate pace, supported by the growing use of advanced cycling technologies among both professional and recreational cyclists. Such factors such as the focus on technological innovation in the country and lightweight, durable power meters contribute to market growth. Furthermore, the demand is boosted by the increasing popularity of competitive cycling events and fitness-oriented people.
| Country | CAGR (2025 to 2035) |
|---|---|
| Japan | 4.1% |
Cycling power meter market in South Korea is the increasing popularity of cycling as a form of exercise and competitive sport. Market growth increasing adoption of smart wearables and GPS-enabled cycling power meters Moreover, government initiatives supporting cycling as an environmentally friendly means of transportation are further driving the demand for the industry's products.
| Country | CAGR (2025 to 2035) |
|---|---|
| South Korea | 4.3% |
The cycling power meter market has grown in popularity with professional cyclists, fitness enthusiasts, and endurance riders looking to enhance their performance with accurate power measurement tools. Power meters deliver real-time information on wattage, cadence and torque, allowing riders to increase training efficiency, measure progress and refine biomechanics.
So, the combination of analytics, on-device processing, and connectivity is just driving demand for more sophisticated cycling power meters. Segmented by Mounting Type (Crank Arm-Based, Pedal-Based, Chaining-Based, Hub-Based) and Application (Sport Bicycle, Mountain Bicycle, Road Bicycle).
The segment of the cycling power meter market with the largest share is pedal-based power meters, as pedal-based power meters are the most accurate and the closest to where the power generation takes place i.e. at the pedals. Pedal-based power meters are used frequently in competitive cycling, triathlons, and endurance training, as cyclists focus on left-right balance monitoring, optimizing cadence, and strategically analyzing power zone output.
Pedal-based power meters are increasingly being adopted by professionals and high-performance cyclists, which is accelerating innovation in wireless connectivity, cloud integration, and AI-enabled training analytics. These power meters are easy to install, transferable between bikes, and compatible with cycling computers and smart training apps, making them a perfect choice for data-driven cyclists.
Crank arm-based power meters enjoy a large market share as many amateur racers, fitness riders, and budget-inclined cyclists favor them. Crank arm-based power meters estimate the torque applied to the crank, and offer a reliable and low-cost power estimate. These meters are usually lightweight and durable, making them compatible with a variety of bicycles, which is why they are a popular choice for casual riders and those wanting a mid-range solution for measuring power.
Road bicycles are the leading segment in cycling power meter market, where professional racers and long-distance cyclists demand accurate wattage measurement, wind resistivity, and performance analysis for their rides. Road bike power meters are designed to help riders improve their pedaling efficiency, gauge how well they're climbing and amend the intensity of your training, they're an indispensable element of race competition and long-distance riding.
As the popularity of professional cycling events, endurance rides, and smart training programs grows, operators are becoming more demanding for aerodynamically optimal and lightweight power meters. Manufacturers are investing heavily in taking rider performance to another level with AI based cycling analysis, power zone training and real-time cadence tracking.
The mountain bicycle industry is also seeing robust growth as off-road cyclists demand durable, shock-resistant power meters to endure harsh terrain, variants in torque load, and inclement weather. Mountain biking is at home with power meters designed for the specific goals, disciplines, and environments which deliver care in tough scenarios, lending themselves to cross-country races, long-endurance mountain biking, off-road cycling tours, and adventure riding.
As mountain biking competitions, adventure tourism, and high-performing cycling gear continue to increase in popularity, manufacturers are also making more rugged, impermeable, and impact-resistant powered meters to cater to those hitting the rugged trails.
The growing demand for cycle power meters among professional cyclists, fitness enthusiasts, sports analytics, etc. is driving the growth of the cycle power meters market.
With recent trends for companies to focus on venture-based AI-driven analysis on power output, Bluetooth and ANT+ connectivity as well as light-weight sensor integration, the cycling performance analysis, real-time data analytics, and enhanced training efficiency become a mega-example on this area with some major industry brands already engaged in this area.
Cycling accessory companies, fitness equipment brands, and sports technology companies are also part of the market, initiating and integrating technological features like pedal-based, crank-based, and hub-based power meters, AI-based cycling analytics, and device connectivity solutions.
Market Share Analysis by Key Players & Cycling Power Meter Manufacturers
| Company Name | Estimated Market Share (%) |
|---|---|
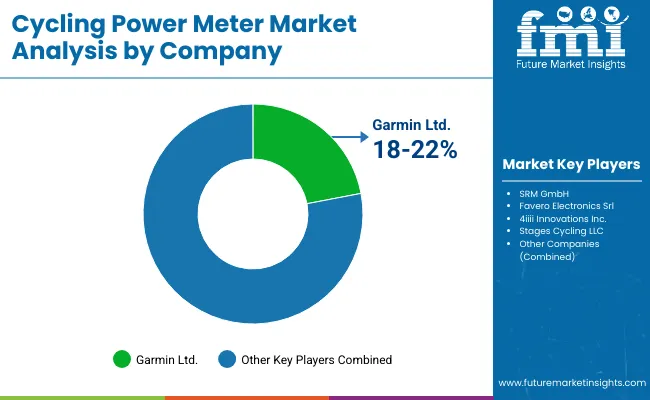
| Garmin Ltd. | 18-22% |
| SRM GmbH | 12-16% |
| Favero Electronics Srl | 10-14% |
| 4iiii Innovations Inc. | 8-12% |
| Stages Cycling LLC | 5-9% |
| Other Cycling Tech Providers (combined) | 30-40% |
| Company Name | Key Offerings/Activities |
|---|---|
| Garmin Ltd. | Develops AI-optimized pedal-based power meters, real-time cycling analytics, and ANT+ & Bluetooth-compatible performance tracking solutions. |
| SRM GmbH | Specializes in crank-based power meter systems, AI-powered precision calibration, and professional cycling training data analysis. |
| Favero Electronics Srl | Provides advanced pedal power meters with AI-assisted torque analysis and high-accuracy wattage measurement for cyclists. |
| 4iiii Innovations Inc. | Focuses on lightweight crank-arm power meters, AI-enhanced pedal stroke optimization, and cloud-based cycling performance tracking. |
| Stages Cycling LLC | Offers dual-sided power meters, AI-powered ride efficiency analytics, and integrated cycling training solutions for athletes. |
Key Market Insights

Garmin Ltd. (18-22%)
With AI-powered cycling performance optimization, integrated GPS tracking, and real-time connectivity solutions, Garmin leads the cycling power meter market with its pedal-based power meters.
SRM GmbH (12-16%)
SRM builds pro- level, crank- based power meters with AItuned, extreme level data accuracy in both high wattage tracking, and highly sophisticated analyses of that data for elite bike training.
Favero Electronics Srl (10-14%)
With pedal-design integrated power meters, favero optimize their AI powered torque efficiency, provide lightweight pedal construction and hundreds of device compatibility.
4iiii Innovations Inc. (8-12%)
4iiii specializes in inexpensive crank-based power meters but also offers Bluetooth-enabled performance tracking and AI-assisted pedal stroke analysis.
Stages Cycling LLC (5-9%)
Stages is a manufacturer of single and dual sided power meters, for real time ride efficiency output analysis and for optimization of cycling endurance, augmented via AI tooling.
Other Key Players (30-40% Combined)
Several sports technology brands, fitness data analytics companies, and cycling performance equipment providers contribute to next-generation cycling power meter innovations, AI-powered wattage analysis, and real-time performance tracking advancements. These include:
The overall market size for cycling power meter market was USD 468.8 Million in 2025.
Cycling power meter market is expected to reach USD 679.0 Million in 2035.
The demand for cycling power meters is expected to rise due to increasing consumer interest in performance tracking, growing adoption of cycling as a fitness and competitive sport, and advancements in smart and wireless power meter technologies.
The top 5 countries which drives the development of cycling power meter market are USA, UK, Europe Union, Japan and South Korea.
Pedal-Based and Crank Arm-Based Power Meters to command significant share over the assessment period.


Full Research Suite comprises of:
Market outlook & trends analysis
Interviews & case studies
Strategic recommendations
Vendor profiles & capabilities analysis
5-year forecasts
8 regions and 60+ country-level data splits
Market segment data splits
12 months of continuous data updates
DELIVERED AS:
PDF EXCEL ONLINE
Recycling Trucks Market Size and Share Forecast Outlook 2025 to 2035
Recycling Equipment And Machinery Market Size and Share Forecast Outlook 2025 to 2035
Wood Recycling Equipment Market Size and Share Forecast Outlook 2025 to 2035
Metal Recycling Market Size and Share Forecast Outlook 2025 to 2035
Paper Recycling Market Size and Share Forecast Outlook 2025 to 2035
Metal Recycling Equipment Market Analysis - Size, Share, and Forecast Outlook 2025 to 2035
Waste Recycling Services Market by Application, Product Type, and Region - Growth, Trends, and Forecast 2025 to 2035
Solvent Recycling & Recovery Equipment Market Size and Share Forecast Outlook 2025 to 2035
On-Pack Recycling Labelling Solutions Market Size and Share Forecast Outlook 2025 to 2035
Textile Recycling Market Analysis by Material, Source, Process, and Region: Forecast for 2025 and 2035
Plastic Recycling Market
Chemical Recycling Service Market Forecast Outlook 2025 to 2035
Solar PV Recycling Market Size and Share Forecast Outlook 2025 to 2035
Clothing Recycling Market Analysis – Growth & Trends 2025 to 2035
Waste Wood Recycling Market Size and Share Forecast Outlook 2025 to 2035
EV Battery Recycling and Black Mass Processing Market Analysis - Size, Share, and Forecast Outlook 2025 to 2035
Commercial Recycling Bins Market Size and Share Forecast Outlook 2025 to 2035
Solar Panel Recycling Management Market Size and Share Forecast Outlook 2025 to 2035
Solar Module Recycling Service Market Size and Share Forecast Outlook 2025 to 2035
Textile Waste Recycling Machine Market Size and Share Forecast Outlook 2025 to 2035

Thank you!
You will receive an email from our Business Development Manager. Please be sure to check your SPAM/JUNK folder too.
Chat With
MaRIA