Textile Recycling Market Outlook from 2025 to 2035

The global textile recycling market is projected to grow from approximately USD 5.1 billion in 2025 to USD 7.0 billion by 2035, reflecting a compound annual growth rate (CAGR) of 3.2% over the forecast period.
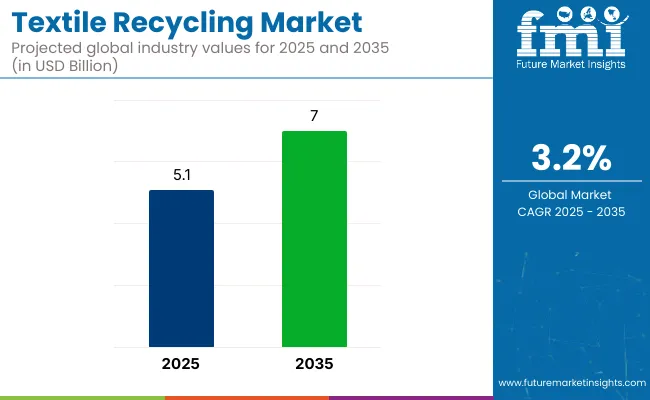
Quick Stats for the Global Textile Recycling Market:

  • Industry Value (2025): USD 5.1 billion
  • Forecast Value (2035): USD 7.0 billion
  • Forecast CAGR: 3.2%
  • Leading Segment in 2025: Apparel Waste (56%)
  • Key Growth Region: Europe and North America
  • Top Key Players: Infinited Fiber Company, Renewcell, Worn Again Technologies, Evrnu SPC, Carbios

Textile Recycling Market

Growth is being driven by increasing consumer awareness of environmental issues, expanding regulatory frameworks around waste management, and rising demand for circular economy models in the fashion and textile industries.

Market momentum has been influenced by the implementation of Extended Producer Responsibility (EPR) programs and mandatory textile waste collection initiatives in several European and North American countries. These policies have placed greater accountability on manufacturers and brands to manage the full lifecycle of their products, including end-of-life processing.

As a result, many global apparel companies have begun incorporating higher volumes of post-consumer and post-industrial recycled fibers into their product lines to meet compliance targets and consumer expectations.

Recycling technologies have continued to evolve. Mechanical recycling methods have become more refined, allowing for greater retention of fiber integrity during processing. In parallel, chemical recycling techniques for synthetic textiles, particularly polyester and blended fibers, have progressed through pilot and early commercial phases.

Companies such as Renewcell and Infinited Fiber Company have advanced chemical processes for cellulose regeneration, enabling the conversion of worn textiles into high-quality inputs suitable for mainstream apparel production.

Despite technological progress, several challenges persist. High operating costs, inconsistent quality of collected textile waste, and a lack of regionally distributed recycling infrastructure continue to limit scale. In emerging markets, informal waste collection systems dominate, which restricts traceability and contaminant control.

However, partnerships between fashion brands and waste management providers are emerging to streamline textile recovery and improve material sorting.

Investment in automated sorting systems, AI-based material recognition, and closed-loop production models is expected to increase as pressure builds on brands to meet sustainability commitments. Fashion retailers are also launching take-back schemes and incentivized collection programs to boost raw material supply for recycling.

Analyzing Textile Recycling Market by Top Investment Segments

Recycled cotton is anticipated to remain a key material due to its wide availability and compatibility with reuse processes

Cotton is projected to account for approximately 38% of the global textile recycling market share in 2025 and is expected to grow at a CAGR of 3.1% through 2035. Cotton waste is generated in high volumes from post-consumer garments and pre-consumer cutting scraps. It is commonly recycled into insulation, wiping cloths, yarns, and nonwoven fabrics.

While fiber length degradation during mechanical recycling remains a challenge, advancements in chemical recycling and fiber regeneration technologies are enhancing recovery efficiency. The rise of sustainable fashion and increasing brand commitments to circular textile programs are expected to sustain cotton’s relevance in recycled textile value chains.
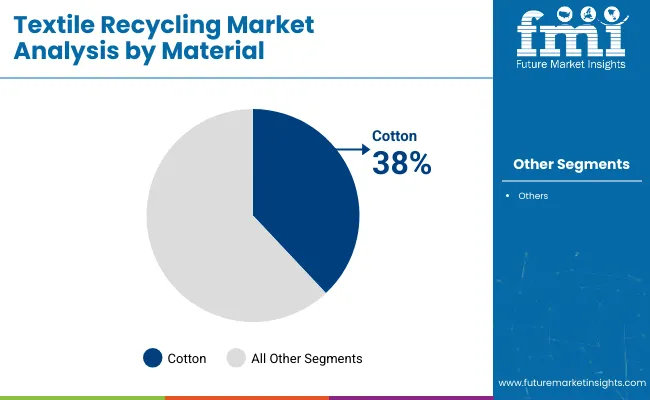
Textile Recycling Market By Material

Apparel waste is expected to continue as the dominant source of recyclable textiles

The apparel waste segment is estimated to hold approximately 56% of the global textile recycling market share in 2025 and is projected to grow at a CAGR of 3.3% through 2035. This category includes post-consumer clothing, manufacturing offcuts, and unsold inventory diverted from landfill or incineration. Rising volumes of fast fashion, coupled with low garment utilization rates, have made apparel a significant contributor to textile waste. Governments and industry coalitions are launching take-back programs and extended producer responsibility (EPR) frameworks to improve collection and recovery rates.

As awareness of environmental impacts increases and recycling infrastructure improves, apparel waste is expected to remain a consistent input stream for textile recyclers globally.
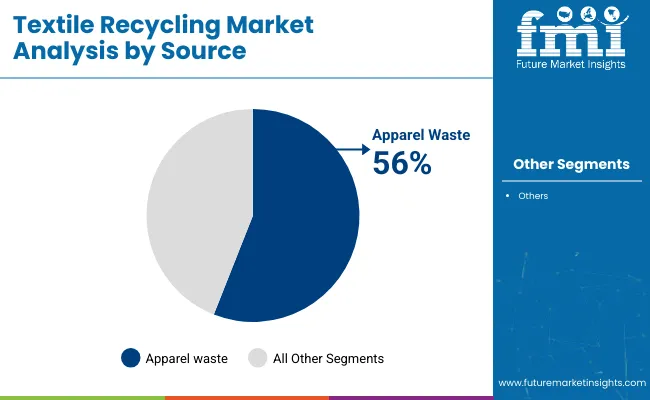
Textile Recycling Market By Source

Country-wise Analysis

United States

The textile recycling industry in the United States is expected to grow steadily due to increasing awareness of sustainability and government initiatives promoting circular economy practices. However, the country faces challenges such as high operational costs and a fragmented recycling infrastructure.

The demand for recycled textiles is rising, especially in the fashion and home furnishing sectors, driven by corporate sustainability goals. Investments in advanced sorting and processing technologies will help improve efficiency in the coming years.

FMI opines that the United States textile recycling sales will grow at nearly 2.8% CAGR through 2025 to 2035 and is expected to reach USD 1.29 billion by 2035.

United Kingdom

The UK textile recycling industry is projected to witness moderate growth, supported by strong government policies and consumer preference for eco-friendly products. The rising demand for sustainable fashion, combined with stricter waste management regulations, will drive industry expansion.

Additionally, collaborations between fashion brands and recycling firms are expected to enhance the adoption of recycled fibers. Challenges such as inconsistent waste collection systems still exist but are being addressed through technological advancements.

FMI opines that the United Kingdom textile recycling sales will grow at nearly 2.9% CAGR through 2025 to 2035 and is expected to reach USD 0.26 billion by 2035.

Germany

Germany is expected to have one of the highest growth rates in the textile recycling industry due to its well-established waste management infrastructure and stringent environmental regulations. The country is a leader in circular economy initiatives, with strong support from both the government and private sector.

The adoption of advanced chemical recycling methods and AI-based textile sorting systems is further driving industry growth. Germany's high recycling rates and strong corporate commitments to sustainability will continue to drive industry growth.

FMI opines that Germany’s textile recycling sales will grow at nearly 3.5% CAGR through 2025 to 2035 and are expected to reach USD 0.96 billion by 2035.

France

France is making significant progress in textile recycling, backed by stringent sustainability policies and extended producer responsibility (EPR) programs. The country has banned the destruction of unsold textiles, pushing brands to invest in recycling solutions. Increased funding for textile waste management and innovative fiber recovery techniques will boost industry growth. Increasing consumer awareness is further driving demand for recycled and upcycled clothing.

FMI opines that the France textile recycling sales will grow at nearly 3.4% CAGR through 2025 to 2035 and is expected to reach USD 0.80 billion by 2035.

Italy

Italy’s textile recycling industry is benefiting from the country’s strong fashion and textile industries, which are increasingly embracing sustainability. Luxury and fast fashion brands are incorporating recycled materials into their production processes, while government initiatives are encouraging the development of circular economy models. However, Challenges such as a fragmented recycling infrastructure and high costs remain, which necessitates increased investment in technology and logistics by industry stakeholders.

FMI opines that the Italy textile recycling sales will grow at nearly 3.1% CAGR through 2025 to 2035 and is expected to reach USD 0.66 billion by 2035.

Australia & New Zealand

Australia and New Zealand are witnessing a gradual shift towards textile recycling, driven by government regulations and consumer demand for sustainable fashion. Both countries are investing in textile recovery programs and partnerships between fashion brands and recycling firms. However, logistical challenges due to their geographic location and lack of large-scale infrastructure may limit growth. Increased innovation in fiber recycling technologies is expected to improve industry prospects.

FMI opines that the Australia & New Zealand textile recycling sales will grow at nearly 2.7% CAGR through 2025 to 2035 and is expected to reach USD 0.32 billion by 2035.

China

China is emerging as a major player in the textile recycling Industry, supported by strong government policies aimed at reducing textile waste. The country’s vast manufacturing sector is integrating recycled materials into production, and advanced recycling technologies are being rapidly adopted.

Additionally, growing environmental awareness among consumers and stricter waste management regulations are accelerating Industry growth. Despite challenges like illegal textile waste dumping, increased investments in sustainable practices are expected to drive significant progress.

FMI opines that the China textile recycling sales will grow at nearly 3.8% a CAGR through 2025 to 2035 and is expected to reach USD 1.49 billion by 2035.

South Korea

South Korea’s textile recycling Industry is expanding as the country implements stricter sustainability regulations and promotes circular economy initiatives. Advanced textile processing technologies and AI-driven waste sorting systems are enhancing recycling efficiency.

Additionally, fashion brands are increasingly using recycled fibers, supported by government incentives. One of the key challenges is the high cost of textile collection and processing. Continued investment in research and development will be crucial for industry expansion.

FMI opines that South Korea's textile recycling sales will grow at nearly 3.6% CAGR from 2025 to 2035 and is expected to reach USD 0.37 billion by 2035.

Japan

Japan’s textile recycling industry is progressing steadily, driven by strong environmental consciousness and government-led sustainability initiatives. The country has a well-developed recycling infrastructure, but the adoption of textile recycling in mainstream fashion remains slow.

Traditional waste disposal methods still dominate, limiting the growth of textile recycling in Japan. However, rising interest in circular fashion and new developments in fiber-to-fiber recycling technology could help accelerate industry adoption in the long run.

FMI opines that the Japanese textile recycling sales will grow at nearly 2.9% CAGR from 2025 to 2035 and is expected to reach USD 1.28 billion by 2035.

India

The textile recycling market in India is well-positioned to grow significantly, fueled by increasing awareness of sustainability. India has prioritized circular economy and waste management initiatives due to the substantial amount of textile waste it generates annually from both domestic consumption and export production. With the government encouraging EPR in textiles and organized collection of textile waste systems, the market is witnessing substantial progress.

Finally, the development and acceleration of new fiber-to-fiber recycling technologies, particularly for cotton and polyester, are underway. Several startups and established players are working on mechanical and chemical recycling processes to transform textile waste into reusable fiber. Despite these challenges, collaborations between fashion brands, recyclers, and policymakers are helping steer the industry back on course.

FMI opines that the Indian textile recycling sales will grow at nearly 4.0% CAGR through 2025 to 2035 and is expected to reach USD 0.53 billion by 2035.

Competition Outlook

The industry is concentrating on expanding fiber recovery and promoting circularity in textile production. Substantial investments are being directed toward innovative recycling technologies, including wet spinning and chemical regeneration, to convert pre- and post-consumer textile waste into reusable fibers.

Efforts are underway to industrialize textile-to-textile recycling, especially for complex fabrics like polyester-cotton blends. Additionally, there is growing demand for traceable recycled textiles, prompting brands to introduce products that provide verified sustainability credentials.

  • In July 2024, Bailu Group launched a textile recycling pilot line in Jiangxi, China, aimed at processing pre- and post-consumer textile waste into reusable cellulose fiber. The facility was established to support large-scale fiber recovery using wet spinning and chemical regeneration technologies. It marks a step toward industrializing textile-to-textile circularity in China.
  • In August 2024, Repreve, a brand under Unifi Inc., introduced a new range of recycled textile products for the promotional and corporate apparel sector. The line includes garments made from 100% post-consumer recycled polyester, offering verified traceability through Unifi’s U TRUST™ verification program. The launch reflects growing brand and distributor demand for verifiable, circular apparel materials.
  • In April 2024, Circ, a USA.-based textile recycling startup, entered a strategic partnership with Gibson & Barnes, a military uniform supplier, to scale its patented hydrothermal fiber separation technology. The partnership is expected to help Circ commercialize textile-to-textile recycling for blended fabrics at scale, especially for complex polyester–cotton materials.

Companies

  • Nippon Fiber Co., Ltd.
  • Renaissance Textile
  • Infinited Fiber Company
  • Renewcell
  • CuRe Technology
  • Birla Cellulose
  • Worn Again Technologies
  • Evrnu SPC
  • Carbios

Textile Recycling Market Segmentation

By Material:

  • Cotton
  • Polyester
  • Wool
  • Polyamide
  • Others

By Source:

  • Apparel Waste
  • Home Furnishing Waste
  • Automotive Waste
  • Others

By Process:

  • Mechanical
  • Chemical

By Region:

  • North America
  • Latin America
  • Western Europe
  • Eastern Europe
  • South Asia and Pacific
  • East Asia
  • Middle East and Africa

Table of Content

  1. Executive Summary
  2. Market Overview
  3. Market Background
  4. Global Market Analysis 2020 to 2024 and Forecast, 2025 to 2035
  5. Global Market Analysis 2020 to 2024 and Forecast 2025 to 2035, By Material
    • Cotton
    • Polyester
    • Wool
    • Polyamide
    • Others
  6. Global Market Analysis 2020 to 2024 and Forecast 2025 to 2035, By Source
    • Apparel Waste
    • Home Furnishing Waste
    • Automotive Waste
    • Others
  7. Global Market Analysis 2020 to 2024 and Forecast 2025 to 2035, By Process
    • Mechanical
    • Chemical
  8. Global Market Analysis 2020 to 2024 and Forecast 2025 to 2035, By Region
    • North America
    • Latin America
    • Western Europe
    • Eastern Europe
    • South Asia and Pacific
    • East Asia
    • Middle East and Africa
  9. North America Market Analysis 2020 to 2024 and Forecast 2025 to 2035, By Country
  10. Latin America Market Analysis 2020 to 2024 and Forecast 2025 to 2035, By Country
  11. Western Europe Market Analysis 2020 to 2024 and Forecast 2025 to 2035, By Country
  12. Eastern Europe Market Analysis 2020 to 2024 and Forecast 2025 to 2035, By Country
  13. South Asia and Pacific Market Analysis 2020 to 2024 and Forecast 2025 to 2035, By Country
  14. East Asia Market Analysis 2020 to 2024 and Forecast 2025 to 2035, By Country
  15. Middle East and Africa Market Analysis 2020 to 2024 and Forecast 2025 to 2035, By Country
  16. Key Countries Market Analysis
  17. Market Structure Analysis
  18. Competition Analysis
    • Worn again technologies
    • Lenzing Group
    • Birla Cellulose
    • BLS Ecotech
    • The Woolmark Company
    • iinouiio Ltd
    • Ecotex Group
    • The Boer Group
    • Unifi, Inc.
    • International
    • Hyosung Group
    • Martex Fiber
    • RenewCell
    • Pistoni S.r.l.
    • RE TEXTIL Deutschland GmbH.
  19. Assumptions & Acronyms Used
  20. Research Methodology

List of Tables

  • Table 1: Global Market Value (USD Million) Forecast by Region, 2020 to 2035
  • Table 2: Global Market Value (USD Million) Forecast by Material , 2020 to 2035
  • Table 3: Global Market Value (USD Million) Forecast by Source, 2020 to 2035
  • Table 4: Global Market Value (USD Million) Forecast by Process , 2020 to 2035
  • Table 5: North America Market Value (USD Million) Forecast by Country, 2020 to 2035
  • Table 6: North America Market Value (USD Million) Forecast by Material , 2020 to 2035
  • Table 7: North America Market Value (USD Million) Forecast by Source, 2020 to 2035
  • Table 8: North America Market Value (USD Million) Forecast by Process , 2020 to 2035
  • Table 9: Latin America Market Value (USD Million) Forecast by Country, 2020 to 2035
  • Table 10: Latin America Market Value (USD Million) Forecast by Material , 2020 to 2035
  • Table 11: Latin America Market Value (USD Million) Forecast by Source, 2020 to 2035
  • Table 12: Latin America Market Value (USD Million) Forecast by Process , 2020 to 2035
  • Table 13: Western Europe Market Value (USD Million) Forecast by Country, 2020 to 2035
  • Table 14: Western Europe Market Value (USD Million) Forecast by Material , 2020 to 2035
  • Table 15: Western Europe Market Value (USD Million) Forecast by Source, 2020 to 2035
  • Table 16: Western Europe Market Value (USD Million) Forecast by Process , 2020 to 2035
  • Table 17: Eastern Europe Market Value (USD Million) Forecast by Country, 2020 to 2035
  • Table 18: Eastern Europe Market Value (USD Million) Forecast by Material , 2020 to 2035
  • Table 19: Eastern Europe Market Value (USD Million) Forecast by Source, 2020 to 2035
  • Table 20: Eastern Europe Market Value (USD Million) Forecast by Process , 2020 to 2035
  • Table 21: South Asia and Pacific Market Value (USD Million) Forecast by Country, 2020 to 2035
  • Table 22: South Asia and Pacific Market Value (USD Million) Forecast by Material , 2020 to 2035
  • Table 23: South Asia and Pacific Market Value (USD Million) Forecast by Source, 2020 to 2035
  • Table 24: South Asia and Pacific Market Value (USD Million) Forecast by Process , 2020 to 2035
  • Table 25: East Asia Market Value (USD Million) Forecast by Country, 2020 to 2035
  • Table 26: East Asia Market Value (USD Million) Forecast by Material , 2020 to 2035
  • Table 27: East Asia Market Value (USD Million) Forecast by Source, 2020 to 2035
  • Table 28: East Asia Market Value (USD Million) Forecast by Process , 2020 to 2035
  • Table 29: Middle East and Africa Market Value (USD Million) Forecast by Country, 2020 to 2035
  • Table 30: Middle East and Africa Market Value (USD Million) Forecast by Material , 2020 to 2035
  • Table 31: Middle East and Africa Market Value (USD Million) Forecast by Source, 2020 to 2035
  • Table 32: Middle East and Africa Market Value (USD Million) Forecast by Process , 2020 to 2035

List of Figures

  • Figure 1: Global Market Value (USD Million) by Material , 2025 to 2035
  • Figure 2: Global Market Value (USD Million) by Source, 2025 to 2035
  • Figure 3: Global Market Value (USD Million) by Process , 2025 to 2035
  • Figure 4: Global Market Value (USD Million) by Region, 2025 to 2035
  • Figure 5: Global Market Value (USD Million) Analysis by Region, 2020 to 2035
  • Figure 6: Global Market Value Share (%) and BPS Analysis by Region, 2025 to 2035
  • Figure 7: Global Market Y-o-Y Growth (%) Projections by Region, 2025 to 2035
  • Figure 8: Global Market Value (USD Million) Analysis by Material , 2020 to 2035
  • Figure 9: Global Market Value Share (%) and BPS Analysis by Material , 2025 to 2035
  • Figure 10: Global Market Y-o-Y Growth (%) Projections by Material , 2025 to 2035
  • Figure 11: Global Market Value (USD Million) Analysis by Source, 2020 to 2035
  • Figure 12: Global Market Value Share (%) and BPS Analysis by Source, 2025 to 2035
  • Figure 13: Global Market Y-o-Y Growth (%) Projections by Source, 2025 to 2035
  • Figure 14: Global Market Value (USD Million) Analysis by Process , 2020 to 2035
  • Figure 15: Global Market Value Share (%) and BPS Analysis by Process , 2025 to 2035
  • Figure 16: Global Market Y-o-Y Growth (%) Projections by Process , 2025 to 2035
  • Figure 17: Global Market Attractiveness by Material , 2025 to 2035
  • Figure 18: Global Market Attractiveness by Source, 2025 to 2035
  • Figure 19: Global Market Attractiveness by Process , 2025 to 2035
  • Figure 20: Global Market Attractiveness by Region, 2025 to 2035
  • Figure 21: North America Market Value (USD Million) by Material , 2025 to 2035
  • Figure 22: North America Market Value (USD Million) by Source, 2025 to 2035
  • Figure 23: North America Market Value (USD Million) by Process , 2025 to 2035
  • Figure 24: North America Market Value (USD Million) by Country, 2025 to 2035
  • Figure 25: North America Market Value (USD Million) Analysis by Country, 2020 to 2035
  • Figure 26: North America Market Value Share (%) and BPS Analysis by Country, 2025 to 2035
  • Figure 27: North America Market Y-o-Y Growth (%) Projections by Country, 2025 to 2035
  • Figure 28: North America Market Value (USD Million) Analysis by Material , 2020 to 2035
  • Figure 29: North America Market Value Share (%) and BPS Analysis by Material , 2025 to 2035
  • Figure 30: North America Market Y-o-Y Growth (%) Projections by Material , 2025 to 2035
  • Figure 31: North America Market Value (USD Million) Analysis by Source, 2020 to 2035
  • Figure 32: North America Market Value Share (%) and BPS Analysis by Source, 2025 to 2035
  • Figure 33: North America Market Y-o-Y Growth (%) Projections by Source, 2025 to 2035
  • Figure 34: North America Market Value (USD Million) Analysis by Process , 2020 to 2035
  • Figure 35: North America Market Value Share (%) and BPS Analysis by Process , 2025 to 2035
  • Figure 36: North America Market Y-o-Y Growth (%) Projections by Process , 2025 to 2035
  • Figure 37: North America Market Attractiveness by Material , 2025 to 2035
  • Figure 38: North America Market Attractiveness by Source, 2025 to 2035
  • Figure 39: North America Market Attractiveness by Process , 2025 to 2035
  • Figure 40: North America Market Attractiveness by Country, 2025 to 2035
  • Figure 41: Latin America Market Value (USD Million) by Material , 2025 to 2035
  • Figure 42: Latin America Market Value (USD Million) by Source, 2025 to 2035
  • Figure 43: Latin America Market Value (USD Million) by Process , 2025 to 2035
  • Figure 44: Latin America Market Value (USD Million) by Country, 2025 to 2035
  • Figure 45: Latin America Market Value (USD Million) Analysis by Country, 2020 to 2035
  • Figure 46: Latin America Market Value Share (%) and BPS Analysis by Country, 2025 to 2035
  • Figure 47: Latin America Market Y-o-Y Growth (%) Projections by Country, 2025 to 2035
  • Figure 48: Latin America Market Value (USD Million) Analysis by Material , 2020 to 2035
  • Figure 49: Latin America Market Value Share (%) and BPS Analysis by Material , 2025 to 2035
  • Figure 50: Latin America Market Y-o-Y Growth (%) Projections by Material , 2025 to 2035
  • Figure 51: Latin America Market Value (USD Million) Analysis by Source, 2020 to 2035
  • Figure 52: Latin America Market Value Share (%) and BPS Analysis by Source, 2025 to 2035
  • Figure 53: Latin America Market Y-o-Y Growth (%) Projections by Source, 2025 to 2035
  • Figure 54: Latin America Market Value (USD Million) Analysis by Process , 2020 to 2035
  • Figure 55: Latin America Market Value Share (%) and BPS Analysis by Process , 2025 to 2035
  • Figure 56: Latin America Market Y-o-Y Growth (%) Projections by Process , 2025 to 2035
  • Figure 57: Latin America Market Attractiveness by Material , 2025 to 2035
  • Figure 58: Latin America Market Attractiveness by Source, 2025 to 2035
  • Figure 59: Latin America Market Attractiveness by Process , 2025 to 2035
  • Figure 60: Latin America Market Attractiveness by Country, 2025 to 2035
  • Figure 61: Western Europe Market Value (USD Million) by Material , 2025 to 2035
  • Figure 62: Western Europe Market Value (USD Million) by Source, 2025 to 2035
  • Figure 63: Western Europe Market Value (USD Million) by Process , 2025 to 2035
  • Figure 64: Western Europe Market Value (USD Million) by Country, 2025 to 2035
  • Figure 65: Western Europe Market Value (USD Million) Analysis by Country, 2020 to 2035
  • Figure 66: Western Europe Market Value Share (%) and BPS Analysis by Country, 2025 to 2035
  • Figure 67: Western Europe Market Y-o-Y Growth (%) Projections by Country, 2025 to 2035
  • Figure 68: Western Europe Market Value (USD Million) Analysis by Material , 2020 to 2035
  • Figure 69: Western Europe Market Value Share (%) and BPS Analysis by Material , 2025 to 2035
  • Figure 70: Western Europe Market Y-o-Y Growth (%) Projections by Material , 2025 to 2035
  • Figure 71: Western Europe Market Value (USD Million) Analysis by Source, 2020 to 2035
  • Figure 72: Western Europe Market Value Share (%) and BPS Analysis by Source, 2025 to 2035
  • Figure 73: Western Europe Market Y-o-Y Growth (%) Projections by Source, 2025 to 2035
  • Figure 74: Western Europe Market Value (USD Million) Analysis by Process , 2020 to 2035
  • Figure 75: Western Europe Market Value Share (%) and BPS Analysis by Process , 2025 to 2035
  • Figure 76: Western Europe Market Y-o-Y Growth (%) Projections by Process , 2025 to 2035
  • Figure 77: Western Europe Market Attractiveness by Material , 2025 to 2035
  • Figure 78: Western Europe Market Attractiveness by Source, 2025 to 2035
  • Figure 79: Western Europe Market Attractiveness by Process , 2025 to 2035
  • Figure 80: Western Europe Market Attractiveness by Country, 2025 to 2035
  • Figure 81: Eastern Europe Market Value (USD Million) by Material , 2025 to 2035
  • Figure 82: Eastern Europe Market Value (USD Million) by Source, 2025 to 2035
  • Figure 83: Eastern Europe Market Value (USD Million) by Process , 2025 to 2035
  • Figure 84: Eastern Europe Market Value (USD Million) by Country, 2025 to 2035
  • Figure 85: Eastern Europe Market Value (USD Million) Analysis by Country, 2020 to 2035
  • Figure 86: Eastern Europe Market Value Share (%) and BPS Analysis by Country, 2025 to 2035
  • Figure 87: Eastern Europe Market Y-o-Y Growth (%) Projections by Country, 2025 to 2035
  • Figure 88: Eastern Europe Market Value (USD Million) Analysis by Material , 2020 to 2035
  • Figure 89: Eastern Europe Market Value Share (%) and BPS Analysis by Material , 2025 to 2035
  • Figure 90: Eastern Europe Market Y-o-Y Growth (%) Projections by Material , 2025 to 2035
  • Figure 91: Eastern Europe Market Value (USD Million) Analysis by Source, 2020 to 2035
  • Figure 92: Eastern Europe Market Value Share (%) and BPS Analysis by Source, 2025 to 2035
  • Figure 93: Eastern Europe Market Y-o-Y Growth (%) Projections by Source, 2025 to 2035
  • Figure 94: Eastern Europe Market Value (USD Million) Analysis by Process , 2020 to 2035
  • Figure 95: Eastern Europe Market Value Share (%) and BPS Analysis by Process , 2025 to 2035
  • Figure 96: Eastern Europe Market Y-o-Y Growth (%) Projections by Process , 2025 to 2035
  • Figure 97: Eastern Europe Market Attractiveness by Material , 2025 to 2035
  • Figure 98: Eastern Europe Market Attractiveness by Source, 2025 to 2035
  • Figure 99: Eastern Europe Market Attractiveness by Process , 2025 to 2035
  • Figure 100: Eastern Europe Market Attractiveness by Country, 2025 to 2035
  • Figure 101: South Asia and Pacific Market Value (USD Million) by Material , 2025 to 2035
  • Figure 102: South Asia and Pacific Market Value (USD Million) by Source, 2025 to 2035
  • Figure 103: South Asia and Pacific Market Value (USD Million) by Process , 2025 to 2035
  • Figure 104: South Asia and Pacific Market Value (USD Million) by Country, 2025 to 2035
  • Figure 105: South Asia and Pacific Market Value (USD Million) Analysis by Country, 2020 to 2035
  • Figure 106: South Asia and Pacific Market Value Share (%) and BPS Analysis by Country, 2025 to 2035
  • Figure 107: South Asia and Pacific Market Y-o-Y Growth (%) Projections by Country, 2025 to 2035
  • Figure 108: South Asia and Pacific Market Value (USD Million) Analysis by Material , 2020 to 2035
  • Figure 109: South Asia and Pacific Market Value Share (%) and BPS Analysis by Material , 2025 to 2035
  • Figure 110: South Asia and Pacific Market Y-o-Y Growth (%) Projections by Material , 2025 to 2035
  • Figure 111: South Asia and Pacific Market Value (USD Million) Analysis by Source, 2020 to 2035
  • Figure 112: South Asia and Pacific Market Value Share (%) and BPS Analysis by Source, 2025 to 2035
  • Figure 113: South Asia and Pacific Market Y-o-Y Growth (%) Projections by Source, 2025 to 2035
  • Figure 114: South Asia and Pacific Market Value (USD Million) Analysis by Process , 2020 to 2035
  • Figure 115: South Asia and Pacific Market Value Share (%) and BPS Analysis by Process , 2025 to 2035
  • Figure 116: South Asia and Pacific Market Y-o-Y Growth (%) Projections by Process , 2025 to 2035
  • Figure 117: South Asia and Pacific Market Attractiveness by Material , 2025 to 2035
  • Figure 118: South Asia and Pacific Market Attractiveness by Source, 2025 to 2035
  • Figure 119: South Asia and Pacific Market Attractiveness by Process , 2025 to 2035
  • Figure 120: South Asia and Pacific Market Attractiveness by Country, 2025 to 2035
  • Figure 121: East Asia Market Value (USD Million) by Material , 2025 to 2035
  • Figure 122: East Asia Market Value (USD Million) by Source, 2025 to 2035
  • Figure 123: East Asia Market Value (USD Million) by Process , 2025 to 2035
  • Figure 124: East Asia Market Value (USD Million) by Country, 2025 to 2035
  • Figure 125: East Asia Market Value (USD Million) Analysis by Country, 2020 to 2035
  • Figure 126: East Asia Market Value Share (%) and BPS Analysis by Country, 2025 to 2035
  • Figure 127: East Asia Market Y-o-Y Growth (%) Projections by Country, 2025 to 2035
  • Figure 128: East Asia Market Value (USD Million) Analysis by Material , 2020 to 2035
  • Figure 129: East Asia Market Value Share (%) and BPS Analysis by Material , 2025 to 2035
  • Figure 130: East Asia Market Y-o-Y Growth (%) Projections by Material , 2025 to 2035
  • Figure 131: East Asia Market Value (USD Million) Analysis by Source, 2020 to 2035
  • Figure 132: East Asia Market Value Share (%) and BPS Analysis by Source, 2025 to 2035
  • Figure 133: East Asia Market Y-o-Y Growth (%) Projections by Source, 2025 to 2035
  • Figure 134: East Asia Market Value (USD Million) Analysis by Process , 2020 to 2035
  • Figure 135: East Asia Market Value Share (%) and BPS Analysis by Process , 2025 to 2035
  • Figure 136: East Asia Market Y-o-Y Growth (%) Projections by Process , 2025 to 2035
  • Figure 137: East Asia Market Attractiveness by Material , 2025 to 2035
  • Figure 138: East Asia Market Attractiveness by Source, 2025 to 2035
  • Figure 139: East Asia Market Attractiveness by Process , 2025 to 2035
  • Figure 140: East Asia Market Attractiveness by Country, 2025 to 2035
  • Figure 141: Middle East and Africa Market Value (USD Million) by Material , 2025 to 2035
  • Figure 142: Middle East and Africa Market Value (USD Million) by Source, 2025 to 2035
  • Figure 143: Middle East and Africa Market Value (USD Million) by Process , 2025 to 2035
  • Figure 144: Middle East and Africa Market Value (USD Million) by Country, 2025 to 2035
  • Figure 145: Middle East and Africa Market Value (USD Million) Analysis by Country, 2020 to 2035
  • Figure 146: Middle East and Africa Market Value Share (%) and BPS Analysis by Country, 2025 to 2035
  • Figure 147: Middle East and Africa Market Y-o-Y Growth (%) Projections by Country, 2025 to 2035
  • Figure 148: Middle East and Africa Market Value (USD Million) Analysis by Material , 2020 to 2035
  • Figure 149: Middle East and Africa Market Value Share (%) and BPS Analysis by Material , 2025 to 2035
  • Figure 150: Middle East and Africa Market Y-o-Y Growth (%) Projections by Material , 2025 to 2035
  • Figure 151: Middle East and Africa Market Value (USD Million) Analysis by Source, 2020 to 2035
  • Figure 152: Middle East and Africa Market Value Share (%) and BPS Analysis by Source, 2025 to 2035
  • Figure 153: Middle East and Africa Market Y-o-Y Growth (%) Projections by Source, 2025 to 2035
  • Figure 154: Middle East and Africa Market Value (USD Million) Analysis by Process , 2020 to 2035
  • Figure 155: Middle East and Africa Market Value Share (%) and BPS Analysis by Process , 2025 to 2035
  • Figure 156: Middle East and Africa Market Y-o-Y Growth (%) Projections by Process , 2025 to 2035
  • Figure 157: Middle East and Africa Market Attractiveness by Material , 2025 to 2035
  • Figure 158: Middle East and Africa Market Attractiveness by Source, 2025 to 2035
  • Figure 159: Middle East and Africa Market Attractiveness by Process , 2025 to 2035
  • Figure 160: Middle East and Africa Market Attractiveness by Country, 2025 to 2035

Frequently Asked Questions

What are the key benefits of textile recycling?

Textile recycling helps reduce landfill waste, conserves natural resources, lowers carbon emissions, and supports a circular economy by reusing materials for new products.

What types of textiles can be recycled?

Commonly recycled materials include cotton, polyester, wool, polyamide, and blended fabrics. Advanced technologies also enable the recycling of synthetic fibers.

What are the main challenges in textile recycling?

Challenges include high processing costs, contamination of materials, limited infrastructure, and difficulties in sorting blended fabrics for efficient recycling.

How does mechanical recycling differ from chemical recycling?

Mechanical recycling shreds and reprocesses textiles without altering their structure, while chemical recycling breaks fibers down into raw materials for higher-quality reuse.

Which industries benefit the most from textile recycling?

Industries such as fashion, home furnishings, automotive, and sportswear benefit from textile recycling by incorporating sustainable materials into their products.

Explore Similar Insights

Future Market Insights

Textile Recycling Market