Ceramic Textile Market Size and Share Forecast Outlook From 2025 to 2035
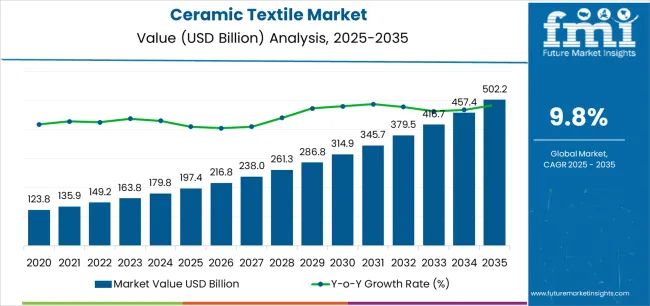
The Ceramic Textile Market is estimated to be valued at USD 197.4 billion in 2025 and is projected to reach USD 502.2 billion by 2035, registering a compound annual growth rate (CAGR) of 9.8% over the forecast period.
The ceramic textile market is exhibiting steady growth, supported by increasing demand for high-temperature insulation materials across industrial, aerospace, and automotive applications. These textiles provide exceptional thermal resistance, low thermal conductivity, and chemical stability, making them essential in environments requiring protection from extreme heat and corrosion. The current market is driven by expanding energy-intensive sectors such as metallurgy, power generation, and petrochemicals, where equipment efficiency and worker safety are top priorities.
The growing adoption of lightweight and durable insulation materials in manufacturing processes is also influencing product development. Technological advancements in fiber spinning and coating treatments are improving mechanical strength and flexibility, broadening the application scope.
Furthermore, rising environmental regulations promoting energy efficiency and reduced heat loss are expected to strengthen market adoption. With industrial modernization and continued emphasis on sustainability, the ceramic textile market is projected to sustain strong momentum in the coming years.
Quick Stats for Ceramic Textile Market
- Ceramic Textile Market Industry Value (2025): USD 197.4 billion
- Ceramic Textile Market Forecast Value (2035): USD 502.2 billion
- Ceramic Textile Market Forecast CAGR: 9.8%
- Leading Segment in Ceramic Textile Market in 2025: Vitreous Alumina-Silica (61.5%)
- Key Growth Region in Ceramic Textile Market: North America, Asia-Pacific, Europe
- Top Key Players in Ceramic Textile Market: Morgan Advanced Materials Corporation, Ibiden, Kyocera Corporation, Isolite Insulating Products Co., Ltd., Unifrax, Zircar Zirconia, Inc., Luyang Energy-Saving Materials Co., Ltd., Rath Group, Rauschert GmbH, 3M, Mineral Seal Corporation, RAK Ceramics
| Metric |
Value |
| Ceramic Textile Market Estimated Value in (2025 E) |
USD 197.4 billion |
| Ceramic Textile Market Forecast Value in (2035 F) |
USD 502.2 billion |
| Forecast CAGR (2025 to 2035) |
9.8% |
Segmental Analysis
The market is segmented by Type, Form, Process, and End Use and region. By Type, the market is divided into Vitreous Alumina-Silica and Polycrystalline Ceramic Fiber. In terms of Form, the market is classified into Cloth, Ropes, Tapes, Sleeves, and Braids. Based on Process, the market is segmented into Pressing, Extrusion, Injection Molding, and Others. By End Use, the market is divided into Iron And Steel, Transportation, Petrochemicals, Aluminum, Power, and Industrial. Regionally, the market is classified into North America, Latin America, Western Europe, Eastern Europe, Balkan & Baltic Countries, Russia & Belarus, Central Asia, East Asia, South Asia & Pacific, and the Middle East & Africa.
Insights into the Vitreous Alumina-Silica Segment
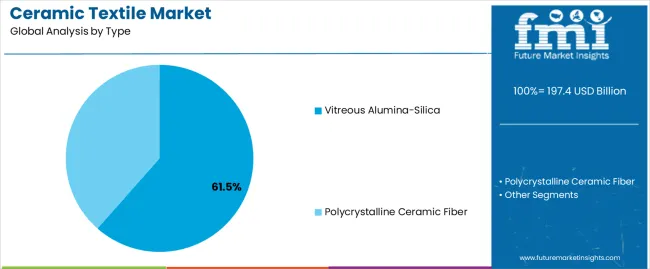
The vitreous alumina-silica segment dominates the type category, accounting for approximately 61.5% share of the ceramic textile market. This segment’s leadership is attributed to its superior thermal stability, resistance to chemical degradation, and ability to withstand prolonged exposure to temperatures exceeding 1000°C. The composition of vitreous alumina-silica fibers enables use in high-performance insulation, protective clothing, and refractory linings.
Industrial users favor this type due to its durability under mechanical stress and minimal shrinkage during thermal cycling. Its cost-effectiveness compared to pure alumina fibers also supports widespread adoption in sectors such as metal processing and aerospace.
Continuous research into enhancing fiber purity and reducing brittleness is further improving product performance. With sustained demand for heat-resistant materials and energy-efficient insulation solutions, the vitreous alumina-silica segment is expected to maintain its commanding position throughout the forecast period.
Insights into the Cloth Segment
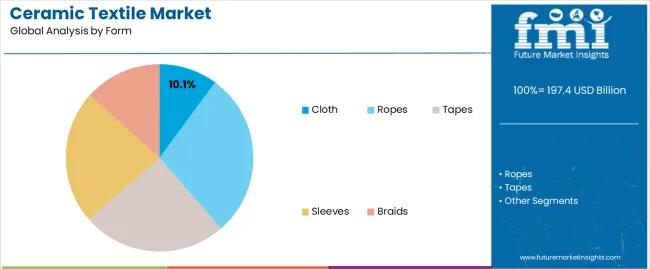
The cloth segment holds approximately 10.1% share in the form category, representing a key product configuration within the ceramic textile market. This form is preferred for its flexibility, ease of fabrication, and adaptability in thermal insulation wraps, expansion joints, and protective covers.
Cloth-based ceramic textiles offer an optimal balance between strength and handling convenience, making them suitable for both industrial and safety applications. The ability to tailor weave patterns and coatings to specific operating conditions enhances their versatility.
Demand is particularly strong in maintenance, repair, and operational insulation due to the reusability and high-temperature endurance of ceramic cloths. As industries continue to adopt lightweight, flexible insulation materials to improve operational efficiency and reduce installation time, the cloth segment is projected to witness stable growth within the overall market framework.
Insights into the Pressing Segment
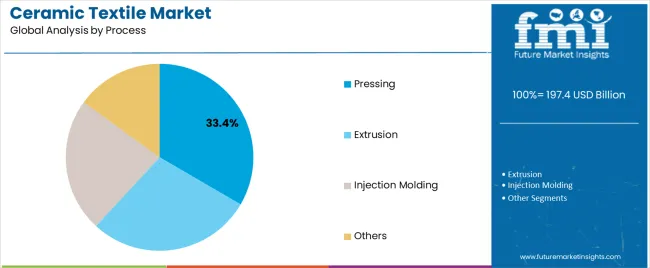
The pressing segment leads the process category, capturing approximately 33.4% share in the ceramic textile market. This dominance is driven by the method’s ability to produce dense, uniform, and mechanically strong textile structures suitable for demanding industrial environments. The pressing process enhances dimensional stability and thermal shock resistance, ensuring product reliability under extreme operational stress.
It allows precise control over fiber orientation and compaction, resulting in improved insulation performance and reduced porosity. Manufacturers prefer this process for applications requiring consistent product thickness and high structural integrity.
Continuous advancements in pressing technology, including automated pressure control and hybrid sintering systems, have further optimized production efficiency. With industries increasingly seeking materials that combine strength, thermal endurance, and dimensional precision, the pressing segment is expected to remain the dominant processing technique in the ceramic textile market.
Emerging Opportunities in the Ceramic Textile Market
- The energy industry is a major consumer of ceramic textiles due to their use in high-temperature applications such as power generation and distribution.
- Ceramic textiles are used in the manufacture of insulation materials for power plant equipment and electrical components.
- The growing demand for renewable energy sources such as wind and solar power is expected to generate opportunities for players in the ceramic textile market in the energy sector.
- The growing demand for filtration materials in various industries is also driving the market forward.
- Ceramic textiles are used in the manufacture of filters for applications such as water filtration, air filtration, and oil filtration. The increasing demand for clean water and air is driving the growth of the ceramic textile market in the filtration segment.
- The ceramic textile market is expected to continue its growth trajectory in the coming years, driven by the increasing demand for high-temperature-resistant materials in various end-use industries.
- The market opportunities are vast for ceramic textile manufacturers as they can cater to a wide range of industries and applications.
Factors Restraining the Growth of the Ceramic Textile Market
- The high cost of production of ceramic textiles makes them unaffordable for many end-users.
- The manufacturing process of ceramic textiles requires high-quality raw materials, advanced equipment, and skilled labor, leading to higher production costs.
- The limited application of ceramic textiles in a few industries, such as aerospace, defense, and automotive, is also expected to limit market expansion.
- Although ceramic textiles offer excellent thermal insulation, fire resistance, and chemical resistance properties, their use is limited to high-end applications due to their high cost. This limits the growth potential of the ceramic textile market.
- The availability of alternative materials such as fiberglass and carbon fiber composites is a challenge for the ceramic textile market. These materials offer similar properties as ceramic textiles but at a lower cost, making them a more preferred choice for several applications, hindering the growth of the ceramic textile market.
Ceramic Textile Industry Analysis by Top Investment Segments
The Vitreous Alumina-Silica Segment Dominates the Market by Type
| Attributes |
Details |
| Top Type |
Vitreous Alumina-Silica |
| CAGR (2025 to 2035) |
10.2% |
- The vitreous alumina-silica segment is dominating the ceramic textile market due to its high strength, excellent thermal insulation properties, and resistance to corrosion and erosion.
- It has a low thermal conductivity, making it suitable for high-temperature applications.
- This segment is cost-effective and widely available, making it a popular choice among manufacturers.
- Another reason for its popularity is its versatility in terms of applications, as it can be used in various industries such as aerospace, automotive, and energy.
- These factors make vitreous alumina-silica a preferred material in the ceramic textile market.
The Cloth Segment Dominates the Market by Form
| Attributes |
Details |
| Top Form |
Cloth |
| CAGR (2025 to 2035) |
10.1% |
- The cloth segment is expected to dominate the ceramic textile market due to its versatility and flexibility.
- Ceramic cloth is made from ceramic fibers, which are woven together to create a fabric that can withstand high temperatures and harsh environments.
- This makes it an ideal material for use in industrial applications where extreme temperatures and harsh conditions are common.
- Ceramic cloth is lightweight and easy to handle, which makes it a popular choice for insulation and heat shielding applications.
- It is also resistant to chemicals and abrasion, which further enhances its durability and longevity.
- Ceramic cloth is relatively inexpensive compared to other high-temperature materials like ceramics, metals, and composites.
- This makes it an attractive option for companies looking to reduce costs without compromising on quality and performance.
Analysis of Top Countries Manufacturing, Certifying, and Utilizing Ceramic Textile Materials
| Countries |
CAGR (2025 to 2035) |
| United States |
10.5% |
| United Kingdom |
11.0% |
| China |
10.7% |
| Japan |
11.1% |
| South Korea |
11.4% |
Significant Rise in Aerospace Sector Drives Demand for Ceramic Textiles in the United States
- The demand for ceramic textiles is rising in the aerospace sector in the United States.
- These materials are used in applications such as engine insulation and thermal protection, where their ability to withstand high temperatures and resist corrosion makes them a valuable asset.
- With the continued growth of the aerospace industry in the United States, the demand for ceramic textiles is expected to remain strong.
- The automotive sector in the United States is expected to drive the demand for ceramic textiles.
- Ceramic textiles are used in automotive applications such as exhaust systems, where they help to reduce heat transfer and improve fuel efficiency.
- As the demand for more efficient and environmentally friendly vehicles increases, ceramic textiles are likely to play an even larger role in the automotive industry.
Increasing Focus on Green and Renewable Energy in the United Kingdom
- The country's focus on renewable energy and reducing carbon emissions is driving the demand for ceramic textiles.
- Ceramic textiles are used in the manufacture of various products, including solar panels, batteries, and fuel cells, which are vital components in the renewable energy industry.
- The increasing demand for renewable energy sources in the United Kingdom has LED to a surge in demand for ceramic textiles.
- The United Kingdom's aerospace and defense industries are also major consumers of ceramic textiles.
- These textiles are used in the manufacturing of heat-resistant and protective products, such as thermal barriers, insulation, and missile nose cones.
- The aerospace and defence industries in the United Kingdom are growing, and the demand for ceramic textiles in these sectors is expected to increase further.
Increasing Investment in Infrastructure Development in China
- China has been experiencing a significant increase in demand for ceramic textile products in recent years.
- This trend can be attributed to a number of economic and technological factors.
- The Chinese government has been investing heavily in infrastructure, particularly in the areas of energy and transportation.
- This has LED to a rise in demand for ceramic textile products in various applications such as thermal insulation, fireproofing, and corrosion resistance.
- China has experienced a significant increase in industrial production in recent years, especially in the electronics, automotive, and aerospace manufacturing industries.
- These industries require high-performance materials such as ceramic textiles that can withstand high temperatures and harsh environments.
- The development of advanced technologies such as 5G, artificial intelligence, and IoT has driven the demand for ceramic textile products in the construction of new infrastructure and buildings.
Rising Demand for Ceramic Textiles in Various Industries in Japan
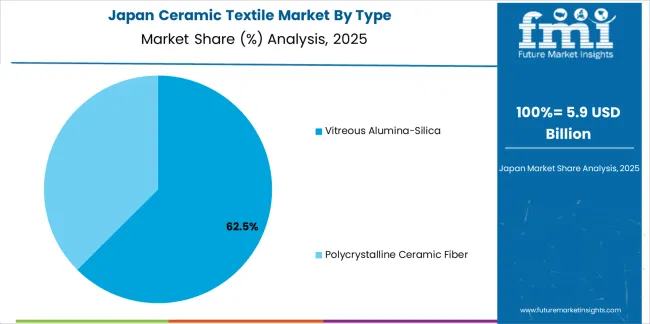
- Japan has witnessed a surge in demand for ceramic textile products, and the trend is expected to continue in the coming years.
- The ceramic textile industry in Japan has seen an increase in demand due to its unique properties and applications in various industries.
- The demand for ceramic textile products is increasing due to their excellent thermal insulation properties.
- Ceramic textiles are used in industries such as aerospace, automotive, and energy, where high-temperature environments are common.
- The textile can withstand high temperatures and prevent heat transfer, making them ideal insulation materials.
- Japan's robust automotive industry is another reason why there is a high demand for ceramic textiles.
- The country is known for its high-quality automotive products, and ceramic textiles are used in the manufacturing process.
- The textile acts as a barrier between the engine and other components, preventing heat transfer and ensuring better performance.
- Japan's commitment to environmental sustainability has also increased demand for ceramic textiles.
- The country has stringent environmental regulations, and ceramic textiles are used in industries such as energy and construction to reduce emissions and ensure compliance with environmental regulations.
Growing Industrial Manufacturing Sector in South Korea
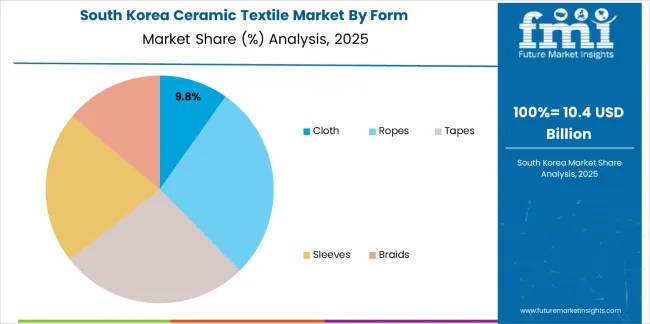
- The increasing demand for ceramic textiles in South Korea is the country's growing industrial manufacturing sector.
- Ceramic textiles are used extensively in industries such as aerospace, automotive, and energy, where they are employed for insulation, filtration, and other critical applications.
- Country’s focus on innovation and research and development.
- The government of South Korea has been investing heavily in research and development in various fields, including advanced materials, which has LED to the development of new and advanced ceramic textiles that are more efficient and effective.
- The country's growing infrastructure development.
- With the government's focus on infrastructure development, there is a rising demand for ceramic textiles for use in construction and other infrastructure-related projects.
Leading Suppliers in the Ceramic Textile Sector
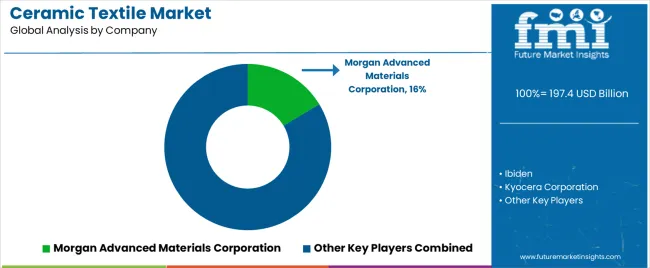
The market is quite diverse, with several key players operating in the space. Companies offer a range of ceramic textile products for various applications, such as insulation, filtration, and fire protection.
Each of these players has their unique strengths and weaknesses, and they employ different strategies to stay competitive in the market. Overall, the ceramic textile market is highly competitive, and companies need to continuously innovate and improve their products to stay ahead of the competition.
Recent Developments
- In 2025, researchers at MIT developed a new method for 3D printing ceramic fibers, opening doors for customizable and complex ceramic textile structures.
- In 2024, Acota was chosen as the Authorised Distributor of 3M's Nextel ceramic textiles and fibers throughout North Europe, connecting the latter's offers for delivering specialty materials to manufacturers and industries.
Notable Players in the Business Landscape
- Ibiden
- Kyocera Corporation
- Isolite Insulating Products Co., Ltd.
- Morgan Advanced Materials Corporation
- Unifrax
- Zircar Zirconia, Inc.
- Luyang Energy-Saving Materials Co., Ltd.
- Rath Group
- Rauschert GmbH
- 3M
- Mineral Seal Corporation
- RAK Ceramics
Top Segments Studied in the Ceramic Textile Market
By Type:
- Vitreous Alumina-Silica
- Polycrystalline Ceramic Fiber
By Form:
- Cloth
- Ropes
- Tapes
- Sleeves
- Braids
By Process:
- Pressing
- Extrusion
- Injection Molding
- Others
By End Use:
- Transportation
- Petrochemicals
- Iron and Steel
- Aluminum
- Power
- Industrial
By Region:
- North America
- Latin America
- East Asia
- South Asia
- Europe
- Oceania
- MEA
Frequently Asked Questions
How big is the ceramic textile market in 2025?
The global ceramic textile market is estimated to be valued at USD 197.4 billion in 2025.
What will be the size of ceramic textile market in 2035?
The market size for the ceramic textile market is projected to reach USD 502.2 billion by 2035.
How much will be the ceramic textile market growth between 2025 and 2035?
The ceramic textile market is expected to grow at a 9.8% CAGR between 2025 and 2035.
What are the key product types in the ceramic textile market?
The key product types in ceramic textile market are vitreous alumina-silica and polycrystalline ceramic fiber.
Which form segment to contribute significant share in the ceramic textile market in 2025?
In terms of form, cloth segment to command 10.1% share in the ceramic textile market in 2025.


