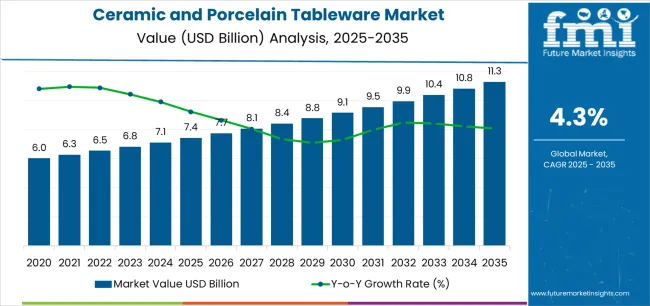
The Ceramic And Porcelain Tableware Market had an estimated market share worth USD 6.7 billion in 2023, and it is predicted to reach a global market valuation of USD 11 billion by 2034, growing at a steady CAGR of 4.5% from 2024 to 2034.
The influence of social media as well as lifestyle trends is one factor driving the demand for ceramic and porcelain tableware. Demand for elegant and aesthetically pleasing designs that are readily shareable on social media platforms is driven by frequent consumer need for dinnerware that is Instagram-worthy and fits in with contemporary décor and eating trends.
Sales Analysis of Ceramic and Porcelain Tableware
Report Attribute | Details |
---|---|
Estimated Market Value in 2023 | USD 6.7 billion |
Expected Market Value in 2024 | USD 7.1 billion |
Projected Forecast Value in 2034 | USD 11 billion |
Anticipated Growth Rate from 2024 to 2034 | 4.5% |
The global demand for ceramic and porcelain tableware market was estimated to reach a valuation of USD 5.3 billion in 2019, according to a report from Future Market Insights (FMI). From 2019 to 2023, sales witnessed significant growth in the ceramic and porcelain tableware market, registering a CAGR of 6.1%.
Historical CAGR (2019 to 2023) | 6.1% |
---|---|
Forecast CAGR (2024 to 2034) | 4.5% |
Cultural heritage has a significant effect on the market for ceramic and porcelain dinnerware, which is often underestimated. Designs for tableware frequently incorporate historical and cultural themes, appealing to customers looking for a sense of authenticity and a link to their past. This feature gives customer preferences and product offers in the market a distinctive twist.
Some important factors that will boost the market growth through 2034 are:
Growing Trend towards Sustainable Living to Push Demand
The market for ceramic and porcelain tableware is also being driven by the rising trend of sustainable living. Customers are looking for eco-friendly tableware solutions created from recycled or renewable materials and produced using sustainable techniques as a result of growing environmental awareness.
Due to the shift in customer tastes, companies are being forced to fulfill market demand for environmentally aware products by investing in sustainable sourcing, production, and packaging techniques. Companies that emphasize eco-friendly efforts stand to gain an advantage in the market as customers increasingly prioritize sustainability.
Increasing Trend towards Fine Dining to bolster Demand Globally
The market for ceramic and porcelain dinnerware is significantly driven by the growing emphasis on fine dining experiences and the aesthetics of home décor. Tableware that improves the dining atmosphere is sought after by consumers that emphasize entertaining and dining at home.
Demand for chic and adaptable dinnerware designs that go well with both formal and informal parties is being driven by this trend. In order to adapt to changing customer tastes and lifestyle trends, manufacturers take advantage of this by providing a broad choice of cutting-edge designs and collections.
Easily Available Alternate Tableware Material to Impede Market Growth
A number of problems are impeding the market expansion for ceramic and porcelain tableware. These include shifts in the economy that have an impact on consumer purchasing, heightened competition from substitute materials like stainless steel and glass, and stricter environmental restrictions.
Further impeding market development are issues like growing production costs, especially for energy and raw materials, and the possibility of counterfeit goods. Manufacturers who are trying to stay competitive face challenges from shifting consumer tastes and lifestyle trends.
This section focuses on providing detailed analysis of two particular market segments for ceramic and porcelain tableware, the dominant material type and the significant technology type. The two main segments discussed below are bone china and slip casting.
Material Type | Bone China |
---|---|
CAGR from 2024 to 2034 | 4.3% |
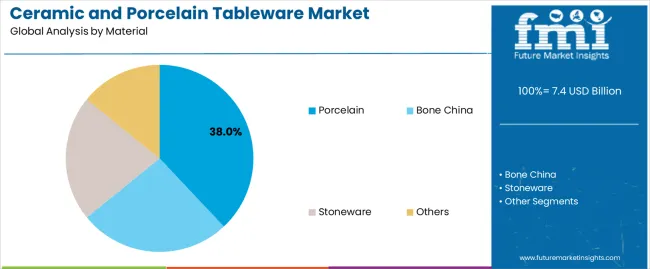
During the forecast period, the bone china segment is likely to garner a 4.3% CAGR. Tableware made of bone china is anticipated to become more and more popular due to its exceptional blend of durability, elegance, and translucency. With its delicate appearance and outstanding strength, it appeals to consumers looking for beautiful yet practical dinnerware solutions.
Bone china is appropriate for both regular usage and special events due to its resistance to high temperatures. As a result of its classic design and excellent craftsmanship, it is a popular option for discriminating diners who want to upgrade their dining encounters.
Technology | Slip Casting |
---|---|
Market Share in 2024 | 51.2% |
In 2024, the slip casting segment is likely to acquire a 51.2% global market share. Slip casting technique is positioned to gain popularity in the industry due to its versatility and low cost. With this process, complex designs for porcelain and ceramic dinnerware may be produced in large quantities at a reliable level of quality.
Its capacity to effectively construct elaborate features and complicated forms appeals to firms looking for innovative manufacturing methods to satisfy a wide range of customer demands. Slip casting is less expensive to produce than traditional techniques, which makes it a desirable choice for companies looking to streamline operations and maintain their competitiveness.
The markets for ceramic and porcelain tableware in a few significant countries, including the United States, the United Kingdom, China, Japan, and South Korea, will be covered in detail in this section. The section will focus on the primary factors driving up demand for ceramic and porcelain tableware in these countries.
Countries | Forecast CAGR from 2024 to 2034 |
---|---|
The United States | 4.8% |
The United Kingdom | 5.7% |
China | 4.9% |
Japan | 6.1% |
South Korea | 6.4% |
The United States ceramic and porcelain tableware is anticipated to gain a CAGR of 4.8% through 2034. Factors that are bolstering the growth are:
The market in the United Kingdom is expected to expand with a 5.7% CAGR through 2034. The factors pushing the growth are:
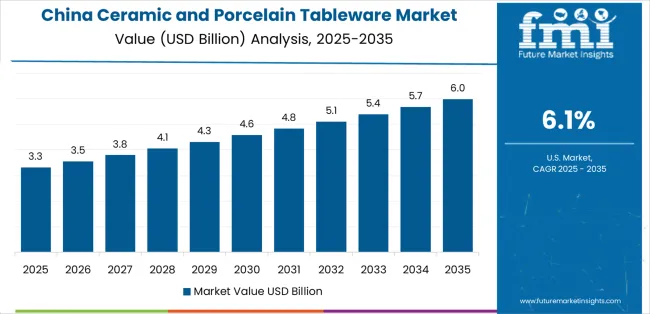
The ceramic and porcelain tableware ecosystem in China is anticipated to develop with a 4.9% CAGR from 2024 to 2034. The drivers behind this growth are:
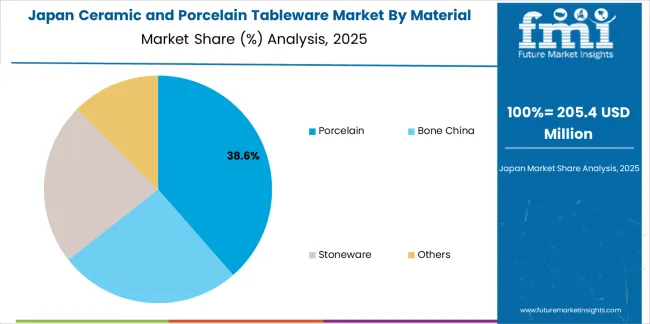
The ceramic and porcelain tableware industry in Japan is anticipated to reach a 6.1% CAGR from 2024 to 2034. The drivers propelling growth forward are:
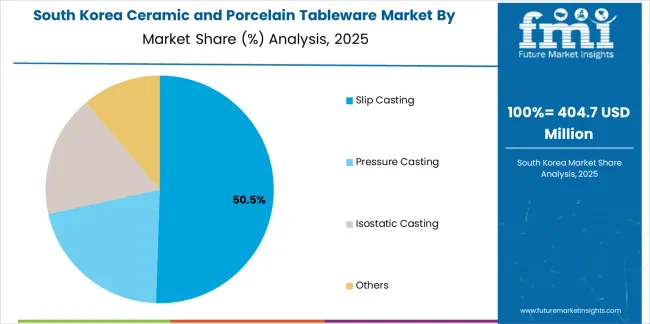
The ceramic and porcelain tableware ecosystem in South Korea is likely to attain a 6.4% CAGR during the forecast period. The factors bolstering the growth are:
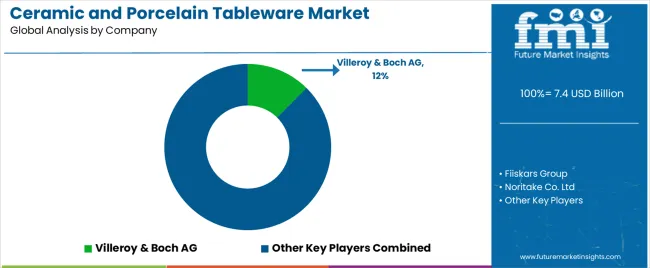
Companies in the global ceramic and porcelain tableware market are employing a range of tactics in an effort to increase profits. They put a lot of effort into creating innovative products, bringing in fresh hues, forms, and patterns to meet changing customer demands.
Companies use e-commerce platforms to reach a wider audience and build strategic alliances with global merchants.
They also spend money on marketing initiatives that raise customer awareness of the brand and increase consumer involvement. Some companies put a high priority on sustainability initiatives, creating eco-friendly tableware to appeal to customers who care about the environment and take advantage of the market's rising demand for sustainable goods.
Significant advancements in the ceramic and porcelain tableware sector are being made by key market participants, and these include:
Report Attribute | Details |
---|---|
Growth Rate | CAGR of 4.5% from 2024 to 2034 |
Market value in 2024 | USD 7.1 billion |
Market value in 2034 | USD 11 billion |
Base Year for Estimation | 2023 |
Historical Data | 2019 to 2023 |
Forecast Period | 2024 to 2034 |
Quantitative Units | USD billion for value |
Report Coverage | Revenue Forecast, Company Ranking, Competitive Landscape, Growth Factors, Trends, and Pricing Analysis |
Segments Covered | Material, Technology, Product, Distribution Channel, Region |
Regions Covered | North America; Latin America; Western Europe; Eastern Europe; South Asia and Pacific; East Asia; The Middle East & Africa |
Countries Profiled | The United States, Canada, Brazil, Mexico, Germany, The United Kingdom, France, Spain, Italy, Poland, Russia, Czech Republic, Romania, India, Bangladesh, Australia, New Zealand, China, Japan, South Korea, GCC Countries, South Africa, Israel |
Key Companies Profiled | Villeroy & Boch AG; Fiiskars Group; Noritake Co. Ltd; RAK Ceramics PJSC; Lifetime Brands Inc.; Lenox Corporation; Rosenthal GmbH; Churchill China (UK) Limited; Richard Ginori S.r.l; Tognana Porcellane S.p.A |
Customization Scope | Available on Request |
Table 1: Global Market Value (US$ Million) Forecast by Region, 2019 to 2034
Table 2: Global Market Volume (Units Pack) Forecast by Region, 2019 to 2034
Table 3: Global Market Value (US$ Million) Forecast by Material, 2019 to 2034
Table 4: Global Market Volume (Units Pack) Forecast by Material, 2019 to 2034
Table 5: Global Market Value (US$ Million) Forecast by Technology, 2019 to 2034
Table 6: Global Market Volume (Units Pack) Forecast by Technology, 2019 to 2034
Table 7: Global Market Value (US$ Million) Forecast by Product, 2019 to 2034
Table 8: Global Market Volume (Units Pack) Forecast by Product, 2019 to 2034
Table 9: Global Market Value (US$ Million) Forecast by Distribution Channel, 2019 to 2034
Table 10: Global Market Volume (Units Pack) Forecast by Distribution Channel, 2019 to 2034
Table 11: North America Market Value (US$ Million) Forecast by Country, 2019 to 2034
Table 12: North America Market Volume (Units Pack) Forecast by Country, 2019 to 2034
Table 13: North America Market Value (US$ Million) Forecast by Material, 2019 to 2034
Table 14: North America Market Volume (Units Pack) Forecast by Material, 2019 to 2034
Table 15: North America Market Value (US$ Million) Forecast by Technology, 2019 to 2034
Table 16: North America Market Volume (Units Pack) Forecast by Technology, 2019 to 2034
Table 17: North America Market Value (US$ Million) Forecast by Product, 2019 to 2034
Table 18: North America Market Volume (Units Pack) Forecast by Product, 2019 to 2034
Table 19: North America Market Value (US$ Million) Forecast by Distribution Channel, 2019 to 2034
Table 20: North America Market Volume (Units Pack) Forecast by Distribution Channel, 2019 to 2034
Table 21: Latin America Market Value (US$ Million) Forecast by Country, 2019 to 2034
Table 22: Latin America Market Volume (Units Pack) Forecast by Country, 2019 to 2034
Table 23: Latin America Market Value (US$ Million) Forecast by Material, 2019 to 2034
Table 24: Latin America Market Volume (Units Pack) Forecast by Material, 2019 to 2034
Table 25: Latin America Market Value (US$ Million) Forecast by Technology, 2019 to 2034
Table 26: Latin America Market Volume (Units Pack) Forecast by Technology, 2019 to 2034
Table 27: Latin America Market Value (US$ Million) Forecast by Product, 2019 to 2034
Table 28: Latin America Market Volume (Units Pack) Forecast by Product, 2019 to 2034
Table 29: Latin America Market Value (US$ Million) Forecast by Distribution Channel, 2019 to 2034
Table 30: Latin America Market Volume (Units Pack) Forecast by Distribution Channel, 2019 to 2034
Table 31: Europe Market Value (US$ Million) Forecast by Country, 2019 to 2034
Table 32: Europe Market Volume (Units Pack) Forecast by Country, 2019 to 2034
Table 33: Europe Market Value (US$ Million) Forecast by Material, 2019 to 2034
Table 34: Europe Market Volume (Units Pack) Forecast by Material, 2019 to 2034
Table 35: Europe Market Value (US$ Million) Forecast by Technology, 2019 to 2034
Table 36: Europe Market Volume (Units Pack) Forecast by Technology, 2019 to 2034
Table 37: Europe Market Value (US$ Million) Forecast by Product, 2019 to 2034
Table 38: Europe Market Volume (Units Pack) Forecast by Product, 2019 to 2034
Table 39: Europe Market Value (US$ Million) Forecast by Distribution Channel, 2019 to 2034
Table 40: Europe Market Volume (Units Pack) Forecast by Distribution Channel, 2019 to 2034
Table 41: East Asia Market Value (US$ Million) Forecast by Country, 2019 to 2034
Table 42: East Asia Market Volume (Units Pack) Forecast by Country, 2019 to 2034
Table 43: East Asia Market Value (US$ Million) Forecast by Material, 2019 to 2034
Table 44: East Asia Market Volume (Units Pack) Forecast by Material, 2019 to 2034
Table 45: East Asia Market Value (US$ Million) Forecast by Technology, 2019 to 2034
Table 46: East Asia Market Volume (Units Pack) Forecast by Technology, 2019 to 2034
Table 47: East Asia Market Value (US$ Million) Forecast by Product, 2019 to 2034
Table 48: East Asia Market Volume (Units Pack) Forecast by Product, 2019 to 2034
Table 49: East Asia Market Value (US$ Million) Forecast by Distribution Channel, 2019 to 2034
Table 50: East Asia Market Volume (Units Pack) Forecast by Distribution Channel, 2019 to 2034
Table 51: South Asia Market Value (US$ Million) Forecast by Country, 2019 to 2034
Table 52: South Asia Market Volume (Units Pack) Forecast by Country, 2019 to 2034
Table 53: South Asia Market Value (US$ Million) Forecast by Material, 2019 to 2034
Table 54: South Asia Market Volume (Units Pack) Forecast by Material, 2019 to 2034
Table 55: South Asia Market Value (US$ Million) Forecast by Technology, 2019 to 2034
Table 56: South Asia Market Volume (Units Pack) Forecast by Technology, 2019 to 2034
Table 57: South Asia Market Value (US$ Million) Forecast by Product, 2019 to 2034
Table 58: South Asia Market Volume (Units Pack) Forecast by Product, 2019 to 2034
Table 59: South Asia Market Value (US$ Million) Forecast by Distribution Channel, 2019 to 2034
Table 60: South Asia Market Volume (Units Pack) Forecast by Distribution Channel, 2019 to 2034
Table 61: Oceania Market Value (US$ Million) Forecast by Country, 2019 to 2034
Table 62: Oceania Market Volume (Units Pack) Forecast by Country, 2019 to 2034
Table 63: Oceania Market Value (US$ Million) Forecast by Material, 2019 to 2034
Table 64: Oceania Market Volume (Units Pack) Forecast by Material, 2019 to 2034
Table 65: Oceania Market Value (US$ Million) Forecast by Technology, 2019 to 2034
Table 66: Oceania Market Volume (Units Pack) Forecast by Technology, 2019 to 2034
Table 67: Oceania Market Value (US$ Million) Forecast by Product, 2019 to 2034
Table 68: Oceania Market Volume (Units Pack) Forecast by Product, 2019 to 2034
Table 69: Oceania Market Value (US$ Million) Forecast by Distribution Channel, 2019 to 2034
Table 70: Oceania Market Volume (Units Pack) Forecast by Distribution Channel, 2019 to 2034
Table 71: MEA Market Value (US$ Million) Forecast by Country, 2019 to 2034
Table 72: MEA Market Volume (Units Pack) Forecast by Country, 2019 to 2034
Table 73: MEA Market Value (US$ Million) Forecast by Material, 2019 to 2034
Table 74: MEA Market Volume (Units Pack) Forecast by Material, 2019 to 2034
Table 75: MEA Market Value (US$ Million) Forecast by Technology, 2019 to 2034
Table 76: MEA Market Volume (Units Pack) Forecast by Technology, 2019 to 2034
Table 77: MEA Market Value (US$ Million) Forecast by Product, 2019 to 2034
Table 78: MEA Market Volume (Units Pack) Forecast by Product, 2019 to 2034
Table 79: MEA Market Value (US$ Million) Forecast by Distribution Channel, 2019 to 2034
Table 80: MEA Market Volume (Units Pack) Forecast by Distribution Channel, 2019 to 2034
Figure 1: Global Market Value (US$ Million) by Material, 2024 to 2034
Figure 2: Global Market Value (US$ Million) by Technology, 2024 to 2034
Figure 3: Global Market Value (US$ Million) by Product, 2024 to 2034
Figure 4: Global Market Value (US$ Million) by Distribution Channel, 2024 to 2034
Figure 5: Global Market Value (US$ Million) by Region, 2024 to 2034
Figure 6: Global Market Value (US$ Million) Analysis by Region, 2019 to 2034
Figure 7: Global Market Volume (Units Pack) Analysis by Region, 2019 to 2034
Figure 8: Global Market Value Share (%) and BPS Analysis by Region, 2024 to 2034
Figure 9: Global Market Y-o-Y Growth (%) Projections by Region, 2024 to 2034
Figure 10: Global Market Value (US$ Million) Analysis by Material, 2019 to 2034
Figure 11: Global Market Volume (Units Pack) Analysis by Material, 2019 to 2034
Figure 12: Global Market Value Share (%) and BPS Analysis by Material, 2024 to 2034
Figure 13: Global Market Y-o-Y Growth (%) Projections by Material, 2024 to 2034
Figure 14: Global Market Value (US$ Million) Analysis by Technology, 2019 to 2034
Figure 15: Global Market Volume (Units Pack) Analysis by Technology, 2019 to 2034
Figure 16: Global Market Value Share (%) and BPS Analysis by Technology, 2024 to 2034
Figure 17: Global Market Y-o-Y Growth (%) Projections by Technology, 2024 to 2034
Figure 18: Global Market Value (US$ Million) Analysis by Product, 2019 to 2034
Figure 19: Global Market Volume (Units Pack) Analysis by Product, 2019 to 2034
Figure 20: Global Market Value Share (%) and BPS Analysis by Product, 2024 to 2034
Figure 21: Global Market Y-o-Y Growth (%) Projections by Product, 2024 to 2034
Figure 22: Global Market Value (US$ Million) Analysis by Distribution Channel, 2019 to 2034
Figure 23: Global Market Volume (Units Pack) Analysis by Distribution Channel, 2019 to 2034
Figure 24: Global Market Value Share (%) and BPS Analysis by Distribution Channel, 2024 to 2034
Figure 25: Global Market Y-o-Y Growth (%) Projections by Distribution Channel, 2024 to 2034
Figure 26: Global Market Attractiveness by Material, 2024 to 2034
Figure 27: Global Market Attractiveness by Technology, 2024 to 2034
Figure 28: Global Market Attractiveness by Product, 2024 to 2034
Figure 29: Global Market Attractiveness by Distribution Channel, 2024 to 2034
Figure 30: Global Market Attractiveness by Region, 2024 to 2034
Figure 31: North America Market Value (US$ Million) by Material, 2024 to 2034
Figure 32: North America Market Value (US$ Million) by Technology, 2024 to 2034
Figure 33: North America Market Value (US$ Million) by Product, 2024 to 2034
Figure 34: North America Market Value (US$ Million) by Distribution Channel, 2024 to 2034
Figure 35: North America Market Value (US$ Million) by Country, 2024 to 2034
Figure 36: North America Market Value (US$ Million) Analysis by Country, 2019 to 2034
Figure 37: North America Market Volume (Units Pack) Analysis by Country, 2019 to 2034
Figure 38: North America Market Value Share (%) and BPS Analysis by Country, 2024 to 2034
Figure 39: North America Market Y-o-Y Growth (%) Projections by Country, 2024 to 2034
Figure 40: North America Market Value (US$ Million) Analysis by Material, 2019 to 2034
Figure 41: North America Market Volume (Units Pack) Analysis by Material, 2019 to 2034
Figure 42: North America Market Value Share (%) and BPS Analysis by Material, 2024 to 2034
Figure 43: North America Market Y-o-Y Growth (%) Projections by Material, 2024 to 2034
Figure 44: North America Market Value (US$ Million) Analysis by Technology, 2019 to 2034
Figure 45: North America Market Volume (Units Pack) Analysis by Technology, 2019 to 2034
Figure 46: North America Market Value Share (%) and BPS Analysis by Technology, 2024 to 2034
Figure 47: North America Market Y-o-Y Growth (%) Projections by Technology, 2024 to 2034
Figure 48: North America Market Value (US$ Million) Analysis by Product, 2019 to 2034
Figure 49: North America Market Volume (Units Pack) Analysis by Product, 2019 to 2034
Figure 50: North America Market Value Share (%) and BPS Analysis by Product, 2024 to 2034
Figure 51: North America Market Y-o-Y Growth (%) Projections by Product, 2024 to 2034
Figure 52: North America Market Value (US$ Million) Analysis by Distribution Channel, 2019 to 2034
Figure 53: North America Market Volume (Units Pack) Analysis by Distribution Channel, 2019 to 2034
Figure 54: North America Market Value Share (%) and BPS Analysis by Distribution Channel, 2024 to 2034
Figure 55: North America Market Y-o-Y Growth (%) Projections by Distribution Channel, 2024 to 2034
Figure 56: North America Market Attractiveness by Material, 2024 to 2034
Figure 57: North America Market Attractiveness by Technology, 2024 to 2034
Figure 58: North America Market Attractiveness by Product, 2024 to 2034
Figure 59: North America Market Attractiveness by Distribution Channel, 2024 to 2034
Figure 60: North America Market Attractiveness by Country, 2024 to 2034
Figure 61: Latin America Market Value (US$ Million) by Material, 2024 to 2034
Figure 62: Latin America Market Value (US$ Million) by Technology, 2024 to 2034
Figure 63: Latin America Market Value (US$ Million) by Product, 2024 to 2034
Figure 64: Latin America Market Value (US$ Million) by Distribution Channel, 2024 to 2034
Figure 65: Latin America Market Value (US$ Million) by Country, 2024 to 2034
Figure 66: Latin America Market Value (US$ Million) Analysis by Country, 2019 to 2034
Figure 67: Latin America Market Volume (Units Pack) Analysis by Country, 2019 to 2034
Figure 68: Latin America Market Value Share (%) and BPS Analysis by Country, 2024 to 2034
Figure 69: Latin America Market Y-o-Y Growth (%) Projections by Country, 2024 to 2034
Figure 70: Latin America Market Value (US$ Million) Analysis by Material, 2019 to 2034
Figure 71: Latin America Market Volume (Units Pack) Analysis by Material, 2019 to 2034
Figure 72: Latin America Market Value Share (%) and BPS Analysis by Material, 2024 to 2034
Figure 73: Latin America Market Y-o-Y Growth (%) Projections by Material, 2024 to 2034
Figure 74: Latin America Market Value (US$ Million) Analysis by Technology, 2019 to 2034
Figure 75: Latin America Market Volume (Units Pack) Analysis by Technology, 2019 to 2034
Figure 76: Latin America Market Value Share (%) and BPS Analysis by Technology, 2024 to 2034
Figure 77: Latin America Market Y-o-Y Growth (%) Projections by Technology, 2024 to 2034
Figure 78: Latin America Market Value (US$ Million) Analysis by Product, 2019 to 2034
Figure 79: Latin America Market Volume (Units Pack) Analysis by Product, 2019 to 2034
Figure 80: Latin America Market Value Share (%) and BPS Analysis by Product, 2024 to 2034
Figure 81: Latin America Market Y-o-Y Growth (%) Projections by Product, 2024 to 2034
Figure 82: Latin America Market Value (US$ Million) Analysis by Distribution Channel, 2019 to 2034
Figure 83: Latin America Market Volume (Units Pack) Analysis by Distribution Channel, 2019 to 2034
Figure 84: Latin America Market Value Share (%) and BPS Analysis by Distribution Channel, 2024 to 2034
Figure 85: Latin America Market Y-o-Y Growth (%) Projections by Distribution Channel, 2024 to 2034
Figure 86: Latin America Market Attractiveness by Material, 2024 to 2034
Figure 87: Latin America Market Attractiveness by Technology, 2024 to 2034
Figure 88: Latin America Market Attractiveness by Product, 2024 to 2034
Figure 89: Latin America Market Attractiveness by Distribution Channel, 2024 to 2034
Figure 90: Latin America Market Attractiveness by Country, 2024 to 2034
Figure 91: Europe Market Value (US$ Million) by Material, 2024 to 2034
Figure 92: Europe Market Value (US$ Million) by Technology, 2024 to 2034
Figure 93: Europe Market Value (US$ Million) by Product, 2024 to 2034
Figure 94: Europe Market Value (US$ Million) by Distribution Channel, 2024 to 2034
Figure 95: Europe Market Value (US$ Million) by Country, 2024 to 2034
Figure 96: Europe Market Value (US$ Million) Analysis by Country, 2019 to 2034
Figure 97: Europe Market Volume (Units Pack) Analysis by Country, 2019 to 2034
Figure 98: Europe Market Value Share (%) and BPS Analysis by Country, 2024 to 2034
Figure 99: Europe Market Y-o-Y Growth (%) Projections by Country, 2024 to 2034
Figure 100: Europe Market Value (US$ Million) Analysis by Material, 2019 to 2034
Figure 101: Europe Market Volume (Units Pack) Analysis by Material, 2019 to 2034
Figure 102: Europe Market Value Share (%) and BPS Analysis by Material, 2024 to 2034
Figure 103: Europe Market Y-o-Y Growth (%) Projections by Material, 2024 to 2034
Figure 104: Europe Market Value (US$ Million) Analysis by Technology, 2019 to 2034
Figure 105: Europe Market Volume (Units Pack) Analysis by Technology, 2019 to 2034
Figure 106: Europe Market Value Share (%) and BPS Analysis by Technology, 2024 to 2034
Figure 107: Europe Market Y-o-Y Growth (%) Projections by Technology, 2024 to 2034
Figure 108: Europe Market Value (US$ Million) Analysis by Product, 2019 to 2034
Figure 109: Europe Market Volume (Units Pack) Analysis by Product, 2019 to 2034
Figure 110: Europe Market Value Share (%) and BPS Analysis by Product, 2024 to 2034
Figure 111: Europe Market Y-o-Y Growth (%) Projections by Product, 2024 to 2034
Figure 112: Europe Market Value (US$ Million) Analysis by Distribution Channel, 2019 to 2034
Figure 113: Europe Market Volume (Units Pack) Analysis by Distribution Channel, 2019 to 2034
Figure 114: Europe Market Value Share (%) and BPS Analysis by Distribution Channel, 2024 to 2034
Figure 115: Europe Market Y-o-Y Growth (%) Projections by Distribution Channel, 2024 to 2034
Figure 116: Europe Market Attractiveness by Material, 2024 to 2034
Figure 117: Europe Market Attractiveness by Technology, 2024 to 2034
Figure 118: Europe Market Attractiveness by Product, 2024 to 2034
Figure 119: Europe Market Attractiveness by Distribution Channel, 2024 to 2034
Figure 120: Europe Market Attractiveness by Country, 2024 to 2034
Figure 121: East Asia Market Value (US$ Million) by Material, 2024 to 2034
Figure 122: East Asia Market Value (US$ Million) by Technology, 2024 to 2034
Figure 123: East Asia Market Value (US$ Million) by Product, 2024 to 2034
Figure 124: East Asia Market Value (US$ Million) by Distribution Channel, 2024 to 2034
Figure 125: East Asia Market Value (US$ Million) by Country, 2024 to 2034
Figure 126: East Asia Market Value (US$ Million) Analysis by Country, 2019 to 2034
Figure 127: East Asia Market Volume (Units Pack) Analysis by Country, 2019 to 2034
Figure 128: East Asia Market Value Share (%) and BPS Analysis by Country, 2024 to 2034
Figure 129: East Asia Market Y-o-Y Growth (%) Projections by Country, 2024 to 2034
Figure 130: East Asia Market Value (US$ Million) Analysis by Material, 2019 to 2034
Figure 131: East Asia Market Volume (Units Pack) Analysis by Material, 2019 to 2034
Figure 132: East Asia Market Value Share (%) and BPS Analysis by Material, 2024 to 2034
Figure 133: East Asia Market Y-o-Y Growth (%) Projections by Material, 2024 to 2034
Figure 134: East Asia Market Value (US$ Million) Analysis by Technology, 2019 to 2034
Figure 135: East Asia Market Volume (Units Pack) Analysis by Technology, 2019 to 2034
Figure 136: East Asia Market Value Share (%) and BPS Analysis by Technology, 2024 to 2034
Figure 137: East Asia Market Y-o-Y Growth (%) Projections by Technology, 2024 to 2034
Figure 138: East Asia Market Value (US$ Million) Analysis by Product, 2019 to 2034
Figure 139: East Asia Market Volume (Units Pack) Analysis by Product, 2019 to 2034
Figure 140: East Asia Market Value Share (%) and BPS Analysis by Product, 2024 to 2034
Figure 141: East Asia Market Y-o-Y Growth (%) Projections by Product, 2024 to 2034
Figure 142: East Asia Market Value (US$ Million) Analysis by Distribution Channel, 2019 to 2034
Figure 143: East Asia Market Volume (Units Pack) Analysis by Distribution Channel, 2019 to 2034
Figure 144: East Asia Market Value Share (%) and BPS Analysis by Distribution Channel, 2024 to 2034
Figure 145: East Asia Market Y-o-Y Growth (%) Projections by Distribution Channel, 2024 to 2034
Figure 146: East Asia Market Attractiveness by Material, 2024 to 2034
Figure 147: East Asia Market Attractiveness by Technology, 2024 to 2034
Figure 148: East Asia Market Attractiveness by Product, 2024 to 2034
Figure 149: East Asia Market Attractiveness by Distribution Channel, 2024 to 2034
Figure 150: East Asia Market Attractiveness by Country, 2024 to 2034
Figure 151: South Asia Market Value (US$ Million) by Material, 2024 to 2034
Figure 152: South Asia Market Value (US$ Million) by Technology, 2024 to 2034
Figure 153: South Asia Market Value (US$ Million) by Product, 2024 to 2034
Figure 154: South Asia Market Value (US$ Million) by Distribution Channel, 2024 to 2034
Figure 155: South Asia Market Value (US$ Million) by Country, 2024 to 2034
Figure 156: South Asia Market Value (US$ Million) Analysis by Country, 2019 to 2034
Figure 157: South Asia Market Volume (Units Pack) Analysis by Country, 2019 to 2034
Figure 158: South Asia Market Value Share (%) and BPS Analysis by Country, 2024 to 2034
Figure 159: South Asia Market Y-o-Y Growth (%) Projections by Country, 2024 to 2034
Figure 160: South Asia Market Value (US$ Million) Analysis by Material, 2019 to 2034
Figure 161: South Asia Market Volume (Units Pack) Analysis by Material, 2019 to 2034
Figure 162: South Asia Market Value Share (%) and BPS Analysis by Material, 2024 to 2034
Figure 163: South Asia Market Y-o-Y Growth (%) Projections by Material, 2024 to 2034
Figure 164: South Asia Market Value (US$ Million) Analysis by Technology, 2019 to 2034
Figure 165: South Asia Market Volume (Units Pack) Analysis by Technology, 2019 to 2034
Figure 166: South Asia Market Value Share (%) and BPS Analysis by Technology, 2024 to 2034
Figure 167: South Asia Market Y-o-Y Growth (%) Projections by Technology, 2024 to 2034
Figure 168: South Asia Market Value (US$ Million) Analysis by Product, 2019 to 2034
Figure 169: South Asia Market Volume (Units Pack) Analysis by Product, 2019 to 2034
Figure 170: South Asia Market Value Share (%) and BPS Analysis by Product, 2024 to 2034
Figure 171: South Asia Market Y-o-Y Growth (%) Projections by Product, 2024 to 2034
Figure 172: South Asia Market Value (US$ Million) Analysis by Distribution Channel, 2019 to 2034
Figure 173: South Asia Market Volume (Units Pack) Analysis by Distribution Channel, 2019 to 2034
Figure 174: South Asia Market Value Share (%) and BPS Analysis by Distribution Channel, 2024 to 2034
Figure 175: South Asia Market Y-o-Y Growth (%) Projections by Distribution Channel, 2024 to 2034
Figure 176: South Asia Market Attractiveness by Material, 2024 to 2034
Figure 177: South Asia Market Attractiveness by Technology, 2024 to 2034
Figure 178: South Asia Market Attractiveness by Product, 2024 to 2034
Figure 179: South Asia Market Attractiveness by Distribution Channel, 2024 to 2034
Figure 180: South Asia Market Attractiveness by Country, 2024 to 2034
Figure 181: Oceania Market Value (US$ Million) by Material, 2024 to 2034
Figure 182: Oceania Market Value (US$ Million) by Technology, 2024 to 2034
Figure 183: Oceania Market Value (US$ Million) by Product, 2024 to 2034
Figure 184: Oceania Market Value (US$ Million) by Distribution Channel, 2024 to 2034
Figure 185: Oceania Market Value (US$ Million) by Country, 2024 to 2034
Figure 186: Oceania Market Value (US$ Million) Analysis by Country, 2019 to 2034
Figure 187: Oceania Market Volume (Units Pack) Analysis by Country, 2019 to 2034
Figure 188: Oceania Market Value Share (%) and BPS Analysis by Country, 2024 to 2034
Figure 189: Oceania Market Y-o-Y Growth (%) Projections by Country, 2024 to 2034
Figure 190: Oceania Market Value (US$ Million) Analysis by Material, 2019 to 2034
Figure 191: Oceania Market Volume (Units Pack) Analysis by Material, 2019 to 2034
Figure 192: Oceania Market Value Share (%) and BPS Analysis by Material, 2024 to 2034
Figure 193: Oceania Market Y-o-Y Growth (%) Projections by Material, 2024 to 2034
Figure 194: Oceania Market Value (US$ Million) Analysis by Technology, 2019 to 2034
Figure 195: Oceania Market Volume (Units Pack) Analysis by Technology, 2019 to 2034
Figure 196: Oceania Market Value Share (%) and BPS Analysis by Technology, 2024 to 2034
Figure 197: Oceania Market Y-o-Y Growth (%) Projections by Technology, 2024 to 2034
Figure 198: Oceania Market Value (US$ Million) Analysis by Product, 2019 to 2034
Figure 199: Oceania Market Volume (Units Pack) Analysis by Product, 2019 to 2034
Figure 200: Oceania Market Value Share (%) and BPS Analysis by Product, 2024 to 2034
Figure 201: Oceania Market Y-o-Y Growth (%) Projections by Product, 2024 to 2034
Figure 202: Oceania Market Value (US$ Million) Analysis by Distribution Channel, 2019 to 2034
Figure 203: Oceania Market Volume (Units Pack) Analysis by Distribution Channel, 2019 to 2034
Figure 204: Oceania Market Value Share (%) and BPS Analysis by Distribution Channel, 2024 to 2034
Figure 205: Oceania Market Y-o-Y Growth (%) Projections by Distribution Channel, 2024 to 2034
Figure 206: Oceania Market Attractiveness by Material, 2024 to 2034
Figure 207: Oceania Market Attractiveness by Technology, 2024 to 2034
Figure 208: Oceania Market Attractiveness by Product, 2024 to 2034
Figure 209: Oceania Market Attractiveness by Distribution Channel, 2024 to 2034
Figure 210: Oceania Market Attractiveness by Country, 2024 to 2034
Figure 211: MEA Market Value (US$ Million) by Material, 2024 to 2034
Figure 212: MEA Market Value (US$ Million) by Technology, 2024 to 2034
Figure 213: MEA Market Value (US$ Million) by Product, 2024 to 2034
Figure 214: MEA Market Value (US$ Million) by Distribution Channel, 2024 to 2034
Figure 215: MEA Market Value (US$ Million) by Country, 2024 to 2034
Figure 216: MEA Market Value (US$ Million) Analysis by Country, 2019 to 2034
Figure 217: MEA Market Volume (Units Pack) Analysis by Country, 2019 to 2034
Figure 218: MEA Market Value Share (%) and BPS Analysis by Country, 2024 to 2034
Figure 219: MEA Market Y-o-Y Growth (%) Projections by Country, 2024 to 2034
Figure 220: MEA Market Value (US$ Million) Analysis by Material, 2019 to 2034
Figure 221: MEA Market Volume (Units Pack) Analysis by Material, 2019 to 2034
Figure 222: MEA Market Value Share (%) and BPS Analysis by Material, 2024 to 2034
Figure 223: MEA Market Y-o-Y Growth (%) Projections by Material, 2024 to 2034
Figure 224: MEA Market Value (US$ Million) Analysis by Technology, 2019 to 2034
Figure 225: MEA Market Volume (Units Pack) Analysis by Technology, 2019 to 2034
Figure 226: MEA Market Value Share (%) and BPS Analysis by Technology, 2024 to 2034
Figure 227: MEA Market Y-o-Y Growth (%) Projections by Technology, 2024 to 2034
Figure 228: MEA Market Value (US$ Million) Analysis by Product, 2019 to 2034
Figure 229: MEA Market Volume (Units Pack) Analysis by Product, 2019 to 2034
Figure 230: MEA Market Value Share (%) and BPS Analysis by Product, 2024 to 2034
Figure 231: MEA Market Y-o-Y Growth (%) Projections by Product, 2024 to 2034
Figure 232: MEA Market Value (US$ Million) Analysis by Distribution Channel, 2019 to 2034
Figure 233: MEA Market Volume (Units Pack) Analysis by Distribution Channel, 2019 to 2034
Figure 234: MEA Market Value Share (%) and BPS Analysis by Distribution Channel, 2024 to 2034
Figure 235: MEA Market Y-o-Y Growth (%) Projections by Distribution Channel, 2024 to 2034
Figure 236: MEA Market Attractiveness by Material, 2024 to 2034
Figure 237: MEA Market Attractiveness by Technology, 2024 to 2034
Figure 238: MEA Market Attractiveness by Product, 2024 to 2034
Figure 239: MEA Market Attractiveness by Distribution Channel, 2024 to 2034
Figure 240: MEA Market Attractiveness by Country, 2024 to 2034
The ceramic and porcelain tableware market is expected to garner a 4.5% CAGR from 2024 to 2034.
By 2024, the global ceramic and porcelain tableware market is likely to gain USD 7.1 billion.
By 2034, the ceramic and porcelain tableware market valuation is likely to reach a sum of USD 11 billion.
The ceramic and porcelain tableware industry in the United States is likely to garner a 4.8% CAGR during the forecast period.
The bone china ceramic and porcelain tableware solution will gain popularity with a 4.3% CAGR through 2034.
The slip casting technology will be high in demand for ceramic and porcelain tableware with a 4.1% CAGR through 2034.
Explore Similar Insights
Thank you!
You will receive an email from our Business Development Manager. Please be sure to check your SPAM/JUNK folder too.