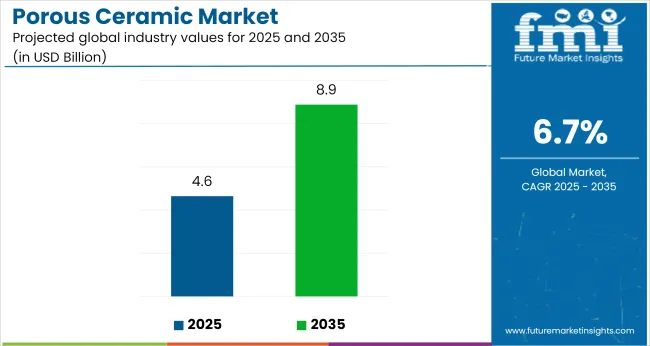
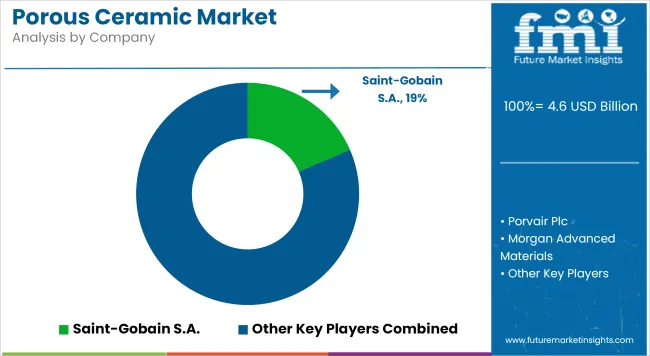
The global porous ceramic market is projected to be valued at USD 4.64 billion in 2025 and is forecast to reach USD 8.88 billion by 2035, expanding at a compound annual growth rate (CAGR) of 6.7% over the forecast period. This growth is being driven by increased usage in filtration, medical, and semiconductor applications requiring high-temperature stability, chemical resistance, and biocompatibility.
| Attributes | Description |
|---|---|
| Estimated Global Industry Size (2025E) | USD 4.64 billion |
| Projected Global Value (2035F) | USD 8.88 billion |
| Value-based CAGR (2025 to 2035) | 6.7% |
In 2024, steady demand was observed across electronics and medical sectors. The use of porous ceramics in fuel cell systems, chip fabrication, and implantable biomedical devices supported volume expansion in North America and Europe.
In semiconductors, filtration media and kiln furniture composed of alumina and silicon carbide were adopted for their dimensional stability and non-contaminating properties during high-purity processing. Ceramic-based implant materials also gained traction due to their favorable biocompatibility and inert behavior in orthopedic and dental applications.
China and India accounted for a significant portion of global demand, supported by infrastructure investments and environmental regulations. The use of ceramic membranes in municipal and industrial water treatment projects increased in response to stricter discharge standards and freshwater recovery mandates. State-sponsored initiatives in wastewater recycling and desalination contributed to regional growth.
The industry encountered material supply constraints, particularly in sintered alumina and silicon carbide. These shortages affected cost structures and extended delivery timelines for high-specification components. Disruptions in the supply chain and raw material price volatility led producers to consider localized sourcing strategies and alternative material compositions.
The integration of additive manufacturing technologies is projected to influence market dynamics significantly. The ability to customize pore size, structural geometry, and material blends using 3D printing is expected to enhance production flexibility and minimize material waste. In aerospace applications, lightweight porous ceramic structures are under evaluation for roles such as insulation, acoustic damping, and catalytic support under demanding operational conditions.
The transition to environmentally aligned production methods is underway. Research is being directed toward recyclable ceramic matrices and low-emission sintering techniques to reduce lifecycle impacts. As regulatory standards evolve across energy, healthcare, and environmental sectors, porous ceramics are expected to gain broader acceptance due to their ability to support performance-driven and sustainability-oriented design objectives.
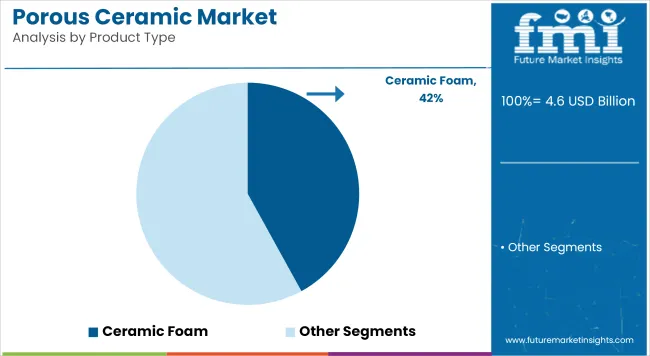
The ceramic foam segment is projected to account for approximately 42% of the global porous ceramic market share in 2025 and is expected to grow at a CAGR of 6.8% through 2035. Known for its high porosity, thermal resistance, and structural integrity, ceramic foam is commonly used in metal casting, hot gas filtration, and thermal insulation.
Industries such as metallurgy, foundry operations, and chemical processing rely on ceramic foams to remove impurities, reduce emissions, and improve process efficiency. Ongoing demand for durable, chemically inert materials that can operate under extreme temperatures is expected to support growth in this segment.
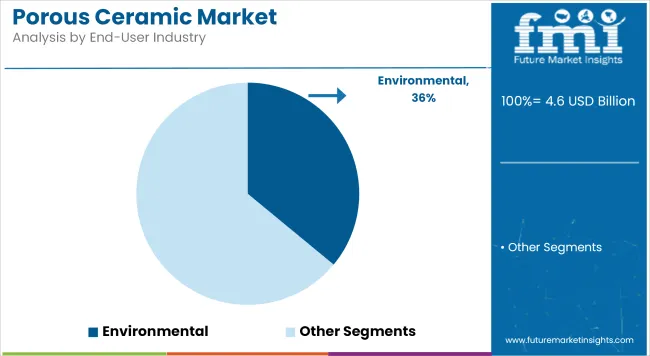
The environmental segment is estimated to hold approximately 36% of the global porous ceramic market share in 2025 and is projected to grow at a CAGR of 6.9% through 2035. Porous ceramics are used in filtration media for wastewater treatment, air pollution control, and catalytic support systems.
Their ability to handle high pressures, resist corrosion, and maintain stability under aggressive chemical conditions makes them suitable for municipal and industrial treatment facilities. As regulations on emissions and water quality tighten globally, especially in Europe and North America, the demand for porous ceramic components in environmental management systems is expected to rise consistently.
Future Market Insights conducted a survey of the porous ceramics industry and held discussions with various end-users, suppliers, and manufacturers in a bid to understand their perspectives on the industry.
More than 65% of the respondents claimed that the growing demand for advanced filtration systems is among the few key factors sustaining the growth of the industry. Industry experts stated that ceramic membranes are gaining preference over polymer-based membranes for water and wastewater treatment.
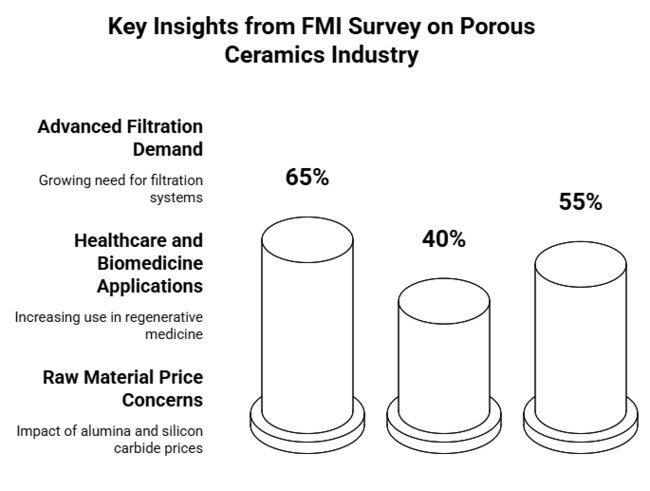
The growing use of these ceramics in healthcare and biomedicine was another key finding of the survey. Almost 40% of industry professionals reported increasing applications of ceramic-based implants and scaffolds in regenerative medicine. The stakeholder also added that the advances in additive manufacturing are helping in improving customization and reducing production costs, thus making ceramic medical parts more viable.
The survey also identified areas of challenge, with supply chain constraints and raw material prices being the key areas of concern. About 55% of respondents cited changes in alumina and silicon carbide prices as a main driver of profit margins. Environmental controls are likely to impact ceramic production more in the future as companies seek sustainable production methods.
| Countries | Regulations & Certifications Impacting the Industry |
|---|---|
| United States | Used for the treatment of the environment controlled by the EPA (i.e., water filter ceramic membranes). Drugs, medical devices, and other biomedical applications require FDA approval. ASTM & ISO specifications control industrial-grade ceramics. |
| United Kingdom | Under UK REACH legislation following Brexit: implications for material sourcing and chemical makeup BSI standards govern ceramics used in medical and industrial applications. |
| France | EU REACH and CE marking for product safety. French Environmental Code strict emission control on ceramic manufacture. Medical ceramics should comply with ANSM. |
| Germany | DIN and EU REACH govern material composition and safety. Firm focus including sustainable production MBO on BImschG (Bundes-Immissionsschutzgesetz): Germany’s emission control legislation. |
| Italy | NORMATIVE UNI (Ente Nazionale Italiano di Unificazione) and EU REACH regulation. Porous ceramics: CE certification required for construction and medical applications. |
| South Korea | K-REACH regulates the chemical substances used in ceramic preparation. The Ministry of Food and Drug Safety (MFDS) approves them, just as it does with medical-grade ceramics. National technology programs drive strong R&D incentives for advanced ceramics. |
| Japan | JIS (Japanese Industrial Standards)-Regulated to JIS for quality control. PMDA (Pharmaceuticals and Medical Devices Agency) certified biomedical ceramics. Controlled environmental conditions by emissions emitted JIS Z 2801 |
| China | Industrial ceramics must obtain CCC (China Compulsory Certification). The National Medical Protection Agency (NMPA) regulates the use of industrial ceramics for medical purposes. |
| Australia & New Zealand | The product meets the ANZ Standard AS/NZ4020 for ceramic parts used in water refurbishing. For use in biomedical goods, it requires Therapeutic Goods Administration certification. Environmental compliance under the National Greenhouse and Energy Reporting Act |
| India | Governed by the Bureau of Indian Standards (BIS). The CDSCO (Central Drugs Standard Control Organization) must approve medical ceramic devices. The CDSCO (Central Drugs Standard Control Organization) has regulations for sustainability to manage emissions in ceramic production. |
The USA industry is expected to grow at a CAGR of 6.9% from 2025 to 2035, slightly above the global average due to increasing demand in medical, electronics, and defence industries. The nation's strong R&D setup, especially in biomedical applications, has driven the use of ceramic-based implants and scaffolds.
Furthermore, strict EPA guidelines on industrial filtration are boosting the application of ceramic membranes to treat wastewater. These ceramics play a crucial role in high-end chip production for the semiconductor industry. High energy prices and supply chain risks might, however, affect production expenses. Government support of clean technologies like fuel cells and advanced filtering technologies will be another driver that continues to drive the industry higher.
The UK's industry is forecasted to have a CAGR of 6.5% over the period from 2025 to 2035. Demand for biomedical ceramics in dentures and implants is a leading driver of growth. Post-Brexit policies, specifically UK REACH, have added relatively little to the costs of manufacturers but provided scope for domestic suppliers to increase their industry share.
The increasing focus on sustainability in the environment has seen increased uptake of ceramic membranes for industrial emissions control and filtration. In addition, the UK aerospace sector has been incorporating porous ceramics into fuel-efficient, lightweight components. While there is strong industry potential, supply chain issues caused by geopolitical uncertainties could pose a challenge in the future.
France's industry will grow at a CAGR of 6.4% between 2025 and 2035, led by growing adoption in medical devices, environmental use, and defence technology. France's stringent emission control regulations under the French Environmental Code are encouraging industries to move toward ceramic-based filtration systems. France is also a player in the advanced ceramics for aerospace and nuclear applications with continuous investment in heat-resistant material research.
With help from the ANSM (Agence Nationale de Sécurité du Médicament), the health sector is growing, which is speeding up the development of these ceramics for implants and bone implants. Yet high production expenses and reliance on foreign raw materials could affect growth. However, government support for sustainable materials innovation will mitigate these challenges.
Germany's industry is anticipated to expand during 2025 to 2035 at a CAGR of 6.8% due to the presence of a robust manufacturing industry and technological innovations. High-quality standards as per DIN and EU REACH regulations place Germany among the largest exporters of these ceramics, especially for industrial filtration and automotive industries. The nation's drive toward green energy and hydrogen fuel cells has also increased demand for porous ceramics in energy storage and conversion technologies.
Furthermore, the BImSchG environmental law encourages industries to implement cleaner, more efficient filtration systems, thereby supporting the industry. Agreed, economic downturns and high energy prices have impacted industries, but Germany's heavy investment in R&D and automation in the manufacture of ceramics should be enough to keep the industry growing during the forecast period.
Italy is anticipated to see a CAGR of 6.3% in the industry for ceramics between 2025 and 2035, just marginally less than the world average because of economic uncertainty and dependencies on supply chains. The building industry continues to be a dominant driver, with higher applications of these ceramics for insulation and soundproofing purposes. Italy's automotive sector, a strong economic sector, is incorporating advanced ceramics for lightweight parts in electric vehicles.
Additionally, EU sustainability policies are nudging industries toward the use of ceramic filtration systems as a means of controlling emissions. The medical industry is also growing, with CE-marked ceramics utilized in orthopedics and dental implants. However, volatility in raw material pricing and tight environmental regulation can be challenges to manufacturers.
South Korea's industry will grow at a CAGR of 7.1% from 2025 to 2035, surpassing the global average due to its strong electronics and semiconductor sector. The K-REACH regulations of the country have spurred investment in high-tech ceramic materials for industrial use. South Korea's healthcare industry is also quickly adopting these ceramics for orthopedic implants and regenerative medicine.
Furthermore, the South Korean government's hydrogen economy drive has spurred research in ceramic-based fuel cell technologies. Despite its significant reliance on raw material imports, South Korea's investment in ceramic 3D printing and nano-ceramic technologies is poised to establish it as a significant player in the global industry.
Japan's industry is set to grow at a CAGR of 6.7% during 2025 to 2035, following global trends. The nation's JIS standards guarantee high quality and precision, and Japan is a leader in high-performance industrial ceramics. PMDA approvals for medical ceramics have led to the extensive use of porous materials in dental and orthopaedic applications.
Energy-efficient filtration systems are also a focus in Japan, with significant investments in ceramic membrane technologies. The automotive and aerospace sectors are incorporating lightweight for enhanced fuel efficiency and durability. Though domestic demand can be slowed by an aging population and stagnating economy, exports to Southeast Asia and Europe are projected to lead overall growth.
Between 2025 and 2035, projections indicate that China will expand at the highest rate among major industries, with a 7.3% CAGR. The Made in China 2025 program is fueling major investment in advanced materials, such as ceramics for industrial and medical uses. The CCC certification guarantees the quality and safety of the product, while stringent regulations by the NMPA for medical ceramics are prompting companies to enhance product innovation.
The rapid urbanization of China and its water shortage problems have increased the demand for ceramic filtration membranes for wastewater treatment. The country is also a major provider of raw materials for these ceramics, which confers an advantage in cost on Chinese companies against their competitors. Nevertheless, environmental regulations and trade barriers may affect the scalability of production in the future.
The Australia-New Zealand industry is projected to expand at a CAGR of 6.2% between 2025 and 2035, just below the world average owing to a relatively small industrial base. Nevertheless, applications in water filtration are a strong growth driver with support from AS/NZS 4020 standards for drinking water systems.
Strict adherence under Therapeutic Goods Administration (TGA) regulations opens prospects for biomedical ceramics in dental implants and orthopaedic devices. Even with minimum domestic production, greater imports of ceramics from China, Japan, and the United States are proving to support demand. Incentives from the government on clean technologies, such as those involving fuel cells with ceramic materials, are also backing adoption.
Rapid Industrialization and infrastructure growth will drive India's industry to a 7.0% CAGR from 2025 to 2035. The BIS certification upholds quality standards, and the CDSCO approval process is driving demand for medical ceramics. Water filtering and air filtering are key industries growing, led by increasing concerns for pollution leading to adoption.
Furthermore, the automotive sector is using these ceramics as lightweight, heat-resistant materials. The Indian government's "Make in India" program is also drawing in foreign investment in ceramic production. But raw material price volatility and the cost of energy can be an issue in the long term.
The industry is segmented into ceramic honeycombs, ceramic foam, ceramic membranes, and others.
It is segmented into chemical, oil & gas, environmental, and others.
The industry is fragmented among North America, Latin America, Europe, East Asia, South Asia, Oceania, and Middle East & Africa (MEA).
They find applications in filtration, catalysis, biomedical implants, energy storage, and insulation at high temperatures.
Tougher emission regulation, water treatment, and industrial safety legislation are spurring increased uptake worldwide.
The industries of hydrogen power, electric cars, semiconductor production, and sewage treatment are experiencing rapid growth.
High cost of production, brittleness of materials, and scalability are challenges to broader adoption.
3D printing, AI-optimized material, and nanostructured coatings are increasing efficiency and durability.


Our Research Products

The "Full Research Suite" delivers actionable market intel, deep dives on markets or technologies, so clients act faster, cut risk, and unlock growth.

The Leaderboard benchmarks and ranks top vendors, classifying them as Established Leaders, Leading Challengers, or Disruptors & Challengers.

Locates where complements amplify value and substitutes erode it, forecasting net impact by horizon

We deliver granular, decision-grade intel: market sizing, 5-year forecasts, pricing, adoption, usage, revenue, and operational KPIs—plus competitor tracking, regulation, and value chains—across 60 countries broadly.

Spot the shifts before they hit your P&L. We track inflection points, adoption curves, pricing moves, and ecosystem plays to show where demand is heading, why it is changing, and what to do next across high-growth markets and disruptive tech

Real-time reads of user behavior. We track shifting priorities, perceptions of today’s and next-gen services, and provider experience, then pace how fast tech moves from trial to adoption, blending buyer, consumer, and channel inputs with social signals (#WhySwitch, #UX).

Partner with our analyst team to build a custom report designed around your business priorities. From analysing market trends to assessing competitors or crafting bespoke datasets, we tailor insights to your needs.
Supplier Intelligence
Discovery & Profiling
Capacity & Footprint
Performance & Risk
Compliance & Governance
Commercial Readiness
Who Supplies Whom
Scorecards & Shortlists
Playbooks & Docs
Category Intelligence
Definition & Scope
Demand & Use Cases
Cost Drivers
Market Structure
Supply Chain Map
Trade & Policy
Operating Norms
Deliverables
Buyer Intelligence
Account Basics
Spend & Scope
Procurement Model
Vendor Requirements
Terms & Policies
Entry Strategy
Pain Points & Triggers
Outputs
Pricing Analysis
Benchmarks
Trends
Should-Cost
Indexation
Landed Cost
Commercial Terms
Deliverables
Brand Analysis
Positioning & Value Prop
Share & Presence
Customer Evidence
Go-to-Market
Digital & Reputation
Compliance & Trust
KPIs & Gaps
Outputs
Full Research Suite comprises of:
Market outlook & trends analysis
Interviews & case studies
Strategic recommendations
Vendor profiles & capabilities analysis
5-year forecasts
8 regions and 60+ country-level data splits
Market segment data splits
12 months of continuous data updates
DELIVERED AS:
PDF EXCEL ONLINE
Ceramic to Metal Assemblies Market Size and Share Forecast Outlook 2025 to 2035
Porous Plastic Tubes Market Size and Share Forecast Outlook 2025 to 2035
Ceramic Textile Market Size and Share Forecast Outlook 2025 to 2035
Ceramic and Porcelain Tableware Market Size and Share Forecast Outlook 2025 to 2035
Ceramic Matrix Composites Market Size and Share Forecast Outlook 2025 to 2035
Ceramic Frit Market Size and Share Forecast Outlook 2025 to 2035
Ceramic Substrates Market Size and Share Forecast Outlook 2025 to 2035
Ceramic 3D Printing Market Size and Share Forecast Outlook 2025 to 2035
Ceramic Injection Molding Market Size and Share Forecast Outlook 2025 to 2035
Ceramic Tableware Market Size and Share Forecast Outlook 2025 to 2035
Porous Metal Sheet Market Analysis Size and Share Forecast Outlook 2025 to 2035
Ceramic Paper Market Size and Share Forecast Outlook 2025 to 2035
Ceramic Balls Market Size and Share Forecast Outlook 2025 to 2035
Ceramic Tester Market Size and Share Forecast Outlook 2025 to 2035
Ceramic Membranes Market Analysis - Size, Share and Forecast Outlook 2025 to 2035
Ceramic Barbeque Grill Market Analysis - Size, Share, and Forecast Outlook 2025 to 2035
Ceramic Tiles Market Growth & Trends 2025 to 2035
Ceramic Sanitary Ware Market Trends & Forecast 2025 to 2035
Ceramic Transducers Market Growth - Trends & Forecast 2025 to 2035
Leading Providers & Market Share in Ceramic Barbeque Grill Industry

Thank you!
You will receive an email from our Business Development Manager. Please be sure to check your SPAM/JUNK folder too.
Chat With
MaRIA