Reports

- Global Locations -

Headquarters

Future Market Insights, Inc.

Christiana Corporate, 200
Continental Drive, Suite 401,
Newark, Delaware - 19713,
United States

T: +1-845-579-5705

Americas

Future Market Insights, Inc.

616 Corporate Way, Suite 2-9018,
Valley Cottage, NY 10989, United States

T: +1-347-918-3531

MEA

Future Market Insights

1602-6 Jumeirah Bay X2 Tower, Plot No: JLT-PH2-X2A,
Jumeirah Lakes Towers, Dubai,
United Arab Emirates

Europe

Future Market Insights

3rd Floor, 207 Regent Street,
W1B 3HH London
United Kingdom

T: + 44 (0) 20 8123 9659
D: +44 (0) 20 3287 4268

Asia Pacific

Future Market Insights

IndiaLand Global Tech Park, Unit UG-1, Behind Grand HighStreet, Phase 1, Hinjawadi, MH, Pune – 411057, India

High-End Performance Packaging Market Outlook (2023 to 2033)

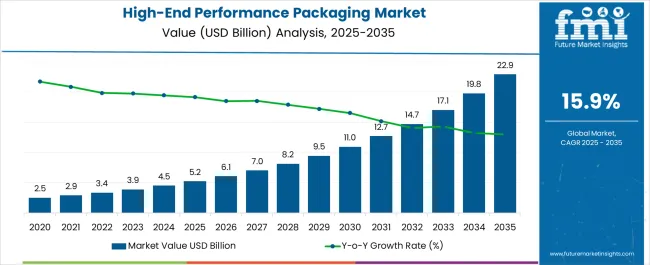
The global high-end performance packaging market size reached US$ 3.3 billion in 2022. Total sales of high-end performance packaging will rise at 15.9% CAGR between 2023 and 2033. By the end of 2033, total market valuation will reach around US$ 17.0 billion.

The worldwide high-end performance packaging market value is set to reach US$ 3.9 billion by 2033. By technology, UHD FO will remain the top revenue-generating category. It will expand at a CAGR of over 15.8% during the assessment period (2023 to 2033).

  • Growing applications in high-performance computing to boost market
  • Rapid penetration of miniaturization and digitalization to elevate demand
  • Rising adoption of advanced packaging technologies to fuel sales
  • Surging demand for compact and ultra-thin consumer electronic devices will drive the market
  • Increasing popularity of autonomous vehicles to generate opportunities for high-end performance packaging manufacturers

In recent years, rising need for miniaturized electronic devices with cost-efficient manufacturing has brought high-end performance packaging market into limelight. Besides this, markets fan-out wafer level packaging market is also witnessing robust growth.

High-end performance packaging has become an ideal solution for designing next-generation ICs. These ICs are being utilized in data centers, autonomous vehicles, and consumer electronics.

Adoption of high-end performance packaging enables companies to develop compact, cost-effective, and efficient electronic components and systems. High-end performance packaging technologies provide greater performance in a smaller footprint.
Rapid shift towards system-in-package (SIP) and heterogeneous integration will boost the global market.

Advanced packaging solutions including high-end performance are less expensive, offer reduced latency, and improve system performance. Growing application of high-end performance packaging in high-performance computing and ADAS (advanced driving assistance systems) will create growth prospects for the market.

Asia Pacific will continue its dominance over the global market through 2033. Asia Pacific high-end performance packaging market will reach US$ 1.90 billion in 2023. By 2033, Asia Pacific market is set to be valued at US$ 8.3 billion by 2033.

Booming semiconductor sector and increasing adoption of advanced packaging technologies will drive Asia Pacific market.

Large presence of leading manufacturers and providers of high-end electronic packaging systems is also influencing sales in the market. China-based companies such as JCET group provide system in package, fan out wafer packaging technologies, and system-on-chip technology.

Attributes Key Insights
High-End Performance Packaging Market Estimated Value (2023) US$ 3.9 billion
Projected Market Value (2033) US$ 17.0 billion
Value-based CAGR (2023 to 2033) 15.9%
USA Market CAGR (2023 to 2033) 15.2%

Don't pay for what you don't need

Customize your report by selecting specific countries or regions and save 30%!

Global High-End Performance Packaging Sales Outlook Compared to Demand Forecast from 2023 to 2033

Global sales of high-end performance packaging grew at 19.2% CAGR from 2018 to 2022. At the end of 2022, total market valuation reached US$ 3.3 billion.

Between 2023 and 2033, global high-end performance packaging demand will rise at 15.9% CAGR. The worldwide market for high-end performance will create an absolute $ opportunity of US$ 13.1 billion.

High-end performance packaging in semiconductors plays an important role in protecting the chips from surrounding environment. It also ensures that there is an electrical connection between chip mounts on electrical boards.

The high-end performance packaging technology involves Ultra High Density Fan-Out (UHD FO) packaging technology, High Bandwidth Memory (HBM) packaging, 3DNAND, Co-EMIB, Si interposer packaging, 3D System on chip (SOC), and Foveros.

The applications of Ultra High Density Fan Out (UHD FO) packaging are in cloud computing technology, 5G telecommunication, autonomous cars, and Artificial Intelligence chips.

The High Bandwidth Memory (HBM) is the standard DRAM that helps in achieving 256 GBps bandwidth and reduces power consumption of the semiconductor devices circuitry. This packaging technology helps in lesser power consumption and more clock speed.

The 3D System on Chip integration system allows reduction of the circuit elements and thus makes the electronics circuit thinner and more compact. For instance, the Department of Defense (DOD) uses 3D SOC technology which aids 50X better performance and yields better output results.

Foveros by Intel is one of its kinds of technology that provide 3D stacking solution and helps in power efficiency and cost optimization. The compact structures of semiconductors make them fit in autonomous vehicles’ electronics circuitry. The EMIB and Co-EMIB are used in high performance computing and data center networking.
Comparative Analysis of Adjacent Markets

Advanced Packaging Market:

Differentiating Aspects Advanced Packaging Market
CAGR in 2023 to 2033 7.2%
Current Valuation in 2023 US$ 30.5 billion
Demand Drivers
  • Rising need for compact and efficient electronic devices and systems will boost market.
  • Growing popularity of fan-out wafer level packaging to fuel sales over the next ten years.

Photonics Market:

Differentiating Aspects Photonics Market
CAGR in 2023 to 2033 5.8%
Current Valuation in 2023 US$ 911.5 billion
Demand Drivers
  • Rising applications in displays and lighting will drive the global photonic market.
  • Ongoing advancements in photonics for exploring new application areas will boost market.
Sudip Saha
Sudip Saha

Principal Consultant

Talk to Analyst

Find your sweet spots for generating winning opportunities in this market.

Country-wise Insights

Country United States
Projected CAGR (2023 to 2033) 15.2%
Historical CAGR (2018 to 2022) 15.8%
Market Value (2033) US$ 2.8 billion
Country United Kingdom
Projected CAGR (2023 to 2033) 14.2%
Historical CAGR (2018 to 2022) 14.2%
Market Value (2033) US$ 452.1 million
Country China
Projected CAGR (2023 to 2033) 17.4%
Historical CAGR (2018 to 2022) 21.5%
Market Value (2033) US$ 4.3 billion
Country Japan
Projected CAGR (2023 to 2033) 16.1%
Historical CAGR (2018 to 2022) 19.4%
Market Value (2033) US$ 2.7 billion
Country South Korea
Projected CAGR (2023 to 2033) 16.4%
Historical CAGR (2018 to 2022) 20.8%
Market Value (2033) US$ 1.0 billion

How is the United States High-End Performance Packaging Market Shaping?

High Adoption of Advanced Packaging Technologies Boosting Sales in the United States

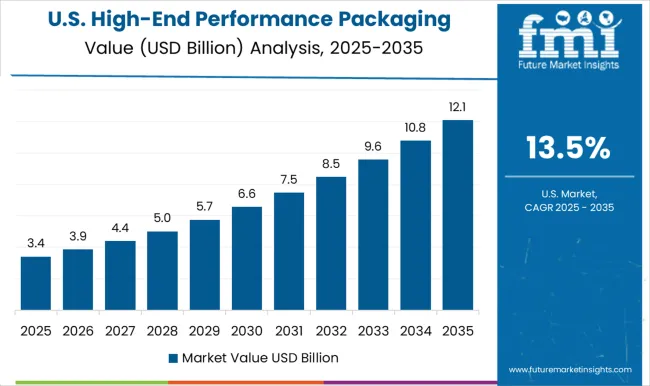
The USA high-end performance packaging market is set to expand at 15.2% CAGR through 2033. By 2033, total market size in the United States will reach US$ 2.8 billion.

Overall high-end performance packaging demand in the USA will create an absolute $ opportunity of US$ 2.1 billion by 2033. The USA market grew at 15.8% CAGR from 2018 to 2022.

Growing inclination towards using advanced packaging technologies is driving the United States market. Subsequently, rising popularity of high-performance computing will propel high-end performance packaging demand.

Large presence of high-end performance packaging manufacturers is another factor boosting market development. Several USA-based companies are developing new technologies and putting efforts to advance in packaging technologies.

For instance, in July 2021, Intel Corporation, the United States-based company announced that it has developed a clear roadmap till 2025 for processes and packaging technology showcasing a series of innovations.

Such advancements in high-end performance packaging sector in the United States are helping the market to thrive rapidly.

How Will Growth Unfold in the United Kingdom High-End Performance Packaging Market?

Rapid Shift Towards High-Performance Computing Boosting the United Kingdom Market

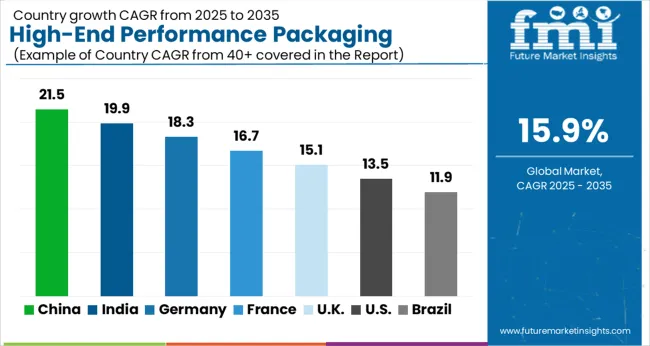
The United Kingdom high-end performance packaging market is set to reach US$ 452.1 million in 2023. Between 2023 and 2033, demand for high-end performance packaging in the country will rise at 14.2% CAGR. Rising popularity of high-performance computing and expansion of IT & telecommunication sector are driving the United Kingdom market.

To meet growing demand, companies are developing new innovative solutions. For instance, in September 2019, ARM, a leading United Kingdom-based electronics manufacturer along with TSMC announced that they have developed industry’s first 7nm ARM-based CoWoS chiplets for high performance computing.

They have demonstrated technologies for developing a system on chip with ARM based technology operating at a 4GHz in a 7 FinFET process. This will aid in the expansion of the market.

Why is China Emerging as a Key Market for High-End Performance Packaging?

Growing Trend of Miniaturization Creating High-End Performance Packaging Demand in China

China’s high-end performance packaging market will progress at 17.4% CAGR through 2033. Total market size in China is slated to reach US$ 4.3 billion by 2033.

As per the study, high-end performance packaging demand in China will create an absolute $ opportunity of US$ 3.5 billion. Increasing penetration of miniaturization supported by surging need for compact electronic devices is driving the market in China.

Similarly, heavy presence of the world’s leading semiconductor and consumer electronics companies will elevate high-end performance packaging demand in China.

Leading China-based high-end performance packaging manufacturers and providers such as JCET Group offer advanced packaging technologies such as wire bond packaging, flip flop packaging, wafer level packaging, system in packages.

JCET’s XDFOI technology supports integration of multiple chips and high bandwidth memory with cost optimization features. This is positively impacting the market expansion.

Category-wise Insights

Which Application Holds Most Growth Potential for the High-End Performance Packaging Industry?

By application the global market for high-end performance packaging is segmented into data center networking, high performance computing, and autonomous vehicles. Among these, high performance computing segment will lead the market.

FMI predicts applications of high-end performance packaging in high performance computing sector to increase at an impressive CAGR of 15.7% during the assessment period. From 2018 to 2022, the target segment grew at 18.5% CAGR.

Growth of the target segment is due to growing usage of high-end performance packaging for designing high energy-efficient systems for high performance computing applications.

In recent years, advanced heterogenous packaging solutions such as high-end performance packaging has made full entrance into high-performance computing sector. They enable users to achieve high speed and high performance by designing compact and energy-efficient systems.
Get the data you need at a Fraction of the cost

Personalize your report by choosing insights you need
and save 40%!

Competitive Landscape

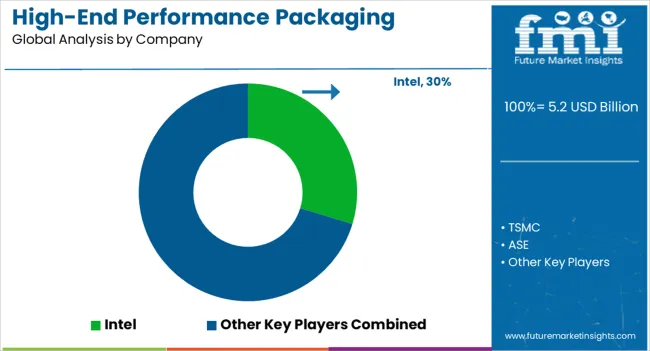
Key high-end performance packaging companies include Intel, TSMC, ASE, Samsung, Amkor, JCET Group, Tongfu, ADI, AMD, and ARM. These leading high-end performance packaging manufacturers are developing advanced packaging solutions.

They are also forming alliances, partnerships, and collaborations. Besides this, they are acquiring other companies to gain a competitive edge in the market.

Recent Developments:

  • In December 2022, TSMC, a leading Taiwan-based chipmaker and high-end performance packaging provider started the production of the most advanced chips in its manufacturing facilities in Taiwan. The company is manufacturing 2 nano-meter chips and is building large facilities for high volume production.
  • In December 2022, TSMC announced that it has started building the second fabrication facility in Arizona to manufacture the chiplets essential for the USA semiconductor industry.
  • In March 2022, Intel Corporation, the United States-based technology company announced the acquisition of Granulate Cloud Solutions Ltd which is an Israel-based developer of real time continuous optimization software.

Scope of the Report

Attribute Details
Estimated Market Size (2023) US$ 3.9 billion
Projected Market Size (2033) US$ 17 billion
Anticipated Growth Rate (2023 to 2033) 15.9% CAGR
Forecast Period 2023 to 2033
Historical Data Available for 2018 to 2022
Market Analysis US$ Million for Value and MT for Volume
Key Regions Covered North America, Latin America, Europe, Asia Pacific, and the Middle East & Africa
Key Countries Covered United States, Canada, Brazil, Mexico, Germany, United Kingdom, France, Italy, Spain, Nordic, Russia, Poland, China, India, Thailand, Indonesia, Australia and New Zealand, Japan, GCC countries, North Africa, South Africa, and others.
Key Segments Covered Technology, Application, and Region
Key Companies Profiled
  • Intel
  • TSMC
  • ASE
  • Samsung
  • Amkor
  • JCET Group
  • Tongfu
  • ADI
  • AMD
  • ARM
Report Coverage Market Forecast, Company Share Analysis, Competition Intelligence, Drivers Restraints Opportunity Trends Analysis, Market Dynamics and Challenges, and Strategic Growth Initiatives

Global High-End Performance Packaging Market Segmentation

By Technology:

  • UHD FO
  • HBM
  • 3DS
  • Foveros
  • 3DNAND
  • Co-EMIB
  • EMIB
  • Si interposer
  • 3D SOC

By Application:

  • Data Center Networking
  • High Performance Computing
  • Autonomous Vehicles

By Region:

  • North America
  • Europe
  • Asia Pacific
  • Latin America
  • Middle East & Africa

Frequently Asked Questions

What is the Present Market Value in 2023?

The market is valued at US$ 3.9 billion in 2023.

What is the Market Growth Outlook?

The market is estimated to record a 15.9% CAGR rate through 2033.

How did the Market Perform Historically?

From 2018 to 2022, the market expanded at a 19.2% CAGR.

What is the Growth Rate of the Market in China?

China is likely to expand at a 17.4% CAGR through 2033.

Who are the Prominent Market Players?

Intel, TSMC, and ASE are the prominent market players.

Table of Content

1. Executive Summary | High-End Performance Packaging Market

    1.1. Global Market Outlook

    1.2. Demand-side Trends

    1.3. Supply-side Trends

    1.4. Technology Roadmap Analysis

    1.5. Analysis and Recommendations

2. Market Overview

    2.1. Market Coverage / Taxonomy

    2.2. Market Definition / Scope / Limitations

3. Market Background

    3.1. Market Dynamics

        3.1.1. Drivers

        3.1.2. Restraints

        3.1.3. Opportunity

        3.1.4. Trends

    3.2. Scenario Forecast

        3.2.1. Demand in Optimistic Scenario

        3.2.2. Demand in Likely Scenario

        3.2.3. Demand in Conservative Scenario

    3.3. Opportunity Map Analysis

    3.4. Investment Feasibility Matrix

    3.5. PESTLE and Porter’s Analysis

    3.6. Regulatory Landscape

        3.6.1. By Key Regions

        3.6.2. By Key Countries

    3.7. Regional Parent Market Outlook

4. Global Market Analysis 2018 to 2022 and Forecast, 2023 to 2033

    4.1. Historical Market Size Value (US$ Million) Analysis, 2018 to 2022

    4.2. Current and Future Market Size Value (US$ Million) Projections, 2023 to 2033

        4.2.1. Y-o-Y Growth Trend Analysis

        4.2.2. Absolute $ Opportunity Analysis

5. Global Market Analysis 2018 to 2022 and Forecast 2023 to 2033, By Technology

    5.1. Introduction / Key Findings

    5.2. Historical Market Size Value (US$ Million) Analysis By Technology, 2018 to 2022

    5.3. Current and Future Market Size Value (US$ Million) Analysis and Forecast By Technology, 2023 to 2033

        5.3.1. UHD FO

        5.3.2. HBM

        5.3.3. 3DS

        5.3.4. Foveros

        5.3.5. 3DNAND

        5.3.6. Co-EMIB

        5.3.7. EMIB

        5.3.8. Si Interposer

        5.3.9. 3D SoC

    5.4. Y-o-Y Growth Trend Analysis By Technology, 2018 to 2022

    5.5. Absolute $ Opportunity Analysis By Technology, 2023 to 2033

6. Global Market Analysis 2018 to 2022 and Forecast 2023 to 2033,By Application

    6.1. Introduction / Key Findings

    6.2. Historical Market Size Value (US$ Million) Analysis By Application, 2018 to 2022

    6.3. Current and Future Market Size Value (US$ Million) Analysis and Forecast By Application, 2023 to 2033

        6.3.1. Data Center Networking

        6.3.2. High-Performance Computing

        6.3.3. Autonomous Vehicles

    6.4. Y-o-Y Growth Trend Analysis By Application, 2018 to 2022

    6.5. Absolute $ Opportunity Analysis By Application, 2023 to 2033

7. Global Market Analysis 2018 to 2022 and Forecast 2023 to 2033,By Region

    7.1. Introduction

    7.2. Historical Market Size Value (US$ Million) Analysis By Region, 2018 to 2022

    7.3. Current Market Size Value (US$ Million) Analysis and Forecast By Region, 2023 to 2033

        7.3.1. North America

        7.3.2. Latin America

        7.3.3. Europe

        7.3.4. Asia Pacific

        7.3.5. Middle East & Africa

    7.4. Market Attractiveness Analysis By Region

8. North America Market Analysis 2018 to 2022 and Forecast 2023 to 2033,By Country

    8.1. Historical Market Size Value (US$ Million) Trend Analysis By Market Taxonomy, 2018 to 2022

    8.2. Market Size Value (US$ Million) Forecast By Market Taxonomy, 2023 to 2033

        8.2.1. By Country

            8.2.1.1. USA

            8.2.1.2. Canada

        8.2.2. By Technology

        8.2.3. By Application

    8.3. Market Attractiveness Analysis

        8.3.1. By Country

        8.3.2. By Technology

        8.3.3. By Application

    8.4. Key Takeaways

9. Latin America Market Analysis 2018 to 2022 and Forecast 2023 to 2033, By Country

    9.1. Historical Market Size Value (US$ Million) Trend Analysis By Market Taxonomy, 2018 to 2022

    9.2. Market Size Value (US$ Million) Forecast By Market Taxonomy, 2023 to 2033

        9.2.1. By Country

            9.2.1.1. Brazil

            9.2.1.2. Mexico

            9.2.1.3. Rest of Latin America

        9.2.2. By Technology

        9.2.3. By Application

    9.3. Market Attractiveness Analysis

        9.3.1. By Country

        9.3.2. By Technology

        9.3.3. By Application

    9.4. Key Takeaways

10. Europe Market Analysis 2018 to 2022 and Forecast 2023 to 2033,By Country

    10.1. Historical Market Size Value (US$ Million) Trend Analysis By Market Taxonomy, 2018 to 2022

    10.2. Market Size Value (US$ Million) Forecast By Market Taxonomy, 2023 to 2033

        10.2.1. By Country

            10.2.1.1. Germany

            10.2.1.2. United Kingdom

            10.2.1.3. France

            10.2.1.4. Spain

            10.2.1.5. Italy

            10.2.1.6. Rest of Europe

        10.2.2. By Technology

        10.2.3. By Application

    10.3. Market Attractiveness Analysis

        10.3.1. By Country

        10.3.2. By Technology

        10.3.3. By Application

    10.4. Key Takeaways

11. Asia Pacific Market Analysis 2018 to 2022 and Forecast 2023 to 2033,By Country

    11.1. Historical Market Size Value (US$ Million) Trend Analysis By Market Taxonomy, 2018 to 2022

    11.2. Market Size Value (US$ Million) Forecast By Market Taxonomy, 2023 to 2033

        11.2.1. By Country

            11.2.1.1. China

            11.2.1.2. Japan

            11.2.1.3. South Korea

            11.2.1.4. Singapore

            11.2.1.5. Thailand

            11.2.1.6. Indonesia

            11.2.1.7. Australia

            11.2.1.8. New Zealand

            11.2.1.9. Rest of Asia Pacific

        11.2.2. By Technology

        11.2.3. By Application

    11.3. Market Attractiveness Analysis

        11.3.1. By Country

        11.3.2. By Technology

        11.3.3. By Application

    11.4. Key Takeaways

12. Middle East & Africa Market Analysis 2018 to 2022 and Forecast 2023 to 2033, By Country

    12.1. Historical Market Size Value (US$ Million) Trend Analysis By Market Taxonomy, 2018 to 2022

    12.2. Market Size Value (US$ Million) Forecast By Market Taxonomy, 2023 to 2033

        12.2.1. By Country

            12.2.1.1. GCC Countries

            12.2.1.2. South Africa

            12.2.1.3. Israel

            12.2.1.4. Rest of Middle East & Africa

        12.2.2. By Technology

        12.2.3. By Application

    12.3. Market Attractiveness Analysis

        12.3.1. By Country

        12.3.2. By Technology

        12.3.3. By Application

    12.4. Key Takeaways

13. Key Countries Market Analysis

    13.1. USA

        13.1.1. Pricing Analysis

        13.1.2. Market Share Analysis, 2023

            13.1.2.1. By Technology

            13.1.2.2. By Application

    13.2. Canada

        13.2.1. Pricing Analysis

        13.2.2. Market Share Analysis, 2023

            13.2.2.1. By Technology

            13.2.2.2. By Application

    13.3. Brazil

        13.3.1. Pricing Analysis

        13.3.2. Market Share Analysis, 2023

            13.3.2.1. By Technology

            13.3.2.2. By Application

    13.4. Mexico

        13.4.1. Pricing Analysis

        13.4.2. Market Share Analysis, 2023

            13.4.2.1. By Technology

            13.4.2.2. By Application

    13.5. Germany

        13.5.1. Pricing Analysis

        13.5.2. Market Share Analysis, 2023

            13.5.2.1. By Technology

            13.5.2.2. By Application

    13.6. United Kingdom

        13.6.1. Pricing Analysis

        13.6.2. Market Share Analysis, 2023

            13.6.2.1. By Technology

            13.6.2.2. By Application

    13.7. France

        13.7.1. Pricing Analysis

        13.7.2. Market Share Analysis, 2023

            13.7.2.1. By Technology

            13.7.2.2. By Application

    13.8. Spain

        13.8.1. Pricing Analysis

        13.8.2. Market Share Analysis, 2023

            13.8.2.1. By Technology

            13.8.2.2. By Application

    13.9. Italy

        13.9.1. Pricing Analysis

        13.9.2. Market Share Analysis, 2023

            13.9.2.1. By Technology

            13.9.2.2. By Application

    13.10. China

        13.10.1. Pricing Analysis

        13.10.2. Market Share Analysis, 2023

            13.10.2.1. By Technology

            13.10.2.2. By Application

    13.11. Japan

        13.11.1. Pricing Analysis

        13.11.2. Market Share Analysis, 2023

            13.11.2.1. By Technology

            13.11.2.2. By Application

    13.12. South Korea

        13.12.1. Pricing Analysis

        13.12.2. Market Share Analysis, 2023

            13.12.2.1. By Technology

            13.12.2.2. By Application

    13.13. Singapore

        13.13.1. Pricing Analysis

        13.13.2. Market Share Analysis, 2023

            13.13.2.1. By Technology

            13.13.2.2. By Application

    13.14. Thailand

        13.14.1. Pricing Analysis

        13.14.2. Market Share Analysis, 2023

            13.14.2.1. By Technology

            13.14.2.2. By Application

    13.15. Indonesia

        13.15.1. Pricing Analysis

        13.15.2. Market Share Analysis, 2023

            13.15.2.1. By Technology

            13.15.2.2. By Application

    13.16. Australia

        13.16.1. Pricing Analysis

        13.16.2. Market Share Analysis, 2023

            13.16.2.1. By Technology

            13.16.2.2. By Application

    13.17. New Zealand

        13.17.1. Pricing Analysis

        13.17.2. Market Share Analysis, 2023

            13.17.2.1. By Technology

            13.17.2.2. By Application

    13.18. GCC Countries

        13.18.1. Pricing Analysis

        13.18.2. Market Share Analysis, 2023

            13.18.2.1. By Technology

            13.18.2.2. By Application

    13.19. South Africa

        13.19.1. Pricing Analysis

        13.19.2. Market Share Analysis, 2023

            13.19.2.1. By Technology

            13.19.2.2. By Application

    13.20. Israel

        13.20.1. Pricing Analysis

        13.20.2. Market Share Analysis, 2023

            13.20.2.1. By Technology

            13.20.2.2. By Application

14. Market Structure Analysis

    14.1. Competition Dashboard

    14.2. Competition Benchmarking

    14.3. Market Share Analysis of Top Players

        14.3.1. By Regional

        14.3.2. By Technology

        14.3.3. By Application

15. Competition Analysis

    15.1. Competition Deep Dive

        15.1.1. Intel

            15.1.1.1. Overview

            15.1.1.2. Product Portfolio

            15.1.1.3. Profitability by Market Segments

            15.1.1.4. Sales Footprint

            15.1.1.5. Strategy Overview

                15.1.1.5.1. Marketing Strategy

        15.1.2. TSMC

            15.1.2.1. Overview

            15.1.2.2. Product Portfolio

            15.1.2.3. Profitability by Market Segments

            15.1.2.4. Sales Footprint

            15.1.2.5. Strategy Overview

                15.1.2.5.1. Marketing Strategy

        15.1.3. ASE

            15.1.3.1. Overview

            15.1.3.2. Product Portfolio

            15.1.3.3. Profitability by Market Segments

            15.1.3.4. Sales Footprint

            15.1.3.5. Strategy Overview

                15.1.3.5.1. Marketing Strategy

        15.1.4. Samsung

            15.1.4.1. Overview

            15.1.4.2. Product Portfolio

            15.1.4.3. Profitability by Market Segments

            15.1.4.4. Sales Footprint

            15.1.4.5. Strategy Overview

                15.1.4.5.1. Marketing Strategy

        15.1.5. Amkor

            15.1.5.1. Overview

            15.1.5.2. Product Portfolio

            15.1.5.3. Profitability by Market Segments

            15.1.5.4. Sales Footprint

            15.1.5.5. Strategy Overview

                15.1.5.5.1. Marketing Strategy

        15.1.6. JCET Group

            15.1.6.1. Overview

            15.1.6.2. Product Portfolio

            15.1.6.3. Profitability by Market Segments

            15.1.6.4. Sales Footprint

            15.1.6.5. Strategy Overview

                15.1.6.5.1. Marketing Strategy

        15.1.7. Tongfu

            15.1.7.1. Overview

            15.1.7.2. Product Portfolio

            15.1.7.3. Profitability by Market Segments

            15.1.7.4. Sales Footprint

            15.1.7.5. Strategy Overview

                15.1.7.5.1. Marketing Strategy

        15.1.8. ADI

            15.1.8.1. Overview

            15.1.8.2. Product Portfolio

            15.1.8.3. Profitability by Market Segments

            15.1.8.4. Sales Footprint

            15.1.8.5. Strategy Overview

                15.1.8.5.1. Marketing Strategy

        15.1.9. AMD

            15.1.9.1. Overview

            15.1.9.2. Product Portfolio

            15.1.9.3. Profitability by Market Segments

            15.1.9.4. Sales Footprint

            15.1.9.5. Strategy Overview

                15.1.9.5.1. Marketing Strategy

        15.1.10. ARM

            15.1.10.1. Overview

            15.1.10.2. Product Portfolio

            15.1.10.3. Profitability by Market Segments

            15.1.10.4. Sales Footprint

            15.1.10.5. Strategy Overview

                15.1.10.5.1. Marketing Strategy

16. Assumptions & Acronyms Used

17. Research Methodology

List of Tables

Table 1: Global Market Value (US$ Million) Forecast by Region, 2018 to 2033

Table 2: Global Market Value (US$ Million) Forecast by Technology, 2018 to 2033

Table 3: Global Market Value (US$ Million) Forecast by Application, 2018 to 2033

Table 4: North America Market Value (US$ Million) Forecast by Country, 2018 to 2033

Table 5: North America Market Value (US$ Million) Forecast by Technology,2018 to 2033

Table 6: North America Market Value (US$ Million) Forecast by Application,2018 to 2033

Table 7: Latin America Market Value (US$ Million) Forecast by Country, 2018 to 2033

Table 8: Latin America Market Value (US$ Million) Forecast by Technology, 2018 to 2033

Table 9: Latin America Market Value (US$ Million) Forecast by Application, 2018 to 2033

Table 10: Europe Market Value (US$ Million) Forecast by Country, 2018 to 2033

Table 11: Europe Market Value (US$ Million) Forecast by Technology, 2018 to 2033

Table 12: Europe Market Value (US$ Million) Forecast by Application, 2018 to 2033

Table 13: Asia Pacific Market Value (US$ Million) Forecast by Country, 2018 to 2033

Table 14: Asia Pacific Market Value (US$ Million) Forecast by Technology, 2018 to 2033

Table 15: Asia Pacific Market Value (US$ Million) Forecast by Application, 2018 to 2033

Table 16: Middle East & Africa Market Value (US$ Million) Forecast by Country, 2018 to 2033

Table 17: Middle East & Africa Market Value (US$ Million) Forecast by Technology, 2018 to 2033

Table 18: Middle East & Africa Market Value (US$ Million) Forecast by Application, 2018 to 2033

List of Charts

Figure 1: Global Market Value (US$ Million) by Technology, 2023 to 2033

Figure 2: Global Market Value (US$ Million) by Application, 2023 to 2033

Figure 3: Global Market Value (US$ Million) by Region, 2023 to 2033

Figure 4: Global Market Value (US$ Million) Analysis by Region, 2018 to 2033

Figure 5: Global Market Value Share (%) and BPS Analysis by Region, 2023 to 2033

Figure 6: Global Market Y-o-Y Growth (%) Projections by Region, 2023 to 2033

Figure 7: Global Market Value (US$ Million) Analysis by Technology, 2018 to 2033

Figure 8: Global Market Value Share (%) and BPS Analysis by Technology, 2023 to 2033

Figure 9: Global Market Y-o-Y Growth (%) Projections by Technology, 2023 to 2033

Figure 10: Global Market Value (US$ Million) Analysis by Application, 2018 to 2033

Figure 11: Global Market Value Share (%) and BPS Analysis by Application,2023 to 2033

Figure 12: Global Market Y-o-Y Growth (%) Projections by Application, 2023 to 2033

Figure 13: Global Market Attractiveness by Technology, 2023 to 2033

Figure 14: Global Market Attractiveness by Application, 2023 to 2033

Figure 15: Global Market Attractiveness by Region, 2023 to 2033

Figure 16: North America Market Value (US$ Million) by Technology, 2023 to 2033

Figure 17: North America Market Value (US$ Million) by Application, 2023 to 2033

Figure 18: North America Market Value (US$ Million) by Country, 2023 to 2033

Figure 19: North America Market Value (US$ Million) Analysis by Country, 2018 to 2033

Figure 20: North America Market Value Share (%) and BPS Analysis by Country,2023 to 2033

Figure 21: North America Market Y-o-Y Growth (%) Projections by Country,2023 to 2033

Figure 22: North America Market Value (US$ Million) Analysis by Technology, 2018 to 2033

Figure 23: North America Market Value Share (%) and BPS Analysis by Technology,2023 to 2033

Figure 24: North America Market Y-o-Y Growth (%) Projections by Technology, 2023 to 2033

Figure 25: North America Market Value (US$ Million) Analysis by Application,2018 to 2033

Figure 26: North America Market Value Share (%) and BPS Analysis by Application,2023 to 2033

Figure 27: North America Market Y-o-Y Growth (%) Projections by Application, 2023 to 2033

Figure 28: North America Market Attractiveness by Technology, 2023 to 2033

Figure 29: North America Market Attractiveness by Application, 2023 to 2033

Figure 30: North America Market Attractiveness by Country, 2023 to 2033

Figure 31: Latin America Market Value (US$ Million) by Technology, 2023 to 2033

Figure 32: Latin America Market Value (US$ Million) by Application, 2023 to 2033

Figure 33: Latin America Market Value (US$ Million) by Country, 2023 to 2033

Figure 34: Latin America Market Value (US$ Million) Analysis by Country, 2018 to 2033

Figure 35: Latin America Market Value Share (%) and BPS Analysis by Country,2023 to 2033

Figure 36: Latin America Market Y-o-Y Growth (%) Projections by Country,2023 to 2033

Figure 37: Latin America Market Value (US$ Million) Analysis by Technology, 2018 to 2033

Figure 38: Latin America Market Value Share (%) and BPS Analysis by Technology,2023 to 2033

Figure 39: Latin America Market Y-o-Y Growth (%) Projections by Technology, 2023 to 2033

Figure 40: Latin America Market Value (US$ Million) Analysis by Application, 2018 to 2033

Figure 41: Latin America Market Value Share (%) and BPS Analysis by Application, 2023 to 2033

Figure 42: Latin America Market Y-o-Y Growth (%) Projections by Application,2023 to 2033

Figure 43: Latin America Market Attractiveness by Technology, 2023 to 2033

Figure 44: Latin America Market Attractiveness by Application, 2023 to 2033

Figure 45: Latin America Market Attractiveness by Country, 2023 to 2033

Figure 46: Europe Market Value (US$ Million) by Technology, 2023 to 2033

Figure 47: Europe Market Value (US$ Million) by Application, 2023 to 2033

Figure 48: Europe Market Value (US$ Million) by Country, 2023 to 2033

Figure 49: Europe Market Value (US$ Million) Analysis by Country, 2018 to 2033

Figure 50: Europe Market Value Share (%) and BPS Analysis by Country, 2023 to 2033

Figure 51: Europe Market Y-o-Y Growth (%) Projections by Country, 2023 to 2033

Figure 52: Europe Market Value (US$ Million) Analysis by Technology, 2018 to 2033

Figure 53: Europe Market Value Share (%) and BPS Analysis by Technology, 2023 to 2033

Figure 54: Europe Market Y-o-Y Growth (%) Projections by Technology, 2023 to 2033

Figure 55: Europe Market Value (US$ Million) Analysis by Application, 2018 to 2033

Figure 56: Europe Market Value Share (%) and BPS Analysis by Application, 2023 to 2033

Figure 57: Europe Market Y-o-Y Growth (%) Projections by Application, 2023 to 2033

Figure 58: Europe Market Attractiveness by Technology, 2023 to 2033

Figure 59: Europe Market Attractiveness by Application, 2023 to 2033

Figure 60: Europe Market Attractiveness by Country, 2023 to 2033

Figure 61: Asia Pacific Market Value (US$ Million) by Technology, 2023 to 2033

Figure 62: Asia Pacific Market Value (US$ Million) by Application, 2023 to 2033

Figure 63: Asia Pacific Market Value (US$ Million) by Country, 2023 to 2033

Figure 64: Asia Pacific Market Value (US$ Million) Analysis by Country, 2018 to 2033

Figure 65: Asia Pacific Market Value Share (%) and BPS Analysis by Country, 2023 to 2033

Figure 66: Asia Pacific Market Y-o-Y Growth (%) Projections by Country, 2023 to 2033

Figure 67: Asia Pacific Market Value (US$ Million) Analysis by Technology, 2018 to 2033

Figure 68: Asia Pacific Market Value Share (%) and BPS Analysis by Technology, 2023 to 2033

Figure 69: Asia Pacific Market Y-o-Y Growth (%) Projections by Technology,2023 to 2033

Figure 70: Asia Pacific Market Value (US$ Million) Analysis by Application, 2018 to 2033

Figure 71: Asia Pacific Market Value Share (%) and BPS Analysis by Application, 2023 to 2033

Figure 72: Asia Pacific Market Y-o-Y Growth (%) Projections by Application, 2023 to 2033

Figure 73: Asia Pacific Market Attractiveness by Technology, 2023 to 2033

Figure 74: Asia Pacific Market Attractiveness by Application, 2023 to 2033

Figure 75: Asia Pacific Market Attractiveness by Country, 2023 to 2033

Figure 76: Middle East & Africa Market Value (US$ Million) by Technology, 2023 to 2033

Figure 77: Middle East & Africa Market Value (US$ Million) by Application, 2023 to 2033

Figure 78: Middle East & Africa Market Value (US$ Million) by Country, 2023 to 2033

Figure 79: Middle East & Africa Market Value (US$ Million) Analysis by Country, 2018 to 2033

Figure 80: Middle East & Africa Market Value Share (%) and BPS Analysis by Country, 2023 to 2033

Figure 81: Middle East & Africa Market Y-o-Y Growth (%) Projections by Country, 2023 to 2033

Figure 82: Middle East & Africa Market Value (US$ Million) Analysis by Technology, 2018 to 2033

Figure 83: Middle East & Africa Market Value Share (%) and BPS Analysis by Technology, 2023 to 2033

Figure 84: Middle East & Africa Market Y-o-Y Growth (%) Projections by Technology, 2023 to 2033

Figure 85: Middle East & Africa Market Value (US$ Million) Analysis by Application, 2018 to 2033

Figure 86: Middle East & Africa Market Value Share (%) and BPS Analysis by Application, 2023 to 2033

Figure 87: Middle East & Africa Market Y-o-Y Growth (%) Projections by Application, 2023 to 2033

Figure 88: Middle East & Africa Market Attractiveness by Technology, 2023 to 2033

Figure 89: Middle East & Africa Market Attractiveness by Application, 2023 to 2033

Figure 90: Middle East & Africa Market Attractiveness by Country, 2023 to 2033

Recommendations

Packaging

Advanced Packaging Market

Published : February 2023

Technology

RF Interconnect Market

Published : February 2023

Technology

Photoelectric Sensors Market

Published : January 2023

Technology

5G Technology Market

Published : January 2023

Explore Technology Insights

View Reports

High-End Performance Packaging Market