Chocolate Bar Packaging Market Outlook for 2024 to 2034

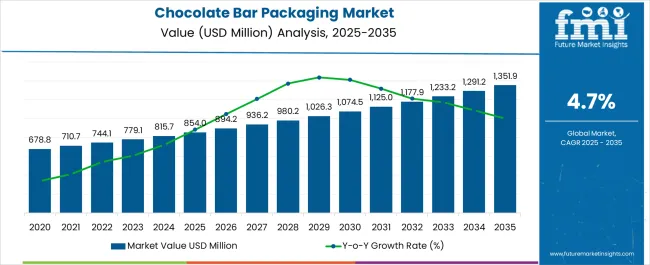
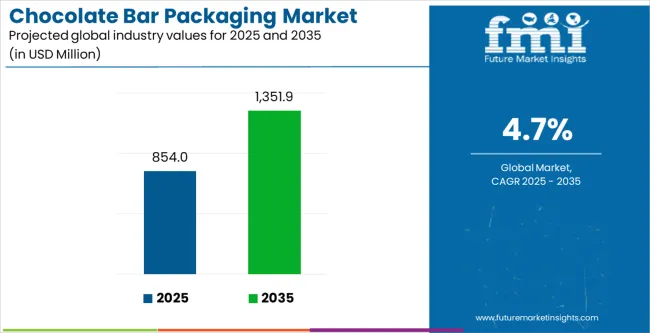
The chocolate bar packaging market is estimated to be valued at USD 815.7 million in 2024 and is expected to reach USD 1,291.2 million by 2034. The global market is anticipated to grow at a CAGR of 4.70% during the forecast period.

Key Market Drivers

The market generated an estimated revenue of USD 731.4 million in 2019. In four years, the market grew at a 1.90% CAGR and added a revenue of USD 56.7 million. Several reasons can be attributed to this growth:

  • Growing consumer preferences for convenience, on-the-go snacking, and visually appealing packaging contribute to the demand for innovative chocolate bar packaging.
  • The global push toward sustainability and the rising awareness of environmental concerns is leading to an increased demand for sustainable and eco-friendly packaging solutions in the chocolate industry.
  • The ongoing research in the packaging industry has been pouring billions of dollars into developing packaging materials and designs, such as resalable packs, interactive packaging, and premium finishes.
  • The booming eCommerce sector in emerging countries is necessitating robust packaging solutions to ensure product safety during transportation.
  • The increasing consumption of chocolate and chocolate products all around the world is contributing to the surge in demand for efficient and appealing packaging solutions.
Attributes Key Statistics
Chocolate Bar Packaging Market Value (2024) USD 815.7 million
Anticipated Market Value (2034) USD 1,291.2 million
CAGR (2024 to 2034) 4.70%

Consumption Analysis of the Chocolate Bar Packaging Market

  • Companies that produce chocolate bars and confectionaries form one of the prominent consumer groups in this market. They use chocolate bar packaging solutions to effectively pack their products so they don’t get damaged during transit.
  • Retailers, including supermarkets, convenience stores, specialty chocolate shops, and online retailers, contribute significantly to the market. They usually seek packaging solutions that enhance the shelf life.
  • Local confectionery stores, which cater to the regional demands of chocolate and chocolate products, also use these packaging solutions to elevate their brand image in the market. They do this by curating interactive designs on the packaging.
  • Apart from conventional chocolate products, these packaging solutions are also used in the production of vegan, premium, and artisanal chocolates. A noticeable shift has been observed in this direction in the last few years.
  • On a significantly smaller scale, gift shops and specialty stores also use chocolate bar packaging solutions to wrap chocolate products effectively. These shops create seasonal themes on special occasions such as holidays, birthdays, or anniversaries to attract more customers.

Historical Analysis of the Chocolate Bar Packaging Market

The market relies heavily on the overall demand for chocolate bars and confectionery products in the international marketplace. Changes in consumer preferences, such as a shift toward premium, healthier, or sustainable options have also significantly influenced the performance of the market. The market has seen a series of ups and downs in the last few years.

During the pandemic, as the world faced sudden shutdowns, the demand for chocolate and chocolate products exponentially declined. There were supply chain problems everywhere in the world. This severely affected the market. Due to the deteriorating financial conditions all over the world, people spent less on non-essential commodities, further slowing down the revenue growth.

However, as the world became accustomed to the new normal, things slowly began to pick up. As people spent more time in their homes, the overall consumption of chocolate products increased. The eCommerce boom in emerging parts of the world also stimulated the need for efficient packaging solutions. All these factors collectively contributed to the surging demand for chocolate bar packaging solutions, worldwide.

Attributes Key Statistics
Chocolate Bar Packaging Market Value (2019) USD 731.4 million
Projected Market Value (2023) USD 788.1 million
HCAGR (2019 to 2023) 1.90%

Restraining Factors Adversely Affecting the Chocolate Bar Packaging Market

The market is anticipated to surpass a global valuation of USD 1,291.2 million by the year 2034, with a growth rate of 4.70% CAGR. While the market is expected to experience substantial growth, several restraining factors are adversely affecting its development:

  • The sustainability of materials used in the market remains the biggest challenge in this market. The use of non-biodegradable materials in the chocolate bar industry hinders the market growth.
  • Disruptions in supply chains due to the pandemic, war-like situations, and trade barriers also negatively impact the overall market. The rising oil prices in the Gulf countries also contribute negatively to the market’s growth.
  • Recessionary economic times and the low per capita income in some areas of the world also lead to plunging consumer spending on non-essential items, including chocolates.
  • Adhering to stringent regulations related to food safety and packaging standards increases the price of packaging for chocolate manufacturers and packaging logistics. This deters cost-sensitive consumers from buying chocolate products, thus slowing down the growth rate.

Category-wise Insights

Plastic Packaging Solutions Dominate the Market Despite Sustainability Trend

Plastic packaging solutions have a widespread dominance in the food and beverage industry all over the world. In the chocolate bar packaging market, too, manufacturers prefer plastic packaging solutions for their affordability, availability, and durability. Plastics are comparatively lower in weight than other sustainable materials in the industry.

Attributes Details
Top Material Plastic
Market share in 2024 51.30%

Based on material, plastic chocolate bar packaging solutions dominate the market, holding a share of 51.3%. Their demand has also skyrocketed recently as manufacturers find printing on plastic material easy. These companies use the packaging to make their products stand out in retail shops, malls, and specialty confectionery stores.

Emergence of Stick Packs as a Leading Chocolate Bar Packaging Solution

Due to rapid urbanization and busier lifestyles, consumers all over the world are seeking products that offer maximum convenience and portability. Stick packs allow consumers to hold individual servings of chocolate bars, offering a practical solution for on-the-go consumption. Their surging demand, especially in the younger demographic, is due to the portion control it offers for snack-sized, easily shareable chocolate treats.

Attributes Details
Top Packaging Format Stick Pack
Market share in 2024 23.40%

Based on packaging format, stick packs dominate the market, accounting for a share of 23.40%. Besides this, stick packs also offer manufacturers and brands the opportunity for creative marketing and branding strategies. The elongated shape provides ample surface area for vibrant and attractive graphics, allowing for effective storytelling and brand communication.
Country-wise Insights

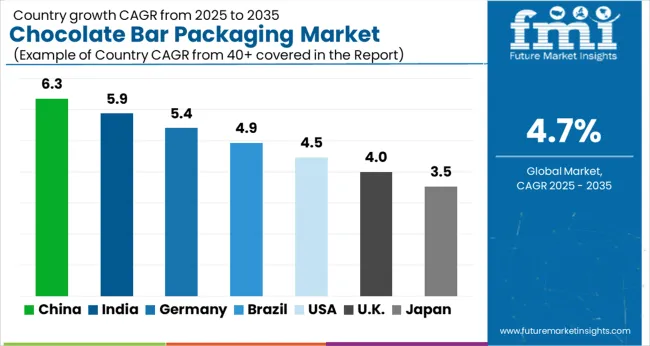
The section provides an analysis of the chocolate bar packaging market by countries, including China, India, the United Kingdom, South Korea, and Thailand. The table presents the CAGR for each country, indicating the expected growth of the market in that country through 2034.

Countries CAGR (2024 to 2034)
India 7.20%
China 6.40%
Thailand 6.10%
South Korea 5.30%
United Kingdom 5.20%

Chocolate Bar Packaging Market in India

India is one of the leading countries in this market. The Indian chocolate bar packaging market is anticipated to retain its dominance by progressing at a CAGR of 7.20% till 2034.

The rapid urbanization in India is driving the demand for convenient and on-the-go snacks, including chocolate bars. This has led to an increasing demand for packaging solutions in the confectionery industry, especially chocolates. There is also an ongoing trend toward healthier and more functional chocolates in the Indian population. This is further augmenting the need for efficient packaging solutions in India.

Chocolate Bar Packaging Market in China

China is another country in the Asian region that dominates the market. The Chinese market is anticipated to retain its dominance by progressing at an annual growth rate of 6.40% through 2034.

In China, the rising trend of eCommerce is significantly impacting the chocolate bar packaging market. The increasing popularity of online shopping platforms has led to a growing demand for packaging solutions that ensure the safe and attractive delivery of chocolate bars to consumers' doorsteps.

Chocolate Bar Packaging Market in Thailand

The demand for chocolate bar packaging solutions in Thailand is projected to rise at a 6.10% CAGR over the next ten years.

Thailand is known for its world-famous tourism industry. Millions of tourists flock to the country every year. The market benefits from the gifts and souvenir chocolates. They also visit the country to try exotic and unique chocolate flavors. Brands curate packaging that reflects cultural elements to make these chocolates more appealing to foreigners.

Chocolate Bar Packaging Market in South Korea

The South Korean chocolate bar packaging market is anticipated to register a CAGR of 5.30% through 2034.

The fast-paced lifestyle and culture of snacking contribute to the growth of the chocolate bar packaging market in South Korea. Packaging that emphasizes convenience and portability is preferred by chocolate manufacturers in the region. Besides this, there is an ongoing trend of augmented reality features, interactive packaging, and smart packaging solutions in the South Korean market.

Chocolate Bar Packaging Market in the United Kingdom

In the European region, the United Kingdom leads the market for chocolate bar packaging solutions. The market in the United Kingdom is poised to showcase a 5.20% CAGR from 2024 to 2034.

The United Kingdom market is witnessing a massive surge in demand for luxury and artisanal chocolate products. Consumers are willing to pay a little extra to get an authentic chocolate-eating experience in the United Kingdom. Brands are responding to this by providing sophisticated packaging that conveys a sense of luxury and exclusivity.
Competitive Landscape

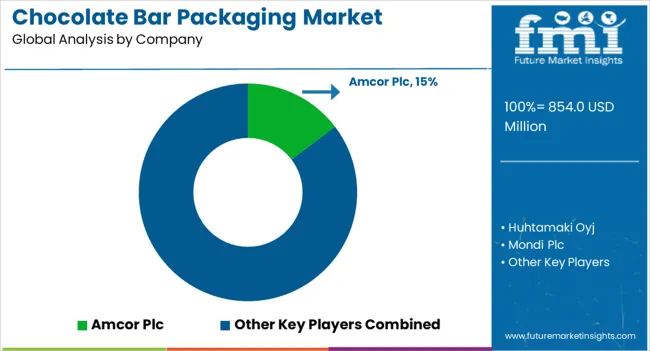
The chocolate bar packaging market is diverse, comprising established global players, emerging regional contenders, and niche players with a specialized focus. There are very few companies that operate globally. These companies have tied up with local and international chocolate-producing brands.

Small brands in the market also have a lot of opportunities. These companies can cater to the demands of regional confectionery stores and manufacturing units. The market is currently going through a transitional phase with the introduction of sustainable materials for packaging.

Recent Developments

  • Recently, Indian nutrition firm Brawny Bear partnered with Pakka Limited for eco-friendly packaging of its new chocolate bar. The collaboration introduced flexible paper packaging to enhance sustainability in the product line.
  • Mars, the multinational food company, successfully transitioned its chocolate bars from plastic to recyclable paper packaging in a recent trial in the United Kingdom. The eco-friendly change was implemented at 500 Tesco stores starting May 29, 2023.
  • Hershey's "SHE" chocolate bars returned to store shelves on March 1, 2023, marking the third year of Women's History Month celebration. The new wrapper featured over 200 uplifting adjectives describing women and girls.

Key Market Segmentation

By Material:

  • Paper
    • Plastic
    • LDPE
    • PVC
    • PET
    • PE
    • Foil
    • Aluminum

By Type:

  • Wrappers
    • Boxes
    • Secondary packaging (Pouches, Bags)

By Region:

  • North America
  • Latin America
  • Europe
  • Asia Pacific
  • Middle East and Africa

Table of Content

  • 1. Executive Summary
  • 2. Market Overview
  • 3. Market Background
  • 4. Global Market Analysis 2019 to 2023 and Forecast, 2024 to 2034
  • 5. Global Market Analysis 2019 to 2023 and Forecast 2024 to 2034, By Material
    • 5.1. Plastic
      • 5.1.1. Polyethylene
      • 5.1.2. Propylene
      • 5.1.3. EVOH
      • 5.1.4. PVDC
      • 5.1.5. Others
    • 5.2. Paper & Paperboard
    • 5.3. Glass
    • 5.4. Metal
  • 6. Global Market Analysis 2019 to 2023 and Forecast 2024 to 2034, By Packaging Format
    • 6.1. Wraps
    • 6.2. Stick Packs
    • 6.3. Bags & Pouches
    • 6.4. Laminates
    • 6.5. Bottles & Jars
    • 6.6. Trays
    • 6.7. Boxes
    • 6.8. Cans
    • 6.9. Others
  • 7. Global Market Analysis 2019 to 2023 and Forecast 2024 to 2034, By Form Type
    • 7.1. Solid
    • 7.2. Liquid
    • 7.3. Granular or Powdered
  • 8. Global Market Analysis 2019 to 2023 and Forecast 2024 to 2034, By Chocolate Type
    • 8.1. Dark
    • 8.2. Milk
    • 8.3. White
    • 8.4. Filled
    • 8.5. Others
  • 9. Global Market Analysis 2019 to 2023 and Forecast 2024 to 2034, By Region
    • 9.1. North America
    • 9.2. Latin America
    • 9.3. Western Europe
    • 9.4. Eastern Europe
    • 9.5. South Asia and Pacific
    • 9.6. East Asia
    • 9.7. Middle East and Africa
  • 10. North America Market Analysis 2019 to 2023 and Forecast 2024 to 2034, By Country
  • 11. Latin America Market Analysis 2019 to 2023 and Forecast 2024 to 2034, By Country
  • 12. Western Europe Market Analysis 2019 to 2023 and Forecast 2024 to 2034, By Country
  • 13. Eastern Europe Market Analysis 2019 to 2023 and Forecast 2024 to 2034, By Country
  • 14. South Asia and Pacific Market Analysis 2019 to 2023 and Forecast 2024 to 2034, By Country
  • 15. East Asia Market Analysis 2019 to 2023 and Forecast 2024 to 2034, By Country
  • 16. Middle East and Africa Market Analysis 2019 to 2023 and Forecast 2024 to 2034, By Country
  • 17. Key Countries Market Analysis
  • 18. Market Structure Analysis
  • 19. Competition Analysis
    • 19.1. Amcor Plc
    • 19.2. Huhtamaki Oyj
    • 19.3. Mondi Plc
    • 19.4. The Smurfit Kappa Group plc
    • 19.5. Stora Enso Oyj
    • 19.6. Glenroy Inc
    • 19.7. Sonoco Products Company
    • 19.8. Sealed Air Corporation
    • 19.9. JBM Packaging
    • 19.10. MAX Bright Packaging
    • 19.11. Packman Packaging
    • 19.12. Marber S.r.l.
    • 19.13. Packle Packaging Industries
    • 19.14. Zee Packaging
    • 19.15. Charpak Ltd
    • 19.16. The Sherwood Group
    • 19.17. Swiftpak Limited
    • 19.18. Premier Packaging Solutions
  • 20. Assumptions & Acronyms Used
  • 21. Research Methodology

List of Tables

Table 1: Global Market Value (US$ Million) Forecast by Region, 2019 to 2034

Table 2: Global Market Volume (Units) Forecast by Region, 2019 to 2034

Table 3: Global Market Value (US$ Million) Forecast by Material, 2019 to 2034

Table 4: Global Market Volume (Units) Forecast by Material, 2019 to 2034

Table 5: Global Market Value (US$ Million) Forecast by Packaging Format, 2019 to 2034

Table 6: Global Market Volume (Units) Forecast by Packaging Format, 2019 to 2034

Table 7: Global Market Value (US$ Million) Forecast by Form Type, 2019 to 2034

Table 8: Global Market Volume (Units) Forecast by Form Type, 2019 to 2034

Table 9: Global Market Value (US$ Million) Forecast by Chocolate Type, 2019 to 2034

Table 10: Global Market Volume (Units) Forecast by Chocolate Type, 2019 to 2034

Table 11: North America Market Value (US$ Million) Forecast by Country, 2019 to 2034

Table 12: North America Market Volume (Units) Forecast by Country, 2019 to 2034

Table 13: North America Market Value (US$ Million) Forecast by Material, 2019 to 2034

Table 14: North America Market Volume (Units) Forecast by Material, 2019 to 2034

Table 15: North America Market Value (US$ Million) Forecast by Packaging Format, 2019 to 2034

Table 16: North America Market Volume (Units) Forecast by Packaging Format, 2019 to 2034

Table 17: North America Market Value (US$ Million) Forecast by Form Type, 2019 to 2034

Table 18: North America Market Volume (Units) Forecast by Form Type, 2019 to 2034

Table 19: North America Market Value (US$ Million) Forecast by Chocolate Type, 2019 to 2034

Table 20: North America Market Volume (Units) Forecast by Chocolate Type, 2019 to 2034

Table 21: Latin America Market Value (US$ Million) Forecast by Country, 2019 to 2034

Table 22: Latin America Market Volume (Units) Forecast by Country, 2019 to 2034

Table 23: Latin America Market Value (US$ Million) Forecast by Material, 2019 to 2034

Table 24: Latin America Market Volume (Units) Forecast by Material, 2019 to 2034

Table 25: Latin America Market Value (US$ Million) Forecast by Packaging Format, 2019 to 2034

Table 26: Latin America Market Volume (Units) Forecast by Packaging Format, 2019 to 2034

Table 27: Latin America Market Value (US$ Million) Forecast by Form Type, 2019 to 2034

Table 28: Latin America Market Volume (Units) Forecast by Form Type, 2019 to 2034

Table 29: Latin America Market Value (US$ Million) Forecast by Chocolate Type, 2019 to 2034

Table 30: Latin America Market Volume (Units) Forecast by Chocolate Type, 2019 to 2034

Table 31: Western Europe Market Value (US$ Million) Forecast by Country, 2019 to 2034

Table 32: Western Europe Market Volume (Units) Forecast by Country, 2019 to 2034

Table 33: Western Europe Market Value (US$ Million) Forecast by Material, 2019 to 2034

Table 34: Western Europe Market Volume (Units) Forecast by Material, 2019 to 2034

Table 35: Western Europe Market Value (US$ Million) Forecast by Packaging Format, 2019 to 2034

Table 36: Western Europe Market Volume (Units) Forecast by Packaging Format, 2019 to 2034

Table 37: Western Europe Market Value (US$ Million) Forecast by Form Type, 2019 to 2034

Table 38: Western Europe Market Volume (Units) Forecast by Form Type, 2019 to 2034

Table 39: Western Europe Market Value (US$ Million) Forecast by Chocolate Type, 2019 to 2034

Table 40: Western Europe Market Volume (Units) Forecast by Chocolate Type, 2019 to 2034

Table 41: Eastern Europe Market Value (US$ Million) Forecast by Country, 2019 to 2034

Table 42: Eastern Europe Market Volume (Units) Forecast by Country, 2019 to 2034

Table 43: Eastern Europe Market Value (US$ Million) Forecast by Material, 2019 to 2034

Table 44: Eastern Europe Market Volume (Units) Forecast by Material, 2019 to 2034

Table 45: Eastern Europe Market Value (US$ Million) Forecast by Packaging Format, 2019 to 2034

Table 46: Eastern Europe Market Volume (Units) Forecast by Packaging Format, 2019 to 2034

Table 47: Eastern Europe Market Value (US$ Million) Forecast by Form Type, 2019 to 2034

Table 48: Eastern Europe Market Volume (Units) Forecast by Form Type, 2019 to 2034

Table 49: Eastern Europe Market Value (US$ Million) Forecast by Chocolate Type, 2019 to 2034

Table 50: Eastern Europe Market Volume (Units) Forecast by Chocolate Type, 2019 to 2034

Table 51: South Asia and Pacific Market Value (US$ Million) Forecast by Country, 2019 to 2034

Table 52: South Asia and Pacific Market Volume (Units) Forecast by Country, 2019 to 2034

Table 53: South Asia and Pacific Market Value (US$ Million) Forecast by Material, 2019 to 2034

Table 54: South Asia and Pacific Market Volume (Units) Forecast by Material, 2019 to 2034

Table 55: South Asia and Pacific Market Value (US$ Million) Forecast by Packaging Format, 2019 to 2034

Table 56: South Asia and Pacific Market Volume (Units) Forecast by Packaging Format, 2019 to 2034

Table 57: South Asia and Pacific Market Value (US$ Million) Forecast by Form Type, 2019 to 2034

Table 58: South Asia and Pacific Market Volume (Units) Forecast by Form Type, 2019 to 2034

Table 59: South Asia and Pacific Market Value (US$ Million) Forecast by Chocolate Type, 2019 to 2034

Table 60: South Asia and Pacific Market Volume (Units) Forecast by Chocolate Type, 2019 to 2034

Table 61: East Asia Market Value (US$ Million) Forecast by Country, 2019 to 2034

Table 62: East Asia Market Volume (Units) Forecast by Country, 2019 to 2034

Table 63: East Asia Market Value (US$ Million) Forecast by Material, 2019 to 2034

Table 64: East Asia Market Volume (Units) Forecast by Material, 2019 to 2034

Table 65: East Asia Market Value (US$ Million) Forecast by Packaging Format, 2019 to 2034

Table 66: East Asia Market Volume (Units) Forecast by Packaging Format, 2019 to 2034

Table 67: East Asia Market Value (US$ Million) Forecast by Form Type, 2019 to 2034

Table 68: East Asia Market Volume (Units) Forecast by Form Type, 2019 to 2034

Table 69: East Asia Market Value (US$ Million) Forecast by Chocolate Type, 2019 to 2034

Table 70: East Asia Market Volume (Units) Forecast by Chocolate Type, 2019 to 2034

Table 71: Middle East and Africa Market Value (US$ Million) Forecast by Country, 2019 to 2034

Table 72: Middle East and Africa Market Volume (Units) Forecast by Country, 2019 to 2034

Table 73: Middle East and Africa Market Value (US$ Million) Forecast by Material, 2019 to 2034

Table 74: Middle East and Africa Market Volume (Units) Forecast by Material, 2019 to 2034

Table 75: Middle East and Africa Market Value (US$ Million) Forecast by Packaging Format, 2019 to 2034

Table 76: Middle East and Africa Market Volume (Units) Forecast by Packaging Format, 2019 to 2034

Table 77: Middle East and Africa Market Value (US$ Million) Forecast by Form Type, 2019 to 2034

Table 78: Middle East and Africa Market Volume (Units) Forecast by Form Type, 2019 to 2034

Table 79: Middle East and Africa Market Value (US$ Million) Forecast by Chocolate Type, 2019 to 2034

Table 80: Middle East and Africa Market Volume (Units) Forecast by Chocolate Type, 2019 to 2034

List of Figures

Figure 1: Global Market Value (US$ Million) by Material, 2024 to 2034

Figure 2: Global Market Value (US$ Million) by Packaging Format, 2024 to 2034

Figure 3: Global Market Value (US$ Million) by Form Type, 2024 to 2034

Figure 4: Global Market Value (US$ Million) by Chocolate Type, 2024 to 2034

Figure 5: Global Market Value (US$ Million) by Region, 2024 to 2034

Figure 6: Global Market Value (US$ Million) Analysis by Region, 2019 to 2034

Figure 7: Global Market Volume (Units) Analysis by Region, 2019 to 2034

Figure 8: Global Market Value Share (%) and BPS Analysis by Region, 2024 to 2034

Figure 9: Global Market Y-o-Y Growth (%) Projections by Region, 2024 to 2034

Figure 10: Global Market Value (US$ Million) Analysis by Material, 2019 to 2034

Figure 11: Global Market Volume (Units) Analysis by Material, 2019 to 2034

Figure 12: Global Market Value Share (%) and BPS Analysis by Material, 2024 to 2034

Figure 13: Global Market Y-o-Y Growth (%) Projections by Material, 2024 to 2034

Figure 14: Global Market Value (US$ Million) Analysis by Packaging Format, 2019 to 2034

Figure 15: Global Market Volume (Units) Analysis by Packaging Format, 2019 to 2034

Figure 16: Global Market Value Share (%) and BPS Analysis by Packaging Format, 2024 to 2034

Figure 17: Global Market Y-o-Y Growth (%) Projections by Packaging Format, 2024 to 2034

Figure 18: Global Market Value (US$ Million) Analysis by Form Type, 2019 to 2034

Figure 19: Global Market Volume (Units) Analysis by Form Type, 2019 to 2034

Figure 20: Global Market Value Share (%) and BPS Analysis by Form Type, 2024 to 2034

Figure 21: Global Market Y-o-Y Growth (%) Projections by Form Type, 2024 to 2034

Figure 22: Global Market Value (US$ Million) Analysis by Chocolate Type, 2019 to 2034

Figure 23: Global Market Volume (Units) Analysis by Chocolate Type, 2019 to 2034

Figure 24: Global Market Value Share (%) and BPS Analysis by Chocolate Type, 2024 to 2034

Figure 25: Global Market Y-o-Y Growth (%) Projections by Chocolate Type, 2024 to 2034

Figure 26: Global Market Attractiveness by Material, 2024 to 2034

Figure 27: Global Market Attractiveness by Packaging Format, 2024 to 2034

Figure 28: Global Market Attractiveness by Form Type, 2024 to 2034

Figure 29: Global Market Attractiveness by Chocolate Type, 2024 to 2034

Figure 30: Global Market Attractiveness by Region, 2024 to 2034

Figure 31: North America Market Value (US$ Million) by Material, 2024 to 2034

Figure 32: North America Market Value (US$ Million) by Packaging Format, 2024 to 2034

Figure 33: North America Market Value (US$ Million) by Form Type, 2024 to 2034

Figure 34: North America Market Value (US$ Million) by Chocolate Type, 2024 to 2034

Figure 35: North America Market Value (US$ Million) by Country, 2024 to 2034

Figure 36: North America Market Value (US$ Million) Analysis by Country, 2019 to 2034

Figure 37: North America Market Volume (Units) Analysis by Country, 2019 to 2034

Figure 38: North America Market Value Share (%) and BPS Analysis by Country, 2024 to 2034

Figure 39: North America Market Y-o-Y Growth (%) Projections by Country, 2024 to 2034

Figure 40: North America Market Value (US$ Million) Analysis by Material, 2019 to 2034

Figure 41: North America Market Volume (Units) Analysis by Material, 2019 to 2034

Figure 42: North America Market Value Share (%) and BPS Analysis by Material, 2024 to 2034

Figure 43: North America Market Y-o-Y Growth (%) Projections by Material, 2024 to 2034

Figure 44: North America Market Value (US$ Million) Analysis by Packaging Format, 2019 to 2034

Figure 45: North America Market Volume (Units) Analysis by Packaging Format, 2019 to 2034

Figure 46: North America Market Value Share (%) and BPS Analysis by Packaging Format, 2024 to 2034

Figure 47: North America Market Y-o-Y Growth (%) Projections by Packaging Format, 2024 to 2034

Figure 48: North America Market Value (US$ Million) Analysis by Form Type, 2019 to 2034

Figure 49: North America Market Volume (Units) Analysis by Form Type, 2019 to 2034

Figure 50: North America Market Value Share (%) and BPS Analysis by Form Type, 2024 to 2034

Figure 51: North America Market Y-o-Y Growth (%) Projections by Form Type, 2024 to 2034

Figure 52: North America Market Value (US$ Million) Analysis by Chocolate Type, 2019 to 2034

Figure 53: North America Market Volume (Units) Analysis by Chocolate Type, 2019 to 2034

Figure 54: North America Market Value Share (%) and BPS Analysis by Chocolate Type, 2024 to 2034

Figure 55: North America Market Y-o-Y Growth (%) Projections by Chocolate Type, 2024 to 2034

Figure 56: North America Market Attractiveness by Material, 2024 to 2034

Figure 57: North America Market Attractiveness by Packaging Format, 2024 to 2034

Figure 58: North America Market Attractiveness by Form Type, 2024 to 2034

Figure 59: North America Market Attractiveness by Chocolate Type, 2024 to 2034

Figure 60: North America Market Attractiveness by Country, 2024 to 2034

Figure 61: Latin America Market Value (US$ Million) by Material, 2024 to 2034

Figure 62: Latin America Market Value (US$ Million) by Packaging Format, 2024 to 2034

Figure 63: Latin America Market Value (US$ Million) by Form Type, 2024 to 2034

Figure 64: Latin America Market Value (US$ Million) by Chocolate Type, 2024 to 2034

Figure 65: Latin America Market Value (US$ Million) by Country, 2024 to 2034

Figure 66: Latin America Market Value (US$ Million) Analysis by Country, 2019 to 2034

Figure 67: Latin America Market Volume (Units) Analysis by Country, 2019 to 2034

Figure 68: Latin America Market Value Share (%) and BPS Analysis by Country, 2024 to 2034

Figure 69: Latin America Market Y-o-Y Growth (%) Projections by Country, 2024 to 2034

Figure 70: Latin America Market Value (US$ Million) Analysis by Material, 2019 to 2034

Figure 71: Latin America Market Volume (Units) Analysis by Material, 2019 to 2034

Figure 72: Latin America Market Value Share (%) and BPS Analysis by Material, 2024 to 2034

Figure 73: Latin America Market Y-o-Y Growth (%) Projections by Material, 2024 to 2034

Figure 74: Latin America Market Value (US$ Million) Analysis by Packaging Format, 2019 to 2034

Figure 75: Latin America Market Volume (Units) Analysis by Packaging Format, 2019 to 2034

Figure 76: Latin America Market Value Share (%) and BPS Analysis by Packaging Format, 2024 to 2034

Figure 77: Latin America Market Y-o-Y Growth (%) Projections by Packaging Format, 2024 to 2034

Figure 78: Latin America Market Value (US$ Million) Analysis by Form Type, 2019 to 2034

Figure 79: Latin America Market Volume (Units) Analysis by Form Type, 2019 to 2034

Figure 80: Latin America Market Value Share (%) and BPS Analysis by Form Type, 2024 to 2034

Figure 81: Latin America Market Y-o-Y Growth (%) Projections by Form Type, 2024 to 2034

Figure 82: Latin America Market Value (US$ Million) Analysis by Chocolate Type, 2019 to 2034

Figure 83: Latin America Market Volume (Units) Analysis by Chocolate Type, 2019 to 2034

Figure 84: Latin America Market Value Share (%) and BPS Analysis by Chocolate Type, 2024 to 2034

Figure 85: Latin America Market Y-o-Y Growth (%) Projections by Chocolate Type, 2024 to 2034

Figure 86: Latin America Market Attractiveness by Material, 2024 to 2034

Figure 87: Latin America Market Attractiveness by Packaging Format, 2024 to 2034

Figure 88: Latin America Market Attractiveness by Form Type, 2024 to 2034

Figure 89: Latin America Market Attractiveness by Chocolate Type, 2024 to 2034

Figure 90: Latin America Market Attractiveness by Country, 2024 to 2034

Figure 91: Western Europe Market Value (US$ Million) by Material, 2024 to 2034

Figure 92: Western Europe Market Value (US$ Million) by Packaging Format, 2024 to 2034

Figure 93: Western Europe Market Value (US$ Million) by Form Type, 2024 to 2034

Figure 94: Western Europe Market Value (US$ Million) by Chocolate Type, 2024 to 2034

Figure 95: Western Europe Market Value (US$ Million) by Country, 2024 to 2034

Figure 96: Western Europe Market Value (US$ Million) Analysis by Country, 2019 to 2034

Figure 97: Western Europe Market Volume (Units) Analysis by Country, 2019 to 2034

Figure 98: Western Europe Market Value Share (%) and BPS Analysis by Country, 2024 to 2034

Figure 99: Western Europe Market Y-o-Y Growth (%) Projections by Country, 2024 to 2034

Figure 100: Western Europe Market Value (US$ Million) Analysis by Material, 2019 to 2034

Figure 101: Western Europe Market Volume (Units) Analysis by Material, 2019 to 2034

Figure 102: Western Europe Market Value Share (%) and BPS Analysis by Material, 2024 to 2034

Figure 103: Western Europe Market Y-o-Y Growth (%) Projections by Material, 2024 to 2034

Figure 104: Western Europe Market Value (US$ Million) Analysis by Packaging Format, 2019 to 2034

Figure 105: Western Europe Market Volume (Units) Analysis by Packaging Format, 2019 to 2034

Figure 106: Western Europe Market Value Share (%) and BPS Analysis by Packaging Format, 2024 to 2034

Figure 107: Western Europe Market Y-o-Y Growth (%) Projections by Packaging Format, 2024 to 2034

Figure 108: Western Europe Market Value (US$ Million) Analysis by Form Type, 2019 to 2034

Figure 109: Western Europe Market Volume (Units) Analysis by Form Type, 2019 to 2034

Figure 110: Western Europe Market Value Share (%) and BPS Analysis by Form Type, 2024 to 2034

Figure 111: Western Europe Market Y-o-Y Growth (%) Projections by Form Type, 2024 to 2034

Figure 112: Western Europe Market Value (US$ Million) Analysis by Chocolate Type, 2019 to 2034

Figure 113: Western Europe Market Volume (Units) Analysis by Chocolate Type, 2019 to 2034

Figure 114: Western Europe Market Value Share (%) and BPS Analysis by Chocolate Type, 2024 to 2034

Figure 115: Western Europe Market Y-o-Y Growth (%) Projections by Chocolate Type, 2024 to 2034

Figure 116: Western Europe Market Attractiveness by Material, 2024 to 2034

Figure 117: Western Europe Market Attractiveness by Packaging Format, 2024 to 2034

Figure 118: Western Europe Market Attractiveness by Form Type, 2024 to 2034

Figure 119: Western Europe Market Attractiveness by Chocolate Type, 2024 to 2034

Figure 120: Western Europe Market Attractiveness by Country, 2024 to 2034

Figure 121: Eastern Europe Market Value (US$ Million) by Material, 2024 to 2034

Figure 122: Eastern Europe Market Value (US$ Million) by Packaging Format, 2024 to 2034

Figure 123: Eastern Europe Market Value (US$ Million) by Form Type, 2024 to 2034

Figure 124: Eastern Europe Market Value (US$ Million) by Chocolate Type, 2024 to 2034

Figure 125: Eastern Europe Market Value (US$ Million) by Country, 2024 to 2034

Figure 126: Eastern Europe Market Value (US$ Million) Analysis by Country, 2019 to 2034

Figure 127: Eastern Europe Market Volume (Units) Analysis by Country, 2019 to 2034

Figure 128: Eastern Europe Market Value Share (%) and BPS Analysis by Country, 2024 to 2034

Figure 129: Eastern Europe Market Y-o-Y Growth (%) Projections by Country, 2024 to 2034

Figure 130: Eastern Europe Market Value (US$ Million) Analysis by Material, 2019 to 2034

Figure 131: Eastern Europe Market Volume (Units) Analysis by Material, 2019 to 2034

Figure 132: Eastern Europe Market Value Share (%) and BPS Analysis by Material, 2024 to 2034

Figure 133: Eastern Europe Market Y-o-Y Growth (%) Projections by Material, 2024 to 2034

Figure 134: Eastern Europe Market Value (US$ Million) Analysis by Packaging Format, 2019 to 2034

Figure 135: Eastern Europe Market Volume (Units) Analysis by Packaging Format, 2019 to 2034

Figure 136: Eastern Europe Market Value Share (%) and BPS Analysis by Packaging Format, 2024 to 2034

Figure 137: Eastern Europe Market Y-o-Y Growth (%) Projections by Packaging Format, 2024 to 2034

Figure 138: Eastern Europe Market Value (US$ Million) Analysis by Form Type, 2019 to 2034

Figure 139: Eastern Europe Market Volume (Units) Analysis by Form Type, 2019 to 2034

Figure 140: Eastern Europe Market Value Share (%) and BPS Analysis by Form Type, 2024 to 2034

Figure 141: Eastern Europe Market Y-o-Y Growth (%) Projections by Form Type, 2024 to 2034

Figure 142: Eastern Europe Market Value (US$ Million) Analysis by Chocolate Type, 2019 to 2034

Figure 143: Eastern Europe Market Volume (Units) Analysis by Chocolate Type, 2019 to 2034

Figure 144: Eastern Europe Market Value Share (%) and BPS Analysis by Chocolate Type, 2024 to 2034

Figure 145: Eastern Europe Market Y-o-Y Growth (%) Projections by Chocolate Type, 2024 to 2034

Figure 146: Eastern Europe Market Attractiveness by Material, 2024 to 2034

Figure 147: Eastern Europe Market Attractiveness by Packaging Format, 2024 to 2034

Figure 148: Eastern Europe Market Attractiveness by Form Type, 2024 to 2034

Figure 149: Eastern Europe Market Attractiveness by Chocolate Type, 2024 to 2034

Figure 150: Eastern Europe Market Attractiveness by Country, 2024 to 2034

Figure 151: South Asia and Pacific Market Value (US$ Million) by Material, 2024 to 2034

Figure 152: South Asia and Pacific Market Value (US$ Million) by Packaging Format, 2024 to 2034

Figure 153: South Asia and Pacific Market Value (US$ Million) by Form Type, 2024 to 2034

Figure 154: South Asia and Pacific Market Value (US$ Million) by Chocolate Type, 2024 to 2034

Figure 155: South Asia and Pacific Market Value (US$ Million) by Country, 2024 to 2034

Figure 156: South Asia and Pacific Market Value (US$ Million) Analysis by Country, 2019 to 2034

Figure 157: South Asia and Pacific Market Volume (Units) Analysis by Country, 2019 to 2034

Figure 158: South Asia and Pacific Market Value Share (%) and BPS Analysis by Country, 2024 to 2034

Figure 159: South Asia and Pacific Market Y-o-Y Growth (%) Projections by Country, 2024 to 2034

Figure 160: South Asia and Pacific Market Value (US$ Million) Analysis by Material, 2019 to 2034

Figure 161: South Asia and Pacific Market Volume (Units) Analysis by Material, 2019 to 2034

Figure 162: South Asia and Pacific Market Value Share (%) and BPS Analysis by Material, 2024 to 2034

Figure 163: South Asia and Pacific Market Y-o-Y Growth (%) Projections by Material, 2024 to 2034

Figure 164: South Asia and Pacific Market Value (US$ Million) Analysis by Packaging Format, 2019 to 2034

Figure 165: South Asia and Pacific Market Volume (Units) Analysis by Packaging Format, 2019 to 2034

Figure 166: South Asia and Pacific Market Value Share (%) and BPS Analysis by Packaging Format, 2024 to 2034

Figure 167: South Asia and Pacific Market Y-o-Y Growth (%) Projections by Packaging Format, 2024 to 2034

Figure 168: South Asia and Pacific Market Value (US$ Million) Analysis by Form Type, 2019 to 2034

Figure 169: South Asia and Pacific Market Volume (Units) Analysis by Form Type, 2019 to 2034

Figure 170: South Asia and Pacific Market Value Share (%) and BPS Analysis by Form Type, 2024 to 2034

Figure 171: South Asia and Pacific Market Y-o-Y Growth (%) Projections by Form Type, 2024 to 2034

Figure 172: South Asia and Pacific Market Value (US$ Million) Analysis by Chocolate Type, 2019 to 2034

Figure 173: South Asia and Pacific Market Volume (Units) Analysis by Chocolate Type, 2019 to 2034

Figure 174: South Asia and Pacific Market Value Share (%) and BPS Analysis by Chocolate Type, 2024 to 2034

Figure 175: South Asia and Pacific Market Y-o-Y Growth (%) Projections by Chocolate Type, 2024 to 2034

Figure 176: South Asia and Pacific Market Attractiveness by Material, 2024 to 2034

Figure 177: South Asia and Pacific Market Attractiveness by Packaging Format, 2024 to 2034

Figure 178: South Asia and Pacific Market Attractiveness by Form Type, 2024 to 2034

Figure 179: South Asia and Pacific Market Attractiveness by Chocolate Type, 2024 to 2034

Figure 180: South Asia and Pacific Market Attractiveness by Country, 2024 to 2034

Figure 181: East Asia Market Value (US$ Million) by Material, 2024 to 2034

Figure 182: East Asia Market Value (US$ Million) by Packaging Format, 2024 to 2034

Figure 183: East Asia Market Value (US$ Million) by Form Type, 2024 to 2034

Figure 184: East Asia Market Value (US$ Million) by Chocolate Type, 2024 to 2034

Figure 185: East Asia Market Value (US$ Million) by Country, 2024 to 2034

Figure 186: East Asia Market Value (US$ Million) Analysis by Country, 2019 to 2034

Figure 187: East Asia Market Volume (Units) Analysis by Country, 2019 to 2034

Figure 188: East Asia Market Value Share (%) and BPS Analysis by Country, 2024 to 2034

Figure 189: East Asia Market Y-o-Y Growth (%) Projections by Country, 2024 to 2034

Figure 190: East Asia Market Value (US$ Million) Analysis by Material, 2019 to 2034

Figure 191: East Asia Market Volume (Units) Analysis by Material, 2019 to 2034

Figure 192: East Asia Market Value Share (%) and BPS Analysis by Material, 2024 to 2034

Figure 193: East Asia Market Y-o-Y Growth (%) Projections by Material, 2024 to 2034

Figure 194: East Asia Market Value (US$ Million) Analysis by Packaging Format, 2019 to 2034

Figure 195: East Asia Market Volume (Units) Analysis by Packaging Format, 2019 to 2034

Figure 196: East Asia Market Value Share (%) and BPS Analysis by Packaging Format, 2024 to 2034

Figure 197: East Asia Market Y-o-Y Growth (%) Projections by Packaging Format, 2024 to 2034

Figure 198: East Asia Market Value (US$ Million) Analysis by Form Type, 2019 to 2034

Figure 199: East Asia Market Volume (Units) Analysis by Form Type, 2019 to 2034

Figure 200: East Asia Market Value Share (%) and BPS Analysis by Form Type, 2024 to 2034

Figure 201: East Asia Market Y-o-Y Growth (%) Projections by Form Type, 2024 to 2034

Figure 202: East Asia Market Value (US$ Million) Analysis by Chocolate Type, 2019 to 2034

Figure 203: East Asia Market Volume (Units) Analysis by Chocolate Type, 2019 to 2034

Figure 204: East Asia Market Value Share (%) and BPS Analysis by Chocolate Type, 2024 to 2034

Figure 205: East Asia Market Y-o-Y Growth (%) Projections by Chocolate Type, 2024 to 2034

Figure 206: East Asia Market Attractiveness by Material, 2024 to 2034

Figure 207: East Asia Market Attractiveness by Packaging Format, 2024 to 2034

Figure 208: East Asia Market Attractiveness by Form Type, 2024 to 2034

Figure 209: East Asia Market Attractiveness by Chocolate Type, 2024 to 2034

Figure 210: East Asia Market Attractiveness by Country, 2024 to 2034

Figure 211: Middle East and Africa Market Value (US$ Million) by Material, 2024 to 2034

Figure 212: Middle East and Africa Market Value (US$ Million) by Packaging Format, 2024 to 2034

Figure 213: Middle East and Africa Market Value (US$ Million) by Form Type, 2024 to 2034

Figure 214: Middle East and Africa Market Value (US$ Million) by Chocolate Type, 2024 to 2034

Figure 215: Middle East and Africa Market Value (US$ Million) by Country, 2024 to 2034

Figure 216: Middle East and Africa Market Value (US$ Million) Analysis by Country, 2019 to 2034

Figure 217: Middle East and Africa Market Volume (Units) Analysis by Country, 2019 to 2034

Figure 218: Middle East and Africa Market Value Share (%) and BPS Analysis by Country, 2024 to 2034

Figure 219: Middle East and Africa Market Y-o-Y Growth (%) Projections by Country, 2024 to 2034

Figure 220: Middle East and Africa Market Value (US$ Million) Analysis by Material, 2019 to 2034

Figure 221: Middle East and Africa Market Volume (Units) Analysis by Material, 2019 to 2034

Figure 222: Middle East and Africa Market Value Share (%) and BPS Analysis by Material, 2024 to 2034

Figure 223: Middle East and Africa Market Y-o-Y Growth (%) Projections by Material, 2024 to 2034

Figure 224: Middle East and Africa Market Value (US$ Million) Analysis by Packaging Format, 2019 to 2034

Figure 225: Middle East and Africa Market Volume (Units) Analysis by Packaging Format, 2019 to 2034

Figure 226: Middle East and Africa Market Value Share (%) and BPS Analysis by Packaging Format, 2024 to 2034

Figure 227: Middle East and Africa Market Y-o-Y Growth (%) Projections by Packaging Format, 2024 to 2034

Figure 228: Middle East and Africa Market Value (US$ Million) Analysis by Form Type, 2019 to 2034

Figure 229: Middle East and Africa Market Volume (Units) Analysis by Form Type, 2019 to 2034

Figure 230: Middle East and Africa Market Value Share (%) and BPS Analysis by Form Type, 2024 to 2034

Figure 231: Middle East and Africa Market Y-o-Y Growth (%) Projections by Form Type, 2024 to 2034

Figure 232: Middle East and Africa Market Value (US$ Million) Analysis by Chocolate Type, 2019 to 2034

Figure 233: Middle East and Africa Market Volume (Units) Analysis by Chocolate Type, 2019 to 2034

Figure 234: Middle East and Africa Market Value Share (%) and BPS Analysis by Chocolate Type, 2024 to 2034

Figure 235: Middle East and Africa Market Y-o-Y Growth (%) Projections by Chocolate Type, 2024 to 2034

Figure 236: Middle East and Africa Market Attractiveness by Material, 2024 to 2034

Figure 237: Middle East and Africa Market Attractiveness by Packaging Format, 2024 to 2034

Figure 238: Middle East and Africa Market Attractiveness by Form Type, 2024 to 2034

Figure 239: Middle East and Africa Market Attractiveness by Chocolate Type, 2024 to 2034

Figure 240: Middle East and Africa Market Attractiveness by Country, 2024 to 2034

Frequently Asked Questions

What is the Chocolate Bar Packaging Market Value in 2024?

The global chocolate bar packaging market is estimated to be valued at USD 815.7 million in 2024.

What is the Sales Forecast of the Market through 2034?

The market is expected to reach USD 1,291.2 million by 2034.

At What Rate is the Chocolate Bar Packaging Market Expected to Grow?

The market is growing at a CAGR of 4.70% for the forecast period of 2024 to 2034.

Who are the Key Manufacturing Companies in the Chocolate Bar Packaging Market?

Some major players in the market are Swiss Pac Pvt. Ltd., ATP-Engineering & Packaging, S.L, Shantou Weiyi Packaging Co., Ltd., etc.

Which is the Highly Preferred Material Type in the Market?

Plastic dominates the market, with an overall share of 51.30%.

Explore Similar Insights

Future Market Insights

Chocolate Bar Packaging Market