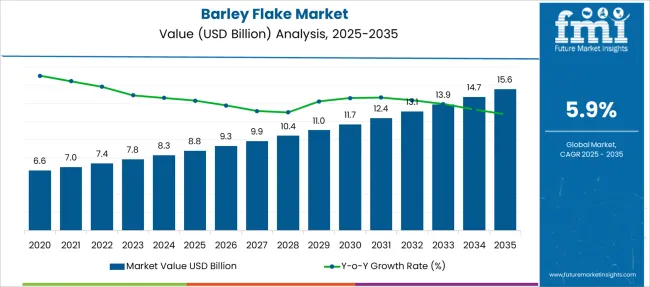
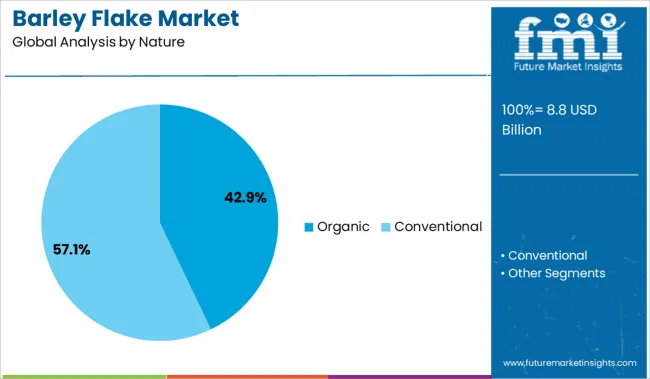
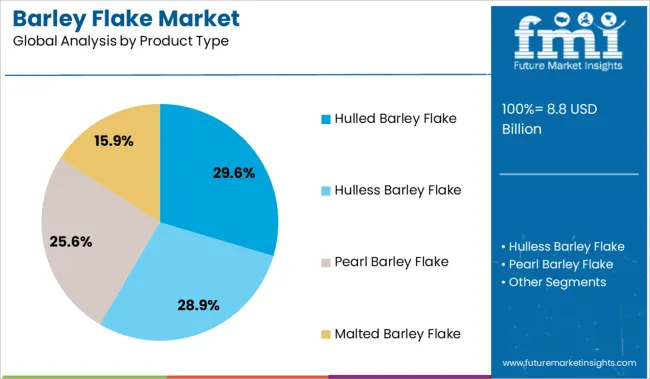
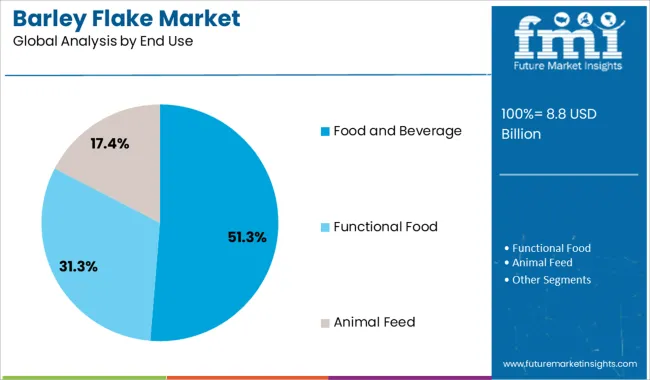
Global barley flake demand is anticipated to be valued at USD 7.35 Billion in 2022, forecast to grow at a CAGR of 5.87% to be valued at USD 13 Billion from 2022 to 2032.
Report Attribute | Details |
---|---|
Estimated Base Year Value (2021) | USD 7.07 Billion |
Expected Market Value (2022) | USD 7.35 Billion |
Anticipated Forecast Value (2032) | USD 13 Billion |
Projected Growth Rate (2022 to 2032) | 5.87% CAGR |
Barley flakes are made by husking the steamed kernels of barley grain. To make barley flakes, the steamed grains are flattened, rolled, and dried. Barley flakes are high in fiber, proteins, and other essential minerals such as copper, manganese, potassium, selenium, and others. Barley flakes can be cooked in the same way that oat flakes are.
When compared to other grains, barley flakes have a low glycemic index and thus may be a suitable food option for diabetic consumers. The barley flakes can be mixed with bakery products such as cookies, bread, and so on, as well as muesli, and served as a hot cereal. Barley flakes have a high nutritional value, and a nutty flavor, and can be used in a variety of food recipes, potentially increasing their demand in the food industry.
Increased health trends and consumer awareness are two important factors that could boost the market for barley flakes. Because of their hectic lifestyles, consumers are looking for food products with high nutritional value and ease of preparation, and barley flakes may be a good option because they are high in nutrients and require little cooking time. As a result, as barley flakes become more in line with consumer preferences, the barley flake market may expand.
The growing popularity of clean-label products could be a major driver of growth in the barley flakes market. Barley flakes can be incorporated into a variety of food products such as cookies, bread, biscuits, breakfast cereals, and so on, and can thus be used as a food ingredient by food product manufacturers to develop innovative and healthy food products, potentially attracting health-conscious consumers who prefer to use clean-label food products.
The presence of similar products such as oat flakes, as well as a lack of awareness about barley flakes, can be a significant restraint for the barley flakes market. Oat flakes are very popular among consumers due to their high nutritional value, variety of flavors, and ability to be used in the preparation of beverages, muffins, bars, cookies, and so on, and thus can serve as a significant restraint for the barley flakes market.
The Asia-Pacific region currently dominates the barley flakes market and will continue to do so during the forecast period, thanks to major manufacturers launching innovative products in order to diversify their portfolio with barley-based multigrain cereals and breakfast products.
According to Future Market Insights, North America is expected to grow rapidly due to its nutritional content, which is in high demand among the region's health-conscious citizens.
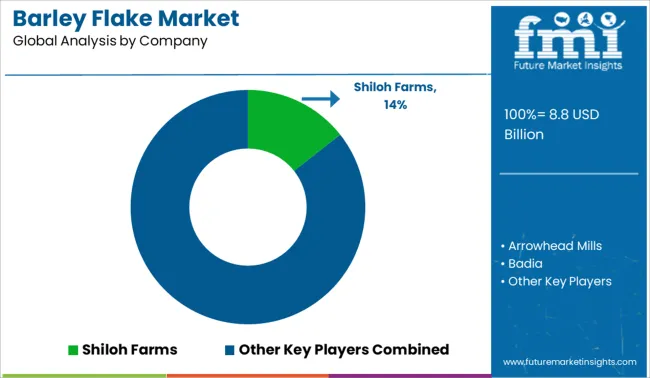
Some of the key participants present in the global Barley Flake market include King Arthur Flour, Shiloh Farms, Bob's Red Mill, Honeyville, Inc., Naturally Yours, Vee Green Organic Life Care Private Limited, Helsinki Mylly Oy, Briess Malt & Ingredients Co., Rude Health, etc., among others.
Report Attribute | Details |
---|---|
Growth Rate | CAGR of 5.87% from 2022 to 2032 |
Base Year for Estimation | 2021 |
Historical Data | 2015 to 2020 |
Forecast Period | 2022 to 2032 |
Quantitative Units | Revenue in USD Million, Volume in Kilotons, and CAGR from 2022 to 2032 |
Report Coverage | Revenue Forecast, Volume Forecast, Company Ranking, Competitive Landscape, Growth Factors, Trends, and Pricing Analysis |
Segments Covered | Nature, Product Type, End Use, Distribution Channel, Region |
Regions Covered | North America; Latin America; Europe; Asia Pacific; Middle East & Africa |
Key Countries Profiled | USA, Canada, Brazil, Argentina, Germany, United Kingdom, France, Spain, Italy, Nordics, BENELUX, Australia & New Zealand, China, India, ASIAN, GCC Countries, South Africa |
Key Companies Profiled | King Arthur Flour; Shiloh Farms; Bob's Red Mill; Honeyville, Inc.; Naturally Yours; Vee Green Organic Life Care Private Limited; Helsinki Mylly Oy; Briess Malt & Ingredients Co.; Rude Health |
Customization | Available Upon Request |
Table 01: Global Market Value (US$ Million) Forecast by Region, 2017 to 2032
Table 02: Global Market Volume (MT) Forecast by Region, 2017 to 2032
Table 03: Global Market Value (US$ Million) Forecast by Nature, 2017 to 2032
Table 04: Global Market Volume (MT) Forecast by Nature, 2017 to 2032
Table 05: Global Market Value (US$ Million) Forecast by Product Type, 2017 to 2032
Table 06: Global Market Volume (MT) Forecast by Product Type, 2017 to 2032
Table 07: Global Market Value (US$ Million) Forecast by End Use, 2017 to 2032
Table 08: Global Market Volume (MT) Forecast by End Use, 2017 to 2032
Table 09: Global Market Value (US$ Million) Forecast by Distribution Channel, 2017 to 2032
Table 10: Global Market Volume (MT) Forecast by Distribution Channel, 2017 to 2032
Table 11: North America Market Value (US$ Million) Forecast by Country, 2017 to 2032
Table 12: North America Market Volume (MT) Forecast by Country, 2017 to 2032
Table 13: North America Market Value (US$ Million) Forecast by Nature, 2017 to 2032
Table 14: North America Market Volume (MT) Forecast by Nature, 2017 to 2032
Table 15: North America Market Value (US$ Million) Forecast by Product Type, 2017 to 2032
Table 16: North America Market Volume (MT) Forecast by Product Type, 2017 to 2032
Table 17: North America Market Value (US$ Million) Forecast by End Use, 2017 to 2032
Table 18: North America Market Volume (MT) Forecast by End Use, 2017 to 2032
Table 19: North America Market Value (US$ Million) Forecast by Distribution Channel, 2017 to 2032
Table 20: North America Market Volume (MT) Forecast by Distribution Channel, 2017 to 2032
Table 21: Latin America Market Value (US$ Million) Forecast by Country, 2017 to 2032
Table 22: Latin America Market Volume (MT) Forecast by Country, 2017 to 2032
Table 23: Latin America Market Value (US$ Million) Forecast by Nature, 2017 to 2032
Table 24: Latin America Market Volume (MT) Forecast by Nature, 2017 to 2032
Table 25: Latin America Market Value (US$ Million) Forecast by Product Type, 2017 to 2032
Table 26: Latin America Market Volume (MT) Forecast by Product Type, 2017 to 2032
Table 27: Latin America Market Value (US$ Million) Forecast by End Use, 2017 to 2032
Table 28: Latin America Market Volume (MT) Forecast by End Use, 2017 to 2032
Table 29: Latin America Market Value (US$ Million) Forecast by Distribution Channel, 2017 to 2032
Table 30: Latin America Market Volume (MT) Forecast by Distribution Channel, 2017 to 2032
Table 31: Europe Market Value (US$ Million) Forecast by Country, 2017 to 2032
Table 32: Europe Market Volume (MT) Forecast by Country, 2017 to 2032
Table 33: Europe Market Value (US$ Million) Forecast by Nature, 2017 to 2032
Table 34: Europe Market Volume (MT) Forecast by Nature, 2017 to 2032
Table 35: Europe Market Value (US$ Million) Forecast by Product Type, 2017 to 2032
Table 36: Europe Market Volume (MT) Forecast by Product Type, 2017 to 2032
Table 37: Europe Market Value (US$ Million) Forecast by End Use, 2017 to 2032
Table 38: Europe Market Volume (MT) Forecast by End Use, 2017 to 2032
Table 39: Europe Market Value (US$ Million) Forecast by Distribution Channel, 2017 to 2032
Table 40: Europe Market Volume (MT) Forecast by Distribution Channel, 2017 to 2032
Table 41: East Asia Market Value (US$ Million) Forecast by Country, 2017 to 2032
Table 42: East Asia Market Volume (MT) Forecast by Country, 2017 to 2032
Table 43: East Asia Market Value (US$ Million) Forecast by Nature, 2017 to 2032
Table 44: East Asia Market Volume (MT) Forecast by Nature, 2017 to 2032
Table 45: East Asia Market Value (US$ Million) Forecast by Product Type, 2017 to 2032
Table 46: East Asia Market Volume (MT) Forecast by Product Type, 2017 to 2032
Table 47: East Asia Market Value (US$ Million) Forecast by End Use, 2017 to 2032
Table 48: East Asia Market Volume (MT) Forecast by End Use, 2017 to 2032
Table 49: East Asia Market Value (US$ Million) Forecast by Distribution Channel, 2017 to 2032
Table 50: East Asia Market Volume (MT) Forecast by Distribution Channel, 2017 to 2032
Table 51: South Asia & Pacific Market Value (US$ Million) Forecast by Country, 2017 to 2032
Table 52: South Asia & Pacific Market Volume (MT) Forecast by Country, 2017 to 2032
Table 53: South Asia & Pacific Market Value (US$ Million) Forecast by Nature, 2017 to 2032
Table 54: South Asia & Pacific Market Volume (MT) Forecast by Nature, 2017 to 2032
Table 55: South Asia & Pacific Market Value (US$ Million) Forecast by Product Type, 2017 to 2032
Table 56: South Asia & Pacific Market Volume (MT) Forecast by Product Type, 2017 to 2032
Table 57: South Asia & Pacific Market Value (US$ Million) Forecast by End Use, 2017 to 2032
Table 58: South Asia & Pacific Market Volume (MT) Forecast by End Use, 2017 to 2032
Table 59: South Asia & Pacific Market Value (US$ Million) Forecast by Distribution Channel, 2017 to 2032
Table 60: South Asia & Pacific Market Volume (MT) Forecast by Distribution Channel, 2017 to 2032
Table 61: MEA Market Value (US$ Million) Forecast by Country, 2017 to 2032
Table 62: MEA Market Volume (MT) Forecast by Country, 2017 to 2032
Table 63: MEA Market Value (US$ Million) Forecast by Nature, 2017 to 2032
Table 64: MEA Market Volume (MT) Forecast by Nature, 2017 to 2032
Table 65: MEA Market Value (US$ Million) Forecast by Product Type, 2017 to 2032
Table 66: MEA Market Volume (MT) Forecast by Product Type, 2017 to 2032
Table 67: MEA Market Value (US$ Million) Forecast by End Use, 2017 to 2032
Table 68: MEA Market Volume (MT) Forecast by End Use, 2017 to 2032
Table 69: MEA Market Value (US$ Million) Forecast by Distribution Channel, 2017 to 2032
Table 70: MEA Market Volume (MT) Forecast by Distribution Channel, 2017 to 2032
Figure 01: Global Market Value (US$ Million) by Nature, 2022 to 2032
Figure 02: Global Market Value (US$ Million) by Product Type, 2022 to 2032
Figure 03: Global Market Value (US$ Million) by End Use, 2022 to 2032
Figure 04: Global Market Value (US$ Million) by Distribution Channel, 2022 to 2032
Figure 05: Global Market Value (US$ Million) by Region, 2022 to 2032
Figure 06: Global Market Value (US$ Million) Analysis by Region, 2017 to 2032
Figure 07: Global Market Volume (MT) Analysis by Region, 2017 to 2032
Figure 08: Global Market Value Share (%) and BPS Analysis by Region, 2022 to 2032
Figure 09: Global Market Y-o-Y Growth (%) Projections by Region, 2022 to 2032
Figure 10: Global Market Value (US$ Million) Analysis by Nature, 2017 to 2032
Figure 11: Global Market Volume (MT) Analysis by Nature, 2017 to 2032
Figure 12: Global Market Value Share (%) and BPS Analysis by Nature, 2022 to 2032
Figure 13: Global Market Y-o-Y Growth (%) Projections by Nature, 2022 to 2032
Figure 14: Global Market Value (US$ Million) Analysis by Product Type, 2017 to 2032
Figure 15: Global Market Volume (MT) Analysis by Product Type, 2017 to 2032
Figure 16: Global Market Value Share (%) and BPS Analysis by Product Type, 2022 to 2032
Figure 17: Global Market Y-o-Y Growth (%) Projections by Product Type, 2022 to 2032
Figure 18: Global Market Value (US$ Million) Analysis by End Use, 2017 to 2032
Figure 19: Global Market Volume (MT) Analysis by End Use, 2017 to 2032
Figure 20: Global Market Value Share (%) and BPS Analysis by End Use, 2022 to 2032
Figure 21: Global Market Y-o-Y Growth (%) Projections by End Use, 2022 to 2032
Figure 22: Global Market Value (US$ Million) Analysis by Distribution Channel, 2017 to 2032
Figure 23: Global Market Volume (MT) Analysis by Distribution Channel, 2017 to 2032
Figure 24: Global Market Value Share (%) and BPS Analysis by Distribution Channel, 2022 to 2032
Figure 25: Global Market Y-o-Y Growth (%) Projections by Distribution Channel, 2022 to 2032
Figure 26: Global Market Attractiveness by Nature, 2022 to 2032
Figure 27: Global Market Attractiveness by Product Type, 2022 to 2032
Figure 28: Global Market Attractiveness by End Use, 2022 to 2032
Figure 29: Global Market Attractiveness by Distribution Channel, 2022 to 2032
Figure 30: Global Market Attractiveness by Region, 2022 to 2032
Figure 31: North America Market Value (US$ Million) by Nature, 2022 to 2032
Figure 32: North America Market Value (US$ Million) by Product Type, 2022 to 2032
Figure 33: North America Market Value (US$ Million) by End Use, 2022 to 2032
Figure 34: North America Market Value (US$ Million) by Distribution Channel, 2022 to 2032
Figure 35: North America Market Value (US$ Million) by Country, 2022 to 2032
Figure 36: North America Market Value (US$ Million) Analysis by Country, 2017 to 2032
Figure 37: North America Market Volume (MT) Analysis by Country, 2017 to 2032
Figure 38: North America Market Value Share (%) and BPS Analysis by Country, 2022 to 2032
Figure 39: North America Market Y-o-Y Growth (%) Projections by Country, 2022 to 2032
Figure 40: North America Market Value (US$ Million) Analysis by Nature, 2017 to 2032
Figure 41: North America Market Volume (MT) Analysis by Nature, 2017 to 2032
Figure 42: North America Market Value Share (%) and BPS Analysis by Nature, 2022 to 2032
Figure 43: North America Market Y-o-Y Growth (%) Projections by Nature, 2022 to 2032
Figure 44: North America Market Value (US$ Million) Analysis by Product Type, 2017 to 2032
Figure 45: North America Market Volume (MT) Analysis by Product Type, 2017 to 2032
Figure 46: North America Market Value Share (%) and BPS Analysis by Product Type, 2022 to 2032
Figure 47: North America Market Y-o-Y Growth (%) Projections by Product Type, 2022 to 2032
Figure 48: North America Market Value (US$ Million) Analysis by End Use, 2017 to 2032
Figure 49: North America Market Volume (MT) Analysis by End Use, 2017 to 2032
Figure 50: North America Market Value Share (%) and BPS Analysis by End Use, 2022 to 2032
Figure 51: North America Market Y-o-Y Growth (%) Projections by End Use, 2022 to 2032
Figure 52: North America Market Value (US$ Million) Analysis by Distribution Channel, 2017 to 2032
Figure 53: North America Market Volume (MT) Analysis by Distribution Channel, 2017 to 2032
Figure 54: North America Market Value Share (%) and BPS Analysis by Distribution Channel, 2022 to 2032
Figure 55: North America Market Y-o-Y Growth (%) Projections by Distribution Channel, 2022 to 2032
Figure 56: North America Market Attractiveness by Nature, 2022 to 2032
Figure 57: North America Market Attractiveness by Product Type, 2022 to 2032
Figure 58: North America Market Attractiveness by End Use, 2022 to 2032
Figure 59: North America Market Attractiveness by Distribution Channel, 2022 to 2032
Figure 60: North America Market Attractiveness by Country, 2022 to 2032
Figure 61: Latin America Market Value (US$ Million) by Nature, 2022 to 2032
Figure 62: Latin America Market Value (US$ Million) by Product Type, 2022 to 2032
Figure 63: Latin America Market Value (US$ Million) by End Use, 2022 to 2032
Figure 64: Latin America Market Value (US$ Million) by Distribution Channel, 2022 to 2032
Figure 65: Latin America Market Value (US$ Million) by Country, 2022 to 2032
Figure 66: Latin America Market Value (US$ Million) Analysis by Country, 2017 to 2032
Figure 67: Latin America Market Volume (MT) Analysis by Country, 2017 to 2032
Figure 68: Latin America Market Value Share (%) and BPS Analysis by Country, 2022 to 2032
Figure 69: Latin America Market Y-o-Y Growth (%) Projections by Country, 2022 to 2032
Figure 70: Latin America Market Value (US$ Million) Analysis by Nature, 2017 to 2032
Figure 71: Latin America Market Volume (MT) Analysis by Nature, 2017 to 2032
Figure 72: Latin America Market Value Share (%) and BPS Analysis by Nature, 2022 to 2032
Figure 73: Latin America Market Y-o-Y Growth (%) Projections by Nature, 2022 to 2032
Figure 74: Latin America Market Value (US$ Million) Analysis by Product Type, 2017 to 2032
Figure 75: Latin America Market Volume (MT) Analysis by Product Type, 2017 to 2032
Figure 76: Latin America Market Value Share (%) and BPS Analysis by Product Type, 2022 to 2032
Figure 77: Latin America Market Y-o-Y Growth (%) Projections by Product Type, 2022 to 2032
Figure 78: Latin America Market Value (US$ Million) Analysis by End Use, 2017 to 2032
Figure 79: Latin America Market Volume (MT) Analysis by End Use, 2017 to 2032
Figure 80: Latin America Market Value Share (%) and BPS Analysis by End Use, 2022 to 2032
Figure 81: Latin America Market Y-o-Y Growth (%) Projections by End Use, 2022 to 2032
Figure 82: Latin America Market Value (US$ Million) Analysis by Distribution Channel, 2017 to 2032
Figure 83: Latin America Market Volume (MT) Analysis by Distribution Channel, 2017 to 2032
Figure 84: Latin America Market Value Share (%) and BPS Analysis by Distribution Channel, 2022 to 2032
Figure 85: Latin America Market Y-o-Y Growth (%) Projections by Distribution Channel, 2022 to 2032
Figure 86: Latin America Market Attractiveness by Nature, 2022 to 2032
Figure 87: Latin America Market Attractiveness by Product Type, 2022 to 2032
Figure 88: Latin America Market Attractiveness by End Use, 2022 to 2032
Figure 89: Latin America Market Attractiveness by Distribution Channel, 2022 to 2032
Figure 90: Latin America Market Attractiveness by Country, 2022 to 2032
Figure 91: Europe Market Value (US$ Million) by Nature, 2022 to 2032
Figure 92: Europe Market Value (US$ Million) by Product Type, 2022 to 2032
Figure 93: Europe Market Value (US$ Million) by End Use, 2022 to 2032
Figure 94: Europe Market Value (US$ Million) by Distribution Channel, 2022 to 2032
Figure 95: Europe Market Value (US$ Million) by Country, 2022 to 2032
Figure 96: Europe Market Value (US$ Million) Analysis by Country, 2017 to 2032
Figure 97: Europe Market Volume (MT) Analysis by Country, 2017 to 2032
Figure 98: Europe Market Value Share (%) and BPS Analysis by Country, 2022 to 2032
Figure 99: Europe Market Y-o-Y Growth (%) Projections by Country, 2022 to 2032
Figure 100: Europe Market Value (US$ Million) Analysis by Nature, 2017 to 2032
Figure 101: Europe Market Volume (MT) Analysis by Nature, 2017 to 2032
Figure 102: Europe Market Value Share (%) and BPS Analysis by Nature, 2022 to 2032
Figure 103: Europe Market Y-o-Y Growth (%) Projections by Nature, 2022 to 2032
Figure 104: Europe Market Value (US$ Million) Analysis by Product Type, 2017 to 2032
Figure 105: Europe Market Volume (MT) Analysis by Product Type, 2017 to 2032
Figure 106: Europe Market Value Share (%) and BPS Analysis by Product Type, 2022 to 2032
Figure 107: Europe Market Y-o-Y Growth (%) Projections by Product Type, 2022 to 2032
Figure 108: Europe Market Value (US$ Million) Analysis by End Use, 2017 to 2032
Figure 109: Europe Market Volume (MT) Analysis by End Use, 2017 to 2032
Figure 110: Europe Market Value Share (%) and BPS Analysis by End Use, 2022 to 2032
Figure 111: Europe Market Y-o-Y Growth (%) Projections by End Use, 2022 to 2032
Figure 112: Europe Market Value (US$ Million) Analysis by Distribution Channel, 2017 to 2032
Figure 113: Europe Market Volume (MT) Analysis by Distribution Channel, 2017 to 2032
Figure 114: Europe Market Value Share (%) and BPS Analysis by Distribution Channel, 2022 to 2032
Figure 115: Europe Market Y-o-Y Growth (%) Projections by Distribution Channel, 2022 to 2032
Figure 116: Europe Market Attractiveness by Nature, 2022 to 2032
Figure 117: Europe Market Attractiveness by Product Type, 2022 to 2032
Figure 118: Europe Market Attractiveness by End Use, 2022 to 2032
Figure 119: Europe Market Attractiveness by Distribution Channel, 2022 to 2032
Figure 120: Europe Market Attractiveness by Country, 2022 to 2032
Figure 121: East Asia Market Value (US$ Million) by Nature, 2022 to 2032
Figure 122: East Asia Market Value (US$ Million) by Product Type, 2022 to 2032
Figure 123: East Asia Market Value (US$ Million) by End Use, 2022 to 2032
Figure 124: East Asia Market Value (US$ Million) by Distribution Channel, 2022 to 2032
Figure 125: East Asia Market Value (US$ Million) by Country, 2022 to 2032
Figure 126: East Asia Market Value (US$ Million) Analysis by Country, 2017 to 2032
Figure 127: East Asia Market Volume (MT) Analysis by Country, 2017 to 2032
Figure 128: East Asia Market Value Share (%) and BPS Analysis by Country, 2022 to 2032
Figure 129: East Asia Market Y-o-Y Growth (%) Projections by Country, 2022 to 2032
Figure 130: East Asia Market Value (US$ Million) Analysis by Nature, 2017 to 2032
Figure 131: East Asia Market Volume (MT) Analysis by Nature, 2017 to 2032
Figure 132: East Asia Market Value Share (%) and BPS Analysis by Nature, 2022 to 2032
Figure 133: East Asia Market Y-o-Y Growth (%) Projections by Nature, 2022 to 2032
Figure 134: East Asia Market Value (US$ Million) Analysis by Product Type, 2017 to 2032
Figure 135: East Asia Market Volume (MT) Analysis by Product Type, 2017 to 2032
Figure 136: East Asia Market Value Share (%) and BPS Analysis by Product Type, 2022 to 2032
Figure 137: East Asia Market Y-o-Y Growth (%) Projections by Product Type, 2022 to 2032
Figure 138: East Asia Market Value (US$ Million) Analysis by End Use, 2017 to 2032
Figure 139: East Asia Market Volume (MT) Analysis by End Use, 2017 to 2032
Figure 140: East Asia Market Value Share (%) and BPS Analysis by End Use, 2022 to 2032
Figure 141: East Asia Market Y-o-Y Growth (%) Projections by End Use, 2022 to 2032
Figure 142: East Asia Market Value (US$ Million) Analysis by Distribution Channel, 2017 to 2032
Figure 143: East Asia Market Volume (MT) Analysis by Distribution Channel, 2017 to 2032
Figure 144: East Asia Market Value Share (%) and BPS Analysis by Distribution Channel, 2022 to 2032
Figure 145: East Asia Market Y-o-Y Growth (%) Projections by Distribution Channel, 2022 to 2032
Figure 146: East Asia Market Attractiveness by Nature, 2022 to 2032
Figure 147: East Asia Market Attractiveness by Product Type, 2022 to 2032
Figure 148: East Asia Market Attractiveness by End Use, 2022 to 2032
Figure 149: East Asia Market Attractiveness by Distribution Channel, 2022 to 2032
Figure 150: East Asia Market Attractiveness by Country, 2022 to 2032
Figure 151: South Asia & Pacific Market Value (US$ Million) by Nature, 2022 to 2032
Figure 152: South Asia & Pacific Market Value (US$ Million) by Product Type, 2022 to 2032
Figure 153: South Asia & Pacific Market Value (US$ Million) by End Use, 2022 to 2032
Figure 154: South Asia & Pacific Market Value (US$ Million) by Distribution Channel, 2022 to 2032
Figure 155: South Asia & Pacific Market Value (US$ Million) by Country, 2022 to 2032
Figure 156: South Asia & Pacific Market Value (US$ Million) Analysis by Country, 2017 to 2032
Figure 157: South Asia & Pacific Market Volume (MT) Analysis by Country, 2017 to 2032
Figure 158: South Asia & Pacific Market Value Share (%) and BPS Analysis by Country, 2022 to 2032
Figure 159: South Asia & Pacific Market Y-o-Y Growth (%) Projections by Country, 2022 to 2032
Figure 160: South Asia & Pacific Market Value (US$ Million) Analysis by Nature, 2017 to 2032
Figure 161: South Asia & Pacific Market Volume (MT) Analysis by Nature, 2017 to 2032
Figure 162: South Asia & Pacific Market Value Share (%) and BPS Analysis by Nature, 2022 to 2032
Figure 163: South Asia & Pacific Market Y-o-Y Growth (%) Projections by Nature, 2022 to 2032
Figure 164: South Asia & Pacific Market Value (US$ Million) Analysis by Product Type, 2017 to 2032
Figure 165: South Asia & Pacific Market Volume (MT) Analysis by Product Type, 2017 to 2032
Figure 166: South Asia & Pacific Market Value Share (%) and BPS Analysis by Product Type, 2022 to 2032
Figure 167: South Asia & Pacific Market Y-o-Y Growth (%) Projections by Product Type, 2022 to 2032
Figure 168: South Asia & Pacific Market Value (US$ Million) Analysis by End Use, 2017 to 2032
Figure 169: South Asia & Pacific Market Volume (MT) Analysis by End Use, 2017 to 2032
Figure 170: South Asia & Pacific Market Value Share (%) and BPS Analysis by End Use, 2022 to 2032
Figure 171: South Asia & Pacific Market Y-o-Y Growth (%) Projections by End Use, 2022 to 2032
Figure 172: South Asia & Pacific Market Value (US$ Million) Analysis by Distribution Channel, 2017 to 2032
Figure 173: South Asia & Pacific Market Volume (MT) Analysis by Distribution Channel, 2017 to 2032
Figure 174: South Asia & Pacific Market Value Share (%) and BPS Analysis by Distribution Channel, 2022 to 2032
Figure 175: South Asia & Pacific Market Y-o-Y Growth (%) Projections by Distribution Channel, 2022 to 2032
Figure 176: South Asia & Pacific Market Attractiveness by Nature, 2022 to 2032
Figure 177: South Asia & Pacific Market Attractiveness by Product Type, 2022 to 2032
Figure 178: South Asia & Pacific Market Attractiveness by End Use, 2022 to 2032
Figure 179: South Asia & Pacific Market Attractiveness by Distribution Channel, 2022 to 2032
Figure 180: South Asia & Pacific Market Attractiveness by Country, 2022 to 2032
Figure 181: MEA Market Value (US$ Million) by Nature, 2022 to 2032
Figure 182: MEA Market Value (US$ Million) by Product Type, 2022 to 2032
Figure 183: MEA Market Value (US$ Million) by End Use, 2022 to 2032
Figure 184: MEA Market Value (US$ Million) by Distribution Channel, 2022 to 2032
Figure 185: MEA Market Value (US$ Million) by Country, 2022 to 2032
Figure 186: MEA Market Value (US$ Million) Analysis by Country, 2017 to 2032
Figure 187: MEA Market Volume (MT) Analysis by Country, 2017 to 2032
Figure 188: MEA Market Value Share (%) and BPS Analysis by Country, 2022 to 2032
Figure 189: MEA Market Y-o-Y Growth (%) Projections by Country, 2022 to 2032
Figure 190: MEA Market Value (US$ Million) Analysis by Nature, 2017 to 2032
Figure 191: MEA Market Volume (MT) Analysis by Nature, 2017 to 2032
Figure 192: MEA Market Value Share (%) and BPS Analysis by Nature, 2022 to 2032
Figure 193: MEA Market Y-o-Y Growth (%) Projections by Nature, 2022 to 2032
Figure 194: MEA Market Value (US$ Million) Analysis by Product Type, 2017 to 2032
Figure 195: MEA Market Volume (MT) Analysis by Product Type, 2017 to 2032
Figure 196: MEA Market Value Share (%) and BPS Analysis by Product Type, 2022 to 2032
Figure 197: MEA Market Y-o-Y Growth (%) Projections by Product Type, 2022 to 2032
Figure 198: MEA Market Value (US$ Million) Analysis by End Use, 2017 to 2032
Figure 199: MEA Market Volume (MT) Analysis by End Use, 2017 to 2032
Figure 200: MEA Market Value Share (%) and BPS Analysis by End Use, 2022 to 2032
Figure 201: MEA Market Y-o-Y Growth (%) Projections by End Use, 2022 to 2032
Figure 202: MEA Market Value (US$ Million) Analysis by Distribution Channel, 2017 to 2032
Figure 203: MEA Market Volume (MT) Analysis by Distribution Channel, 2017 to 2032
Figure 204: MEA Market Value Share (%) and BPS Analysis by Distribution Channel, 2022 to 2032
Figure 205: MEA Market Y-o-Y Growth (%) Projections by Distribution Channel, 2022 to 2032
Figure 206: MEA Market Attractiveness by Nature, 2022 to 2032
Figure 207: MEA Market Attractiveness by Product Type, 2022 to 2032
Figure 208: MEA Market Attractiveness by End Use, 2022 to 2032
Figure 209: MEA Market Attractiveness by Distribution Channel, 2022 to 2032
Figure 210: MEA Market Attractiveness by Country, 2022 to 2032
FMI projects the global Barley Flake market to expand at a 5.87% value CAGR by 2032
Asia Pacific is expected to be the most opportunistic barley flake market.
King Arthur Flour, Shiloh Farms, Bob's Red Mill, Honeyville, Inc., Naturally Yours, Vee Green Organic Life Care Private Limited, Helsinki Mylly Oy, Briess Malt & Ingredients Co., Rude Health, are some prominent Barley Flake manufacturers.
Explore Similar Insights
Thank you!
You will receive an email from our Business Development Manager. Please be sure to check your SPAM/JUNK folder too.