Reports

- Global Locations -

Headquarters

Future Market Insights, Inc.

Christiana Corporate, 200
Continental Drive, Suite 401,
Newark, Delaware - 19713,
United States

T: +1-845-579-5705

Americas

Future Market Insights, Inc.

616 Corporate Way, Suite 2-9018,
Valley Cottage, NY 10989, United States

T: +1-347-918-3531

MEA

Future Market Insights

1602-6 Jumeirah Bay X2 Tower, Plot No: JLT-PH2-X2A,
Jumeirah Lakes Towers, Dubai,
United Arab Emirates

Europe

Future Market Insights

3rd Floor, 207 Regent Street,
W1B 3HH London
United Kingdom

T: + 44 (0) 20 8123 9659
D: +44 (0) 20 3287 4268

Asia Pacific

Future Market Insights

IndiaLand Global Tech Park, Unit UG-1, Behind Grand HighStreet, Phase 1, Hinjawadi, MH, Pune – 411057, India

Flakes Making Machine Market Outlook (2023 to 2033)

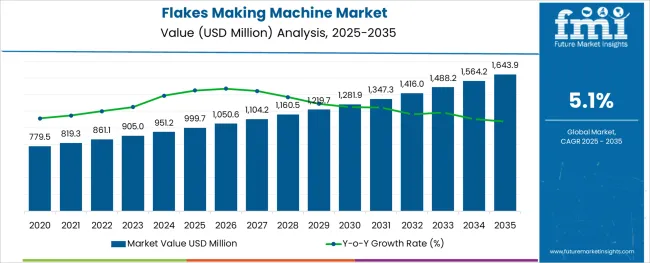
The flakes-making machine market which was estimated to be worth US$ 905 Million in 2023, is expected to grow to US$ 1485 Million by 2033, at a compound annual growth rate (CAGR) of 5.1% from 2023 to 2033. According to forecasts, the global flakes-making machine market may expand as more focus is placed on the development of novel value-added cereal flakes with cutting-edge flavors. Governments all over the world have shut down offices, production facilities, and markets due to the COVID-19 pandemic, which has disrupted the value chain. This has harmed the availability of raw materials for flake-making machines.

Attributes Details
Flakes Making Machine Market CAGR (2023 to 2033) 5.1%
Flakes Making Machine Market Size (2023) US$ 905 Million
Flakes Making Machine Market Size (2033) US$ 1485 Million

Don't pay for what you don't need

Customize your report by selecting specific countries or regions and save 30%!

Insight into Key Product Types Stimulating Growth of the Market

The significant expansion of the ready-to-eat food sector in emerging economies is anticipated to be the main driver of demand for flakes-making machines. Given that the lure of not having to prepare meals after a long day at work is too alluring, an expanding global population is moving toward a busy lifestyle, which has significantly increased the demand for ready-to-eat and simple-to-prepare meals.

The consumption of packaged and nutritious foods has seen a dramatic increase in the past thanks to trends and the economy. The flakes-making machine market may have plenty of growth potential in the years to come due to the shift in dietary habits and the rise in the consumption of processed foods.

Brief Assessment of Challenges Impacting the Market

Over the past few years, there has been a noticeable rise in the burden of lifestyle diseases like diabetes, obesity, and others.

The International Diabetes Federation estimates that in India, 9.6% of the population, or close to 74.19 million people, would have diabetes by the year 2021.

Due to their high sugar and carbohydrate content, cereal flakes can increase blood sugar levels and risk of diabetes and heart disease; hence people with diabetes are consuming fewer of these foods. This is anticipated to reduce sales in the global flakes-making machine market on the whole.

The availability of substitute products like energy drinks, yogurt, eggs, fresh fruit, and yoga bars as well as the high lactose intolerance in the Far Eastern countries may be the main obstacles to the flakes-making machine market expansion.

More than 50% of edible flakes are eaten with milk, but due to the high lactose content of milk, most consumers find it difficult to digest milk for breakfast in the morning. This hinders the flakes-making machine market trends on the whole because when the demand for flakes to reduce the demand for flakes-making machines may be automatically affected.

Nandini Roy Choudhury

Principal Consultant

Talk to Analyst

Find your sweet spots for generating winning opportunities in this market.

Manufacturers Ramping up Their Production of High-Quality Products

The excellent quality of these machines, which major manufacturers work to produce, is the primary factor driving the sales of flakes-making machines. Several important players manufacture their machines using cutting-edge methods and premium components.

Additionally, they want to offer top-notch equipment to their loyal customers all around the world with the assistance of qualified technical professionals. In addition to producing cornflakes, these machines are also capable of producing jowar, poha, millets, etc.

The equipment is economical and consistently produces flakes at the highest throughputs. It is predicted that this may increase demand for flakes-making machines. Additionally, the flakes-making machine is ideal since it has a small footprint, an integrated control unit, and the requisite precision to flake everything from soft seeds to cracked soybeans.

Customers can make mechanical and hydraulic changes to modify the flake thickness while the machine is operating. This contributes to a reduction in overall operating costs and an improvement in production capacity, thus assisting in the expansion of the flakes-making machine market share.

Food and Beverage Industry Driven By Population Growth and Rising Per Capita Income

According to the United Nations, the population is rapidly increasing, reaching 7.12 billion in 2013 and is expected to reach 9.6 billion by the end of 2050.

The primary cause of exponential population growth is increased life expectancy due to improved medical care and nutrition. This to lead to an increase in healthy processed food consumption, which might fuel the rising flakes-making machine market trend.

Food and beverage industry growth is being driven mostly by developing countries such as India, China, and Brazil, as economies improve and the middle-class population rises.

Get the data you need at a Fraction of the cost

Personalize your report by choosing insights you need
and save 40%!

Comparative View of Adjacent Flakes Making Machine Market 

Flakes Making Machine Market:

Attributes Flakes Making Machine Market
CAGR (2023 to 2033) 5.1%
Market Value (2023) US$ 905 Million
Growth Factor Due to growing concerns about health and leading a healthy lifestyle, consumers all over the world are incorporating whole-grain foods into their daily routines and aiming to consume more nutritious foods. This is helping to increase market demand for flakes-making machines.
Opportunity Demand for flakes making machines is increasing quickly as consumers' preferences for healthy snacks change.
Key Trends Due to an increase in the number of overweight people and the introduction of novel value-added ingredients for flake-making machines, demand for healthy food products is growing, which is further accelerating flakes making machine market growth.

Ice Maker Market:

Attributes Ice Maker Market
CAGR (2023 to 2033) 5.5%
Market Value (2023) US$ 1.67 billion
Growth Factor Demand for ice makers is probably being driven by the growing fast-food industry and the developing food and beverage sector globally.
Opportunity The healthcare sector's growing requirement for energy-efficient ice makers to save on water and electricity to hasten market penetration.
Key Trends New ice maker market opportunities arise from the growing use of ice makers in the household, commercial, and industrial sectors to store perishable goods.

Organic Ice Cream Market:

Attributes Organic Ice Cream Market
CAGR (2023 2033) 4%
Market Value (2023) US$ 1111.37 Million
Growth Factor The growth of the organic ice cream market is fueled by factors like rising health consciousness and shifting consumer tastes toward nutrient-rich foods due to the many health benefits they provide.
Opportunity It is projected that a sharp increase in the product adoption rate for the production of sweetening agents, sorbets, shakes, and smoothies to increase demand for the product across artisanal, impulsive, and take-home items.
Key Trends The organic ice cream industry landscape experiences new opportunities due to the quick development of technology in the fields of cold chain infrastructure, equipment, and storage facilities.

Brief About Key Applications in the Market

The semi-automatic flakes-making machine segment is expected to grow at the fastest CAGR of 4.8% between 2023 and 2033.

Whereas the automatic flakes-making machine is to follow it. Flakes processing lines are built in the sectors that process confectionery goods and make snacks. This device includes an extruder, a spiral elevator, and a mixer for flour, an oven, an air conveyor, and a spraying device. It can create shapes like rings, discs, stars, and rounds.

Details on Leading Product Types Driving the Market Expansion

Corn flakes machine segment in the market for flakes making machine are expected to grow at the fastest CAGR of 5.4% between 2023 and 2033. The Corn flakes machine segment is expected to maintain its lead throughout the forecast period due to its widespread consumption among working-class people worldwide, particularly in North America and Europe.

Breakfast cereal is one of the largest markets in the USA. Furthermore, since the Kellogg brothers introduced cornflakes in the late 1800s in the USA, these products have maintained their popularity in the country to this day.

Rice flakes machines in the flakes-making machine market are expected to grow at the second fastest CAGR during the forecast period, owing to rising demand for healthy foods among the world's young people.

Outline of Important Trends Shaping Market Expansion

During the predicted period, the direct procurement channel had the highest share in the market for flake-making machines. Product sales through this channel are being driven by rising consumer desires for nutritious snacks with a wide range of tastes and long shelf life.

These consumer trends are expected to keep this distribution channel ahead of the competition over the projected period. For the forecast period, the eCommerce Platforms channel is expected to be the fastest expanding. The segment's growth is being aided by expanding e-commerce penetration as a result of increased internet and smartphone adoption around the world for the market for flakes-making machines.

Benefits such as doorstep delivery, easy accessibility, big discounts, and a wide range of product alternatives are driving sales of ready-to-eat products through the online distribution channel.

Additionally, due to changing consumer preferences, internet behemoths like Tesco.com, Walmart.com, Amazon Prime Pantry, Yihaodian, Godrej Nature's Basket, Alibaba, and Honestbee are aggressively expanding. The demand for flakes-making machines is anticipated to increase through this channel as a result of these market developments.
Regional Outlook

Why Do the Flakes Making Market Witness the Strongest Growth In North America?

During the projection period of 2022 to 2032, North America is expected to expand the quickest in the flakes-making machine market, according to FMI.

Cereal fakes are quickly becoming a popular breakfast and snack option, especially among children in nations like the USA and Canada, as consumers' preferences for all-natural food products and the use of cereals rise across modernized civilizations. Therefore the adoption of flakes-making machines is also rising.

United States

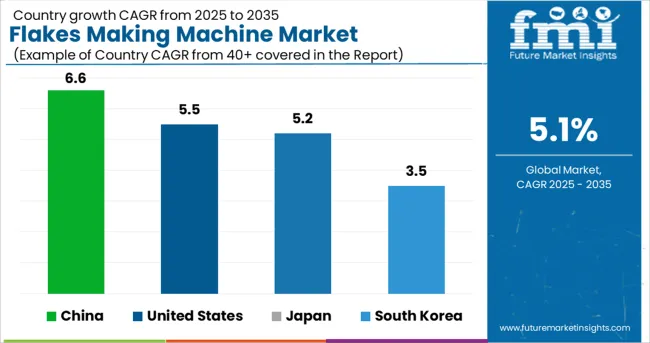
United States is expected to expand the quickest in the flakes-making machine market with a CAGR of 5.5% for the forecast period of 2023 to 2033.

Due to the existence of nations with high morning cereal consumption, such as the USA, the USA has grown to be the largest regional flakes-making machine market with a share of US$ 371.25 Million by 2033.

Additionally, customers in the area are gradually incorporating healthier food items into their everyday diets, such as wheat and cereal snacks. New markets are opening up for the product as the region's obesity issues worsen.

Why Is the Asia Pacific Market Demand for Flakes Making Machines So Strong?

China

China is anticipated to develop at a CAGR of 6.6% from 2023 to 2033, according to Future Market Insights. By 2033, the Chinese market for flakes-making machines is expected to be worth US$ 222.75 Million. Consuming whole-grain cereal flakes is thought to have a number of health advantages, including a reduced risk of chronic illnesses including cancer and cardiovascular ailments.

Thus, as consumer preferences for healthy snacks change, the demand for flakes-making machines is increasing quickly. To meet this growing demand, renowned producers plan to release revolutionary cereal flakes with cutting-edge flavors.

Japan

Japan is expected to develop at the fastest CAGR of 5.2% between 2023 and 2033 due to a rising trend among working-class individuals and recent college graduates worldwide. By 2033, the Japanese market for flakes-making machines is expected to be worth US$93.555 Million.

South Korea

From 2023 to 2033, South Korea is expected to experience the fastest CAGR of 3.5%. Due to the numerous meals that are cooked there, South Korea is one of the nations with the biggest consumption of rice flakes.

Additionally, cornflakes are becoming more and more well-liked among consumers in the nation. By 2033, the South Korean market for flakes-making machines to be worth US$37.125 Million.

How Will the Growth of the Flakes Making Machines Market Escalate across Europe?

In terms of volume, the European market for flakes-making machines made up more than one-third of the entire sector. The most important driver driving the European market throughout the projection period is the notable expansion of ready-to-eat and low-calorie diet food in the majority of European countries.

In the upcoming years, the regional market for flakes-making machines to be driven by rising income levels in the Eastern European nations and rising regional demand for convenient and healthy packaged foods.
Encapsulation of Competition Landscape in the Market

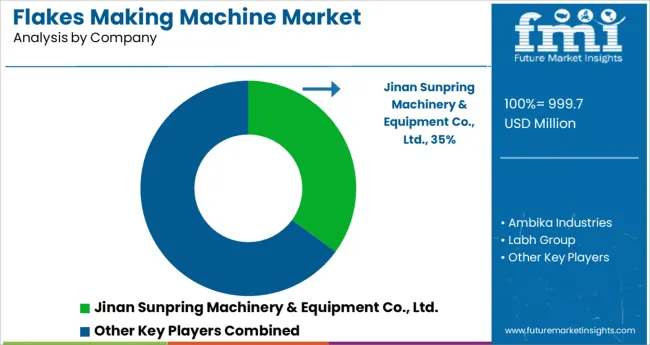
To increase their presence in the fiercely competitive flakes-making machine market, major players plan to introduce new products and expand their production capacity.

Due to the existence of powerful firms with sizable client bases in practically every location, the market is consolidated in nature. Furthermore, there are many domestic competitors operating at the regional level, but the demand for their goods is not great.

Recent Development

License:

  • Ms. Lysterra LLC, Russia, receives a non-exclusive license to use the ICAR-IISR Bio-encapsulation Technology from Agrinnovate India Limited AgIn.

Announcement:

  • The debut of the Granulex® 5 series has been announced by Bühler. The new hammer mill series has numerous minor improvements that combined result in a significant performance improvement after a decade of research. The innovative modular approach it uses provides tremendous flexibility and energy savings while upholding the highest levels of product quality and safety.

Release:

  • A well-known producer of ready-t -eat cereals, Kellogg's India announced the release of a new line of cornflakes in the flavors Kesar Pista Badam, Rose Badam, and Thandai Badam in 2019. Numerous new product launches of this nature are anticipated to increase demand in the Asia Pacific region.
  • In order to sell a wide range of products in India, General Mills and Nestlé S.A. formed a joint venture in May 2018. Breakfast cereals manufactured by Nestlé S.A. include Honey Star, KoKo Krunch, and Corn Flakes.

Key Players

  • Agrinnovate
  • WinTone Grain Machinery
  • Buhler

Key Segments

By Machine Type:

  • Rice Flake Machine
  • Maize Flake Machine
  • Corn Flakes Machine
  • Millets
  • Others

By Operation:

  • Automatic
  • Semi-Automatic

By Sales Channel:

  • Direct Procurement
  • eCommerce Platforms
  • Others

By Region:

  • North America
  • Europe
  • Latin America
  • East Asia
  • South Asia and ASEAN
  • Oceania
  • Middle East and Africa

Frequently Asked Questions

How is the Flakes Making Machine Market Growing?

The Flakes Making Machine Market is predicted to grow at CAGR of 5.1% through 2033.

Which Region Holds the Highest Revenue Potential in the Flakes Making Machine Market?

Asia Pacific Flakes Making Machine Market holds the highest revenue potential.

What is the Current Flakes Making Machine Market Size?

The Flakes Making Machine Market size is anticipated to be over US$ 905 Million in 2023.

What is the Future Scope of Growth for the Flakes Making Machine Market?

The Flakes Making Machine Market is expected to surpass US$ 1485 Million by 2033.

Table of Content

1. Executive Summary | Flakes Making Machine Market

    1.1. Global Market Outlook

    1.2. Demand-side Trends

    1.3. Supply-side Trends

    1.4. Technology Roadmap Analysis

    1.5. Analysis and Recommendations

2. Market Overview

    2.1. Market Coverage / Taxonomy

    2.2. Market Definition / Scope / Limitations

3. Market Background

    3.1. Market Dynamics

        3.1.1. Drivers

        3.1.2. Restraints

        3.1.3. Opportunity

        3.1.4. Trends

    3.2. Scenario Forecast

        3.2.1. Demand in Optimistic Scenario

        3.2.2. Demand in Likely Scenario

        3.2.3. Demand in Conservative Scenario

    3.3. Opportunity Map Analysis

    3.4. Product Life Cycle Analysis

    3.5. Supply Chain Analysis

        3.5.1. Supply Side Participants and their Roles

            3.5.1.1. Producers

            3.5.1.2. Mid-Level Participants (Traders/ Agents/ Brokers)

            3.5.1.3. Wholesalers and Distributors

        3.5.2. Value Added and Value Created at Node in the Supply Chain

        3.5.3. List of Raw Material Suppliers

        3.5.4. List of Existing and Potential Buyers

    3.6. Investment Feasibility Matrix

    3.7. Value Chain Analysis

        3.7.1. Profit Margin Analysis

        3.7.2. Wholesalers and Distributors

        3.7.3. Retailers

    3.8. PESTLE and Porter’s Analysis

    3.9. Regulatory Landscape

        3.9.1. By Key Regions

        3.9.2. By Key Countries

    3.10. Regional Parent Market Outlook

    3.11. Production and Consumption Statistics

    3.12. Import and Export Statistics

4. Global Market Analysis 2018 to 2022 and Forecast, 2023 to 2033

    4.1. Historical Market Size Value (US$ Million) & Volume (Units) Analysis, 2018 to 2022

    4.2. Current and Future Market Size Value (US$ Million) & Volume (Units) Projections, 2023 to 2033

        4.2.1. Y-o-Y Growth Trend Analysis

        4.2.2. Absolute $ Opportunity Analysis

5. Global Market Analysis 2018 to 2022 and Forecast 2023 to 2033, By Machine Type

    5.1. Introduction / Key Findings

    5.2. Historical Market Size Value (US$ Million) & Volume (Units) Analysis By Machine Type, 2018 to 2022

    5.3. Current and Future Market Size Value (US$ Million) & Volume (Units) Analysis and Forecast By Machine Type, 2023 to 2033

        5.3.1. Rice Flake Machine

        5.3.2. Maize Flake Machine

        5.3.3. Corn Flakes Machine

        5.3.4. Millets

        5.3.5. Others

    5.4. Y-o-Y Growth Trend Analysis By Machine Type, 2018 to 2022

    5.5. Absolute $ Opportunity Analysis By Machine Type, 2023 to 2033

6. Global Market Analysis 2018 to 2022 and Forecast 2023 to 2033, By Operation

    6.1. Introduction / Key Findings

    6.2. Historical Market Size Value (US$ Million) & Volume (Units) Analysis By Operation, 2018 to 2022

    6.3. Current and Future Market Size Value (US$ Million) & Volume (Units) Analysis and Forecast By Operation, 2023 to 2033

        6.3.1. Automatic

        6.3.2. Semi-Automatic

    6.4. Y-o-Y Growth Trend Analysis By Operation, 2018 to 2022

    6.5. Absolute $ Opportunity Analysis By Operation, 2023 to 2033

7. Global Market Analysis 2018 to 2022 and Forecast 2023 to 2033, By Sales Channel

    7.1. Introduction / Key Findings

    7.2. Historical Market Size Value (US$ Million) & Volume (Units) Analysis By Sales Channel, 2018 to 2022

    7.3. Current and Future Market Size Value (US$ Million) & Volume (Units) Analysis and Forecast By Sales Channel, 2023 to 2033

        7.3.1. Direct Procurement

        7.3.2. eCommerce Platforms

        7.3.3. Other Channels

    7.4. Y-o-Y Growth Trend Analysis By Sales Channel, 2018 to 2022

    7.5. Absolute $ Opportunity Analysis By Sales Channel, 2023 to 2033

8. Global Market Analysis 2018 to 2022 and Forecast 2023 to 2033, By Region

    8.1. Introduction

    8.2. Historical Market Size Value (US$ Million) & Volume (Units) Analysis By Region, 2018 to 2022

    8.3. Current Market Size Value (US$ Million) & Volume (Units) Analysis and Forecast By Region, 2023 to 2033

        8.3.1. North America

        8.3.2. Latin America

        8.3.3. Europe

        8.3.4. East Asia

        8.3.5. South Asia and ASEAN

        8.3.6. Oceania

        8.3.7. Middle East and Africa (MEA)

    8.4. Market Attractiveness Analysis By Region

9. North America Market Analysis 2018 to 2022 and Forecast 2023 to 2033, By Country

    9.1. Historical Market Size Value (US$ Million) & Volume (Units) Trend Analysis By Market Taxonomy, 2018 to 2022

    9.2. Market Size Value (US$ Million) & Volume (Units) Forecast By Market Taxonomy, 2023 to 2033

        9.2.1. By Country

            9.2.1.1.United States of America

            9.2.1.2. Canada

        9.2.2. By Machine Type

        9.2.3. By Operation

        9.2.4. By Sales Channel

    9.3. Market Attractiveness Analysis

        9.3.1. By Country

        9.3.2. By Machine Type

        9.3.3. By Operation

        9.3.4. By Sales Channel

    9.4. Key Takeaways

10. Latin America Market Analysis 2018 to 2022 and Forecast 2023 to 2033, By Country

    10.1. Historical Market Size Value (US$ Million) & Volume (Units) Trend Analysis By Market Taxonomy, 2018 to 2022

    10.2. Market Size Value (US$ Million) & Volume (Units) Forecast By Market Taxonomy, 2023 to 2033

        10.2.1. By Country

            10.2.1.1. Brazil

            10.2.1.2. Mexico

            10.2.1.3. Rest of Latin America

        10.2.2. By Machine Type

        10.2.3. By Operation

        10.2.4. By Sales Channel

    10.3. Market Attractiveness Analysis

        10.3.1. By Country

        10.3.2. By Machine Type

        10.3.3. By Operation

        10.3.4. By Sales Channel

    10.4. Key Takeaways

11. Europe Market Analysis 2018 to 2022 and Forecast 2023 to 2033, By Country

    11.1. Historical Market Size Value (US$ Million) & Volume (Units) Trend Analysis By Market Taxonomy, 2018 to 2022

    11.2. Market Size Value (US$ Million) & Volume (Units) Forecast By Market Taxonomy, 2023 to 2033

        11.2.1. By Country

            11.2.1.1. Germany

            11.2.1.2. United Kingdom

            11.2.1.3. France

            11.2.1.4. Spain

            11.2.1.5. Italy

            11.2.1.6. Rest of Europe

        11.2.2. By Machine Type

        11.2.3. By Operation

        11.2.4. By Sales Channel

    11.3. Market Attractiveness Analysis

        11.3.1. By Country

        11.3.2. By Machine Type

        11.3.3. By Operation

        11.3.4. By Sales Channel

    11.4. Key Takeaways

12. East Asia Market Analysis 2018 to 2022 and Forecast 2023 to 2033, By Country

    12.1. Historical Market Size Value (US$ Million) & Volume (Units) Trend Analysis By Market Taxonomy, 2018 to 2022

    12.2. Market Size Value (US$ Million) & Volume (Units) Forecast By Market Taxonomy, 2023 to 2033

        12.2.1. By Country

            12.2.1.1. China

            12.2.1.2. Japan

            12.2.1.3. South Korea

        12.2.2. By Machine Type

        12.2.3. By Operation

        12.2.4. By Sales Channel

    12.3. Market Attractiveness Analysis

        12.3.1. By Country

        12.3.2. By Machine Type

        12.3.3. By Operation

        12.3.4. By Sales Channel

    12.4. Key Takeaways

13. South Asia and ASEAN Market Analysis 2018 to 2022 and Forecast 2023 to 2033, By Country

    13.1. Historical Market Size Value (US$ Million) & Volume (Units) Trend Analysis By Market Taxonomy, 2018 to 2022

    13.2. Market Size Value (US$ Million) & Volume (Units) Forecast By Market Taxonomy, 2023 to 2033

        13.2.1. By Country

            13.2.1.1. Singapore

            13.2.1.2. Thailand

            13.2.1.3. India

            13.2.1.4. Indonesia

            13.2.1.5. Rest of South Asia and ASEAN

        13.2.2. By Machine Type

        13.2.3. By Operation

        13.2.4. By Sales Channel

    13.3. Market Attractiveness Analysis

        13.3.1. By Country

        13.3.2. By Machine Type

        13.3.3. By Operation

        13.3.4. By Sales Channel

    13.4. Key Takeaways

14. Oceania Market Analysis 2018 to 2022 and Forecast 2023 to 2033, By Country

    14.1. Historical Market Size Value (US$ Million) & Volume (Units) Trend Analysis By Market Taxonomy, 2018 to 2022

    14.2. Market Size Value (US$ Million) & Volume (Units) Forecast By Market Taxonomy, 2023 to 2033

        14.2.1. By Country

            14.2.1.1. Australia

            14.2.1.2. New Zealand

        14.2.2. By Machine Type

        14.2.3. By Operation

        14.2.4. By Sales Channel

    14.3. Market Attractiveness Analysis

        14.3.1. By Country

        14.3.2. By Machine Type

        14.3.3. By Operation

        14.3.4. By Sales Channel

    14.4. Key Takeaways

15. MEA Market Analysis 2018 to 2022 and Forecast 2023 to 2033, By Country

    15.1. Historical Market Size Value (US$ Million) & Volume (Units) Trend Analysis By Market Taxonomy, 2018 to 2022

    15.2. Market Size Value (US$ Million) & Volume (Units) Forecast By Market Taxonomy, 2023 to 2033

        15.2.1. By Country

            15.2.1.1. GCC Countries

            15.2.1.2. South Africa

            15.2.1.3. Israel

            15.2.1.4. Rest of MEA

        15.2.2. By Machine Type

        15.2.3. By Operation

        15.2.4. By Sales Channel

    15.3. Market Attractiveness Analysis

        15.3.1. By Country

        15.3.2. By Machine Type

        15.3.3. By Operation

        15.3.4. By Sales Channel

    15.4. Key Takeaways

16. Key Countries Market Analysis

    16.1. United States of America

        16.1.1. Pricing Analysis

        16.1.2. Market Share Analysis, 2022

            16.1.2.1. By Machine Type

            16.1.2.2. By Operation

            16.1.2.3. By Sales Channel

    16.2. Canada

        16.2.1. Pricing Analysis

        16.2.2. Market Share Analysis, 2022

            16.2.2.1. By Machine Type

            16.2.2.2. By Operation

            16.2.2.3. By Sales Channel

    16.3. Brazil

        16.3.1. Pricing Analysis

        16.3.2. Market Share Analysis, 2022

            16.3.2.1. By Machine Type

            16.3.2.2. By Operation

            16.3.2.3. By Sales Channel

    16.4. Mexico

        16.4.1. Pricing Analysis

        16.4.2. Market Share Analysis, 2022

            16.4.2.1. By Machine Type

            16.4.2.2. By Operation

            16.4.2.3. By Sales Channel

    16.5. Germany

        16.5.1. Pricing Analysis

        16.5.2. Market Share Analysis, 2022

            16.5.2.1. By Machine Type

            16.5.2.2. By Operation

            16.5.2.3. By Sales Channel

    16.6. United Kingdom

        16.6.1. Pricing Analysis

        16.6.2. Market Share Analysis, 2022

            16.6.2.1. By Machine Type

            16.6.2.2. By Operation

            16.6.2.3. By Sales Channel

    16.7. France

        16.7.1. Pricing Analysis

        16.7.2. Market Share Analysis, 2022

            16.7.2.1. By Machine Type

            16.7.2.2. By Operation

            16.7.2.3. By Sales Channel

    16.8. Spain

        16.8.1. Pricing Analysis

        16.8.2. Market Share Analysis, 2022

            16.8.2.1. By Machine Type

            16.8.2.2. By Operation

            16.8.2.3. By Sales Channel

    16.9. Italy

        16.9.1. Pricing Analysis

        16.9.2. Market Share Analysis, 2022

            16.9.2.1. By Machine Type

            16.9.2.2. By Operation

            16.9.2.3. By Sales Channel

    16.10. China

        16.10.1. Pricing Analysis

        16.10.2. Market Share Analysis, 2022

            16.10.2.1. By Machine Type

            16.10.2.2. By Operation

            16.10.2.3. By Sales Channel

    16.11. Japan

        16.11.1. Pricing Analysis

        16.11.2. Market Share Analysis, 2022

            16.11.2.1. By Machine Type

            16.11.2.2. By Operation

            16.11.2.3. By Sales Channel

    16.12. South Korea

        16.12.1. Pricing Analysis

        16.12.2. Market Share Analysis, 2022

            16.12.2.1. By Machine Type

            16.12.2.2. By Operation

            16.12.2.3. By Sales Channel

    16.13. Singapore

        16.13.1. Pricing Analysis

        16.13.2. Market Share Analysis, 2022

            16.13.2.1. By Machine Type

            16.13.2.2. By Operation

            16.13.2.3. By Sales Channel

    16.14. Thailand

        16.14.1. Pricing Analysis

        16.14.2. Market Share Analysis, 2022

            16.14.2.1. By Machine Type

            16.14.2.2. By Operation

            16.14.2.3. By Sales Channel

    16.15. India

        16.15.1. Pricing Analysis

        16.15.2. Market Share Analysis, 2022

            16.15.2.1. By Machine Type

            16.15.2.2. By Operation

            16.15.2.3. By Sales Channel

    16.16. Indonesia

        16.16.1. Pricing Analysis

        16.16.2. Market Share Analysis, 2022

            16.16.2.1. By Machine Type

            16.16.2.2. By Operation

            16.16.2.3. By Sales Channel

    16.17. Australia

        16.17.1. Pricing Analysis

        16.17.2. Market Share Analysis, 2022

            16.17.2.1. By Machine Type

            16.17.2.2. By Operation

            16.17.2.3. By Sales Channel

    16.18. New Zealand

        16.18.1. Pricing Analysis

        16.18.2. Market Share Analysis, 2022

            16.18.2.1. By Machine Type

            16.18.2.2. By Operation

            16.18.2.3. By Sales Channel

    16.19. GCC Countries

        16.19.1. Pricing Analysis

        16.19.2. Market Share Analysis, 2022

            16.19.2.1. By Machine Type

            16.19.2.2. By Operation

            16.19.2.3. By Sales Channel

    16.20. South Africa

        16.20.1. Pricing Analysis

        16.20.2. Market Share Analysis, 2022

            16.20.2.1. By Machine Type

            16.20.2.2. By Operation

            16.20.2.3. By Sales Channel

    16.21. Israel

        16.21.1. Pricing Analysis

        16.21.2. Market Share Analysis, 2022

            16.21.2.1. By Machine Type

            16.21.2.2. By Operation

            16.21.2.3. By Sales Channel

17. Market Structure Analysis

    17.1. Competition Dashboard

    17.2. Competition Benchmarking

    17.3. Market Share Analysis of Top Players

        17.3.1. By Regional

        17.3.2. By Machine Type

        17.3.3. By Operation

        17.3.4. By Sales Channel

18. Competition Analysis

    18.1. Competition Deep Dive

        18.1.1. Jinan Sunpring Machinery & Equipment Co., Ltd.

            18.1.1.1. Overview

            18.1.1.2. Product Portfolio

            18.1.1.3. Profitability by Market Segments

            18.1.1.4. Sales Footprint

            18.1.1.5. Strategy Overview

                18.1.1.5.1. Marketing Strategy

                18.1.1.5.2. Product Strategy

                18.1.1.5.3. Channel Strategy

        18.1.2. Ambika Industries

            18.1.2.1. Overview

            18.1.2.2. Product Portfolio

            18.1.2.3. Profitability by Market Segments

            18.1.2.4. Sales Footprint

            18.1.2.5. Strategy Overview

                18.1.2.5.1. Marketing Strategy

                18.1.2.5.2. Product Strategy

                18.1.2.5.3. Channel Strategy

        18.1.3. Labh Group

            18.1.3.1. Overview

            18.1.3.2. Product Portfolio

            18.1.3.3. Profitability by Market Segments

            18.1.3.4. Sales Footprint

            18.1.3.5. Strategy Overview

                18.1.3.5.1. Marketing Strategy

                18.1.3.5.2. Product Strategy

                18.1.3.5.3. Channel Strategy

        18.1.4. Shankar Engineering Corporation

            18.1.4.1. Overview

            18.1.4.2. Product Portfolio

            18.1.4.3. Profitability by Market Segments

            18.1.4.4. Sales Footprint

            18.1.4.5. Strategy Overview

                18.1.4.5.1. Marketing Strategy

                18.1.4.5.2. Product Strategy

                18.1.4.5.3. Channel Strategy

        18.1.5. Sifter International

            18.1.5.1. Overview

            18.1.5.2. Product Portfolio

            18.1.5.3. Profitability by Market Segments

            18.1.5.4. Sales Footprint

            18.1.5.5. Strategy Overview

                18.1.5.5.1. Marketing Strategy

                18.1.5.5.2. Product Strategy

                18.1.5.5.3. Channel Strategy

        18.1.6. Baker Perkins Limited

            18.1.6.1. Overview

            18.1.6.2. Product Portfolio

            18.1.6.3. Profitability by Market Segments

            18.1.6.4. Sales Footprint

            18.1.6.5. Strategy Overview

                18.1.6.5.1. Marketing Strategy

                18.1.6.5.2. Product Strategy

                18.1.6.5.3. Channel Strategy

        18.1.7. JINAN KELID MACHINERY CO, LTD

            18.1.7.1. Overview

            18.1.7.2. Product Portfolio

            18.1.7.3. Profitability by Market Segments

            18.1.7.4. Sales Footprint

            18.1.7.5. Strategy Overview

                18.1.7.5.1. Marketing Strategy

                18.1.7.5.2. Product Strategy

                18.1.7.5.3. Channel Strategy

        18.1.8. Vulcanotec

            18.1.8.1. Overview

            18.1.8.2. Product Portfolio

            18.1.8.3. Profitability by Market Segments

            18.1.8.4. Sales Footprint

            18.1.8.5. Strategy Overview

                18.1.8.5.1. Marketing Strategy

                18.1.8.5.2. Product Strategy

                18.1.8.5.3. Channel Strategy

        18.1.9. Shandong Loyal Industrial Co., Ltd

            18.1.9.1. Overview

            18.1.9.2. Product Portfolio

            18.1.9.3. Profitability by Market Segments

            18.1.9.4. Sales Footprint

            18.1.9.5. Strategy Overview

                18.1.9.5.1. Marketing Strategy

                18.1.9.5.2. Product Strategy

                18.1.9.5.3. Channel Strategy

        18.1.10. Jinan MT Machinery & Equipment Co.,Ltd

            18.1.10.1. Overview

            18.1.10.2. Product Portfolio

            18.1.10.3. Profitability by Market Segments

            18.1.10.4. Sales Footprint

            18.1.10.5. Strategy Overview

                18.1.10.5.1. Marketing Strategy

                18.1.10.5.2. Product Strategy

                18.1.10.5.3. Channel Strategy

19. Assumptions & Acronyms Used

20. Research Methodology

List of Tables

Table 1: Global Market Value (US$ Million) Forecast by Region, 2018 to 2033

Table 2: Global Market Volume (Units) Forecast by Region, 2018 to 2033

Table 3: Global Market Value (US$ Million) Forecast by Machine Type, 2018 to 2033

Table 4: Global Market Volume (Units) Forecast by Machine Type, 2018 to 2033

Table 5: Global Market Value (US$ Million) Forecast by Operation, 2018 to 2033

Table 6: Global Market Volume (Units) Forecast by Operation, 2018 to 2033

Table 7: Global Market Value (US$ Million) Forecast by Sales Channel, 2018 to 2033

Table 8: Global Market Volume (Units) Forecast by Sales Channel, 2018 to 2033

Table 9: North America Market Value (US$ Million) Forecast by Country, 2018 to 2033

Table 10: North America Market Volume (Units) Forecast by Country, 2018 to 2033

Table 11: North America Market Value (US$ Million) Forecast by Machine Type, 2018 to 2033

Table 12: North America Market Volume (Units) Forecast by Machine Type, 2018 to 2033

Table 13: North America Market Value (US$ Million) Forecast by Operation, 2018 to 2033

Table 14: North America Market Volume (Units) Forecast by Operation, 2018 to 2033

Table 15: North America Market Value (US$ Million) Forecast by Sales Channel, 2018 to 2033

Table 16: North America Market Volume (Units) Forecast by Sales Channel, 2018 to 2033

Table 17: Latin America Market Value (US$ Million) Forecast by Country, 2018 to 2033

Table 18: Latin America Market Volume (Units) Forecast by Country, 2018 to 2033

Table 19: Latin America Market Value (US$ Million) Forecast by Machine Type, 2018 to 2033

Table 20: Latin America Market Volume (Units) Forecast by Machine Type, 2018 to 2033

Table 21: Latin America Market Value (US$ Million) Forecast by Operation, 2018 to 2033

Table 22: Latin America Market Volume (Units) Forecast by Operation, 2018 to 2033

Table 23: Latin America Market Value (US$ Million) Forecast by Sales Channel, 2018 to 2033

Table 24: Latin America Market Volume (Units) Forecast by Sales Channel, 2018 to 2033

Table 25: Europe Market Value (US$ Million) Forecast by Country, 2018 to 2033

Table 26: Europe Market Volume (Units) Forecast by Country, 2018 to 2033

Table 27: Europe Market Value (US$ Million) Forecast by Machine Type, 2018 to 2033

Table 28: Europe Market Volume (Units) Forecast by Machine Type, 2018 to 2033

Table 29: Europe Market Value (US$ Million) Forecast by Operation, 2018 to 2033

Table 30: Europe Market Volume (Units) Forecast by Operation, 2018 to 2033

Table 31: Europe Market Value (US$ Million) Forecast by Sales Channel, 2018 to 2033

Table 32: Europe Market Volume (Units) Forecast by Sales Channel, 2018 to 2033

Table 33: East Asia Market Value (US$ Million) Forecast by Country, 2018 to 2033

Table 34: East Asia Market Volume (Units) Forecast by Country, 2018 to 2033

Table 35: East Asia Market Value (US$ Million) Forecast by Machine Type, 2018 to 2033

Table 36: East Asia Market Volume (Units) Forecast by Machine Type, 2018 to 2033

Table 37: East Asia Market Value (US$ Million) Forecast by Operation, 2018 to 2033

Table 38: East Asia Market Volume (Units) Forecast by Operation, 2018 to 2033

Table 39: East Asia Market Value (US$ Million) Forecast by Sales Channel, 2018 to 2033

Table 40: East Asia Market Volume (Units) Forecast by Sales Channel, 2018 to 2033

Table 41: South Asia and ASEAN Market Value (US$ Million) Forecast by Country, 2018 to 2033

Table 42: South Asia and ASEAN Market Volume (Units) Forecast by Country, 2018 to 2033

Table 43: South Asia and ASEAN Market Value (US$ Million) Forecast by Machine Type, 2018 to 2033

Table 44: South Asia and ASEAN Market Volume (Units) Forecast by Machine Type, 2018 to 2033

Table 45: South Asia and ASEAN Market Value (US$ Million) Forecast by Operation, 2018 to 2033

Table 46: South Asia and ASEAN Market Volume (Units) Forecast by Operation, 2018 to 2033

Table 47: South Asia and ASEAN Market Value (US$ Million) Forecast by Sales Channel, 2018 to 2033

Table 48: South Asia and ASEAN Market Volume (Units) Forecast by Sales Channel, 2018 to 2033

Table 49: Oceania Market Value (US$ Million) Forecast by Country, 2018 to 2033

Table 50: Oceania Market Volume (Units) Forecast by Country, 2018 to 2033

Table 51: Oceania Market Value (US$ Million) Forecast by Machine Type, 2018 to 2033

Table 52: Oceania Market Volume (Units) Forecast by Machine Type, 2018 to 2033

Table 53: Oceania Market Value (US$ Million) Forecast by Operation, 2018 to 2033

Table 54: Oceania Market Volume (Units) Forecast by Operation, 2018 to 2033

Table 55: Oceania Market Value (US$ Million) Forecast by Sales Channel, 2018 to 2033

Table 56: Oceania Market Volume (Units) Forecast by Sales Channel, 2018 to 2033

Table 57: MEA Market Value (US$ Million) Forecast by Country, 2018 to 2033

Table 58: MEA Market Volume (Units) Forecast by Country, 2018 to 2033

Table 59: MEA Market Value (US$ Million) Forecast by Machine Type, 2018 to 2033

Table 60: MEA Market Volume (Units) Forecast by Machine Type, 2018 to 2033

Table 61: MEA Market Value (US$ Million) Forecast by Operation, 2018 to 2033

Table 62: MEA Market Volume (Units) Forecast by Operation, 2018 to 2033

Table 63: MEA Market Value (US$ Million) Forecast by Sales Channel, 2018 to 2033

Table 64: MEA Market Volume (Units) Forecast by Sales Channel, 2018 to 2033

List of Charts

Figure 1: Global Market Value (US$ Million) by Machine Type, 2023 to 2033

Figure 2: Global Market Value (US$ Million) by Operation, 2023 to 2033

Figure 3: Global Market Value (US$ Million) by Sales Channel, 2023 to 2033

Figure 4: Global Market Value (US$ Million) by Region, 2023 to 2033

Figure 5: Global Market Value (US$ Million) Analysis by Region, 2018 to 2033

Figure 6: Global Market Volume (Units) Analysis by Region, 2018 to 2033

Figure 7: Global Market Value Share (%) and BPS Analysis by Region, 2023 to 2033

Figure 8: Global Market Y-o-Y Growth (%) Projections by Region, 2023 to 2033

Figure 9: Global Market Value (US$ Million) Analysis by Machine Type, 2018 to 2033

Figure 10: Global Market Volume (Units) Analysis by Machine Type, 2018 to 2033

Figure 11: Global Market Value Share (%) and BPS Analysis by Machine Type, 2023 to 2033

Figure 12: Global Market Y-o-Y Growth (%) Projections by Machine Type, 2023 to 2033

Figure 13: Global Market Value (US$ Million) Analysis by Operation, 2018 to 2033

Figure 14: Global Market Volume (Units) Analysis by Operation, 2018 to 2033

Figure 15: Global Market Value Share (%) and BPS Analysis by Operation, 2023 to 2033

Figure 16: Global Market Y-o-Y Growth (%) Projections by Operation, 2023 to 2033

Figure 17: Global Market Value (US$ Million) Analysis by Sales Channel, 2018 to 2033

Figure 18: Global Market Volume (Units) Analysis by Sales Channel, 2018 to 2033

Figure 19: Global Market Value Share (%) and BPS Analysis by Sales Channel, 2023 to 2033

Figure 20: Global Market Y-o-Y Growth (%) Projections by Sales Channel, 2023 to 2033

Figure 21: Global Market Attractiveness by Machine Type, 2023 to 2033

Figure 22: Global Market Attractiveness by Operation, 2023 to 2033

Figure 23: Global Market Attractiveness by Sales Channel, 2023 to 2033

Figure 24: Global Market Attractiveness by Region, 2023 to 2033

Figure 25: North America Market Value (US$ Million) by Machine Type, 2023 to 2033

Figure 26: North America Market Value (US$ Million) by Operation, 2023 to 2033

Figure 27: North America Market Value (US$ Million) by Sales Channel, 2023 to 2033

Figure 28: North America Market Value (US$ Million) by Country, 2023 to 2033

Figure 29: North America Market Value (US$ Million) Analysis by Country, 2018 to 2033

Figure 30: North America Market Volume (Units) Analysis by Country, 2018 to 2033

Figure 31: North America Market Value Share (%) and BPS Analysis by Country, 2023 to 2033

Figure 32: North America Market Y-o-Y Growth (%) Projections by Country, 2023 to 2033

Figure 33: North America Market Value (US$ Million) Analysis by Machine Type, 2018 to 2033

Figure 34: North America Market Volume (Units) Analysis by Machine Type, 2018 to 2033

Figure 35: North America Market Value Share (%) and BPS Analysis by Machine Type, 2023 to 2033

Figure 36: North America Market Y-o-Y Growth (%) Projections by Machine Type, 2023 to 2033

Figure 37: North America Market Value (US$ Million) Analysis by Operation, 2018 to 2033

Figure 38: North America Market Volume (Units) Analysis by Operation, 2018 to 2033

Figure 39: North America Market Value Share (%) and BPS Analysis by Operation, 2023 to 2033

Figure 40: North America Market Y-o-Y Growth (%) Projections by Operation, 2023 to 2033

Figure 41: North America Market Value (US$ Million) Analysis by Sales Channel, 2018 to 2033

Figure 42: North America Market Volume (Units) Analysis by Sales Channel, 2018 to 2033

Figure 43: North America Market Value Share (%) and BPS Analysis by Sales Channel, 2023 to 2033

Figure 44: North America Market Y-o-Y Growth (%) Projections by Sales Channel, 2023 to 2033

Figure 45: North America Market Attractiveness by Machine Type, 2023 to 2033

Figure 46: North America Market Attractiveness by Operation, 2023 to 2033

Figure 47: North America Market Attractiveness by Sales Channel, 2023 to 2033

Figure 48: North America Market Attractiveness by Country, 2023 to 2033

Figure 49: Latin America Market Value (US$ Million) by Machine Type, 2023 to 2033

Figure 50: Latin America Market Value (US$ Million) by Operation, 2023 to 2033

Figure 51: Latin America Market Value (US$ Million) by Sales Channel, 2023 to 2033

Figure 52: Latin America Market Value (US$ Million) by Country, 2023 to 2033

Figure 53: Latin America Market Value (US$ Million) Analysis by Country, 2018 to 2033

Figure 54: Latin America Market Volume (Units) Analysis by Country, 2018 to 2033

Figure 55: Latin America Market Value Share (%) and BPS Analysis by Country, 2023 to 2033

Figure 56: Latin America Market Y-o-Y Growth (%) Projections by Country, 2023 to 2033

Figure 57: Latin America Market Value (US$ Million) Analysis by Machine Type, 2018 to 2033

Figure 58: Latin America Market Volume (Units) Analysis by Machine Type, 2018 to 2033

Figure 59: Latin America Market Value Share (%) and BPS Analysis by Machine Type, 2023 to 2033

Figure 60: Latin America Market Y-o-Y Growth (%) Projections by Machine Type, 2023 to 2033

Figure 61: Latin America Market Value (US$ Million) Analysis by Operation, 2018 to 2033

Figure 62: Latin America Market Volume (Units) Analysis by Operation, 2018 to 2033

Figure 63: Latin America Market Value Share (%) and BPS Analysis by Operation, 2023 to 2033

Figure 64: Latin America Market Y-o-Y Growth (%) Projections by Operation, 2023 to 2033

Figure 65: Latin America Market Value (US$ Million) Analysis by Sales Channel, 2018 to 2033

Figure 66: Latin America Market Volume (Units) Analysis by Sales Channel, 2018 to 2033

Figure 67: Latin America Market Value Share (%) and BPS Analysis by Sales Channel, 2023 to 2033

Figure 68: Latin America Market Y-o-Y Growth (%) Projections by Sales Channel, 2023 to 2033

Figure 69: Latin America Market Attractiveness by Machine Type, 2023 to 2033

Figure 70: Latin America Market Attractiveness by Operation, 2023 to 2033

Figure 71: Latin America Market Attractiveness by Sales Channel, 2023 to 2033

Figure 72: Latin America Market Attractiveness by Country, 2023 to 2033

Figure 73: Europe Market Value (US$ Million) by Machine Type, 2023 to 2033

Figure 74: Europe Market Value (US$ Million) by Operation, 2023 to 2033

Figure 75: Europe Market Value (US$ Million) by Sales Channel, 2023 to 2033

Figure 76: Europe Market Value (US$ Million) by Country, 2023 to 2033

Figure 77: Europe Market Value (US$ Million) Analysis by Country, 2018 to 2033

Figure 78: Europe Market Volume (Units) Analysis by Country, 2018 to 2033

Figure 79: Europe Market Value Share (%) and BPS Analysis by Country, 2023 to 2033

Figure 80: Europe Market Y-o-Y Growth (%) Projections by Country, 2023 to 2033

Figure 81: Europe Market Value (US$ Million) Analysis by Machine Type, 2018 to 2033

Figure 82: Europe Market Volume (Units) Analysis by Machine Type, 2018 to 2033

Figure 83: Europe Market Value Share (%) and BPS Analysis by Machine Type, 2023 to 2033

Figure 84: Europe Market Y-o-Y Growth (%) Projections by Machine Type, 2023 to 2033

Figure 85: Europe Market Value (US$ Million) Analysis by Operation, 2018 to 2033

Figure 86: Europe Market Volume (Units) Analysis by Operation, 2018 to 2033

Figure 87: Europe Market Value Share (%) and BPS Analysis by Operation, 2023 to 2033

Figure 88: Europe Market Y-o-Y Growth (%) Projections by Operation, 2023 to 2033

Figure 89: Europe Market Value (US$ Million) Analysis by Sales Channel, 2018 to 2033

Figure 90: Europe Market Volume (Units) Analysis by Sales Channel, 2018 to 2033

Figure 91: Europe Market Value Share (%) and BPS Analysis by Sales Channel, 2023 to 2033

Figure 92: Europe Market Y-o-Y Growth (%) Projections by Sales Channel, 2023 to 2033

Figure 93: Europe Market Attractiveness by Machine Type, 2023 to 2033

Figure 94: Europe Market Attractiveness by Operation, 2023 to 2033

Figure 95: Europe Market Attractiveness by Sales Channel, 2023 to 2033

Figure 96: Europe Market Attractiveness by Country, 2023 to 2033

Figure 97: East Asia Market Value (US$ Million) by Machine Type, 2023 to 2033

Figure 98: East Asia Market Value (US$ Million) by Operation, 2023 to 2033

Figure 99: East Asia Market Value (US$ Million) by Sales Channel, 2023 to 2033

Figure 100: East Asia Market Value (US$ Million) by Country, 2023 to 2033

Figure 101: East Asia Market Value (US$ Million) Analysis by Country, 2018 to 2033

Figure 102: East Asia Market Volume (Units) Analysis by Country, 2018 to 2033

Figure 103: East Asia Market Value Share (%) and BPS Analysis by Country, 2023 to 2033

Figure 104: East Asia Market Y-o-Y Growth (%) Projections by Country, 2023 to 2033

Figure 105: East Asia Market Value (US$ Million) Analysis by Machine Type, 2018 to 2033

Figure 106: East Asia Market Volume (Units) Analysis by Machine Type, 2018 to 2033

Figure 107: East Asia Market Value Share (%) and BPS Analysis by Machine Type, 2023 to 2033

Figure 108: East Asia Market Y-o-Y Growth (%) Projections by Machine Type, 2023 to 2033

Figure 109: East Asia Market Value (US$ Million) Analysis by Operation, 2018 to 2033

Figure 110: East Asia Market Volume (Units) Analysis by Operation, 2018 to 2033

Figure 111: East Asia Market Value Share (%) and BPS Analysis by Operation, 2023 to 2033

Figure 112: East Asia Market Y-o-Y Growth (%) Projections by Operation, 2023 to 2033

Figure 113: East Asia Market Value (US$ Million) Analysis by Sales Channel, 2018 to 2033

Figure 114: East Asia Market Volume (Units) Analysis by Sales Channel, 2018 to 2033

Figure 115: East Asia Market Value Share (%) and BPS Analysis by Sales Channel, 2023 to 2033

Figure 116: East Asia Market Y-o-Y Growth (%) Projections by Sales Channel, 2023 to 2033

Figure 117: East Asia Market Attractiveness by Machine Type, 2023 to 2033

Figure 118: East Asia Market Attractiveness by Operation, 2023 to 2033

Figure 119: East Asia Market Attractiveness by Sales Channel, 2023 to 2033

Figure 120: East Asia Market Attractiveness by Country, 2023 to 2033

Figure 121: South Asia and ASEAN Market Value (US$ Million) by Machine Type, 2023 to 2033

Figure 122: South Asia and ASEAN Market Value (US$ Million) by Operation, 2023 to 2033

Figure 123: South Asia and ASEAN Market Value (US$ Million) by Sales Channel, 2023 to 2033

Figure 124: South Asia and ASEAN Market Value (US$ Million) by Country, 2023 to 2033

Figure 125: South Asia and ASEAN Market Value (US$ Million) Analysis by Country, 2018 to 2033

Figure 126: South Asia and ASEAN Market Volume (Units) Analysis by Country, 2018 to 2033

Figure 127: South Asia and ASEAN Market Value Share (%) and BPS Analysis by Country, 2023 to 2033

Figure 128: South Asia and ASEAN Market Y-o-Y Growth (%) Projections by Country, 2023 to 2033

Figure 129: South Asia and ASEAN Market Value (US$ Million) Analysis by Machine Type, 2018 to 2033

Figure 130: South Asia and ASEAN Market Volume (Units) Analysis by Machine Type, 2018 to 2033

Figure 131: South Asia and ASEAN Market Value Share (%) and BPS Analysis by Machine Type, 2023 to 2033

Figure 132: South Asia and ASEAN Market Y-o-Y Growth (%) Projections by Machine Type, 2023 to 2033

Figure 133: South Asia and ASEAN Market Value (US$ Million) Analysis by Operation, 2018 to 2033

Figure 134: South Asia and ASEAN Market Volume (Units) Analysis by Operation, 2018 to 2033

Figure 135: South Asia and ASEAN Market Value Share (%) and BPS Analysis by Operation, 2023 to 2033

Figure 136: South Asia and ASEAN Market Y-o-Y Growth (%) Projections by Operation, 2023 to 2033

Figure 137: South Asia and ASEAN Market Value (US$ Million) Analysis by Sales Channel, 2018 to 2033

Figure 138: South Asia and ASEAN Market Volume (Units) Analysis by Sales Channel, 2018 to 2033

Figure 139: South Asia and ASEAN Market Value Share (%) and BPS Analysis by Sales Channel, 2023 to 2033

Figure 140: South Asia and ASEAN Market Y-o-Y Growth (%) Projections by Sales Channel, 2023 to 2033

Figure 141: South Asia and ASEAN Market Attractiveness by Machine Type, 2023 to 2033

Figure 142: South Asia and ASEAN Market Attractiveness by Operation, 2023 to 2033

Figure 143: South Asia and ASEAN Market Attractiveness by Sales Channel, 2023 to 2033

Figure 144: South Asia and ASEAN Market Attractiveness by Country, 2023 to 2033

Figure 145: Oceania Market Value (US$ Million) by Machine Type, 2023 to 2033

Figure 146: Oceania Market Value (US$ Million) by Operation, 2023 to 2033

Figure 147: Oceania Market Value (US$ Million) by Sales Channel, 2023 to 2033

Figure 148: Oceania Market Value (US$ Million) by Country, 2023 to 2033

Figure 149: Oceania Market Value (US$ Million) Analysis by Country, 2018 to 2033

Figure 150: Oceania Market Volume (Units) Analysis by Country, 2018 to 2033

Figure 151: Oceania Market Value Share (%) and BPS Analysis by Country, 2023 to 2033

Figure 152: Oceania Market Y-o-Y Growth (%) Projections by Country, 2023 to 2033

Figure 153: Oceania Market Value (US$ Million) Analysis by Machine Type, 2018 to 2033

Figure 154: Oceania Market Volume (Units) Analysis by Machine Type, 2018 to 2033

Figure 155: Oceania Market Value Share (%) and BPS Analysis by Machine Type, 2023 to 2033

Figure 156: Oceania Market Y-o-Y Growth (%) Projections by Machine Type, 2023 to 2033

Figure 157: Oceania Market Value (US$ Million) Analysis by Operation, 2018 to 2033

Figure 158: Oceania Market Volume (Units) Analysis by Operation, 2018 to 2033

Figure 159: Oceania Market Value Share (%) and BPS Analysis by Operation, 2023 to 2033

Figure 160: Oceania Market Y-o-Y Growth (%) Projections by Operation, 2023 to 2033

Figure 161: Oceania Market Value (US$ Million) Analysis by Sales Channel, 2018 to 2033

Figure 162: Oceania Market Volume (Units) Analysis by Sales Channel, 2018 to 2033

Figure 163: Oceania Market Value Share (%) and BPS Analysis by Sales Channel, 2023 to 2033

Figure 164: Oceania Market Y-o-Y Growth (%) Projections by Sales Channel, 2023 to 2033

Figure 165: Oceania Market Attractiveness by Machine Type, 2023 to 2033

Figure 166: Oceania Market Attractiveness by Operation, 2023 to 2033

Figure 167: Oceania Market Attractiveness by Sales Channel, 2023 to 2033

Figure 168: Oceania Market Attractiveness by Country, 2023 to 2033

Figure 169: MEA Market Value (US$ Million) by Machine Type, 2023 to 2033

Figure 170: MEA Market Value (US$ Million) by Operation, 2023 to 2033

Figure 171: MEA Market Value (US$ Million) by Sales Channel, 2023 to 2033

Figure 172: MEA Market Value (US$ Million) by Country, 2023 to 2033

Figure 173: MEA Market Value (US$ Million) Analysis by Country, 2018 to 2033

Figure 174: MEA Market Volume (Units) Analysis by Country, 2018 to 2033

Figure 175: MEA Market Value Share (%) and BPS Analysis by Country, 2023 to 2033

Figure 176: MEA Market Y-o-Y Growth (%) Projections by Country, 2023 to 2033

Figure 177: MEA Market Value (US$ Million) Analysis by Machine Type, 2018 to 2033

Figure 178: MEA Market Volume (Units) Analysis by Machine Type, 2018 to 2033

Figure 179: MEA Market Value Share (%) and BPS Analysis by Machine Type, 2023 to 2033

Figure 180: MEA Market Y-o-Y Growth (%) Projections by Machine Type, 2023 to 2033

Figure 181: MEA Market Value (US$ Million) Analysis by Operation, 2018 to 2033

Figure 182: MEA Market Volume (Units) Analysis by Operation, 2018 to 2033

Figure 183: MEA Market Value Share (%) and BPS Analysis by Operation, 2023 to 2033

Figure 184: MEA Market Y-o-Y Growth (%) Projections by Operation, 2023 to 2033

Figure 185: MEA Market Value (US$ Million) Analysis by Sales Channel, 2018 to 2033

Figure 186: MEA Market Volume (Units) Analysis by Sales Channel, 2018 to 2033

Figure 187: MEA Market Value Share (%) and BPS Analysis by Sales Channel, 2023 to 2033

Figure 188: MEA Market Y-o-Y Growth (%) Projections by Sales Channel, 2023 to 2033

Figure 189: MEA Market Attractiveness by Machine Type, 2023 to 2033

Figure 190: MEA Market Attractiveness by Operation, 2023 to 2033

Figure 191: MEA Market Attractiveness by Sales Channel, 2023 to 2033

Figure 192: MEA Market Attractiveness by Country, 2023 to 2033

Explore Process Automation Insights

View Reports

Flakes Making Machine Market