The potato flakes market, valued at USD 3.4 billion in 2025, is projected to reach USD 6.03 billion by 2035, exhibiting a CAGR of 5.9%.
The United States emerges as the most lucrative market during this period, driven by high consumption of convenient processed foods and robust foodservice infrastructure. Meanwhile, the Asia-Pacific region, particularly China, is anticipated to experience the fastest growth rate due to increasing urbanization, a rising middle-class population, and expanding food processing sectors.
Growth in the potato flakes market is primarily driven by evolving consumer lifestyles, heightened demand for convenience foods, and increased usage in snack production and institutional meal preparations. Potato flakes provide a versatile and efficient ingredient solution, reducing preparation time while maintaining product consistency and texture, particularly valued in the foodservice industry.
However, fluctuations in raw potato prices and concerns regarding the nutritional aspects of processed foods pose significant restraints to market growth. Concurrently, the rising demand for organic potato flakes reflects an escalating consumer preference for clean-label and minimally processed food products.
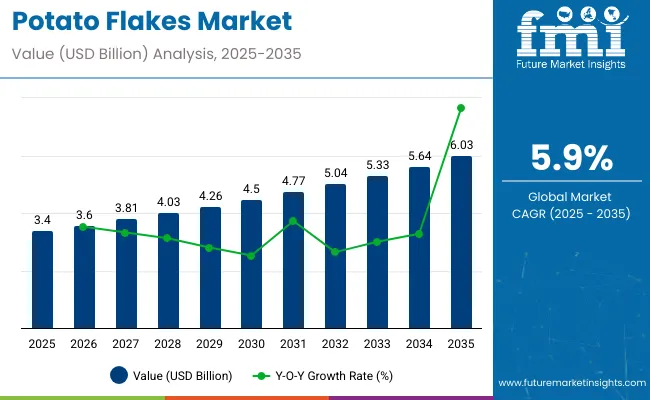
In terms of key trends, product innovation, particularly the development of fortified and flavored potato flakes, is gaining momentum. Industry players are increasingly investing in technological advancements to enhance processing efficiency, improve product quality, and expand shelf life.
Sustainability initiatives focusing on reducing waste, optimizing water usage, and minimizing environmental impacts are also prominent. Companies are actively exploring novel packaging solutions that ensure freshness and convenience, meeting consumer demands for portability and ease of use.
Looking forward, the period between 2025 and 2035 is expected to witness significant advancements in product diversification and geographic penetration. Demand from emerging markets is projected to accelerate, driven by rapid urbanization and adoption of Western dietary patterns, which increasingly emphasize convenience.
Technological integration in processing plants is anticipated to enhance production efficiencies and support innovation in product formats, aligning closely with evolving consumer preferences for healthier, sustainable, and easily accessible food options.
Per capita consumption of potato flakes varies significantly across regions due to differences in dietary habits, industrial use, and availability. Potato flakes are valued for their convenience, long shelf life, and use in processed foods, snacks, and instant meals. While consumption remains moderate compared to fresh potatoes, growing demand in processed food industries and changing lifestyles are driving steady growth globally.
The global trade of potato flakes is influenced by increasing demand from food processing, snack manufacturing, and convenience food sectors. The product’s long shelf life, ease of transportation, and versatile applications in various food products drive its international trade growth.
The table below showcases the semi-annual growth rate trends for the potato flakes market in the base year (2024) and the current year (2025). H1 represents January to June, while H2 spans July to December.
| Particular | Value CAGR |
|---|---|
| H1 (2024 to 2034) | 5.7% |
| H2 (2024 to 2034) | 5.9% |
| H1 (2025 to 2035) | 5.9% |
| H2 (2025 to 2035) | 6.1% |
During the decade from 2025 to 2035, the potato flakes market is projected to experience consistent growth. In H1 2025 to 2035, a steady CAGR of 5.9% is driven by rising demand from the foodservice and snack industries.
The second half (H2) is expected to show a slightly higher CAGR of 6.1%, attributed to seasonal trends and an increasing focus on specialty and organic products. A similar trend is observed in the previous decade, highlighting the market’s resilience and steady expansion.
Standard flakes will dominate the product type segment with a 45% share in 2025, while snack foods will lead the end-use segment with a 38% share, driven by increasing demand for convenient snack options.
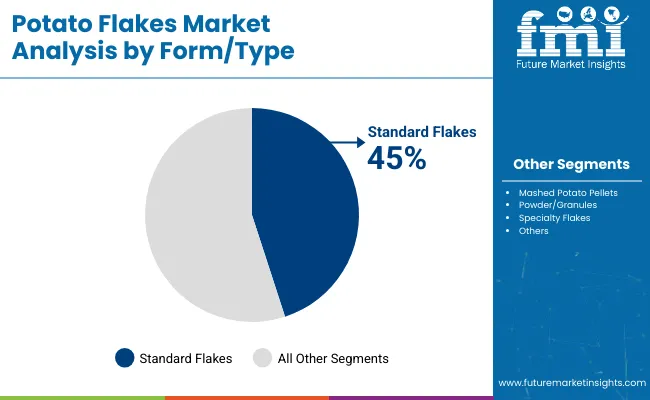
Standard flakes are expected to capture a 45% share of the potato flakes market by 2025. These flakes are widely used due to their versatility, ease of preparation, and long shelf life, making them a staple in the food processing industry.
Standard potato flakes are used in a variety of products, including mashed potatoes, soups, and ready-to-eat meals, providing consumers with convenient and cost-effective options. Major players like McCain Foods, Lamb Weston, and Aviko lead the market by offering high-quality standard potato flakes that meet the growing consumer demand for convenient and nutritious food solutions.
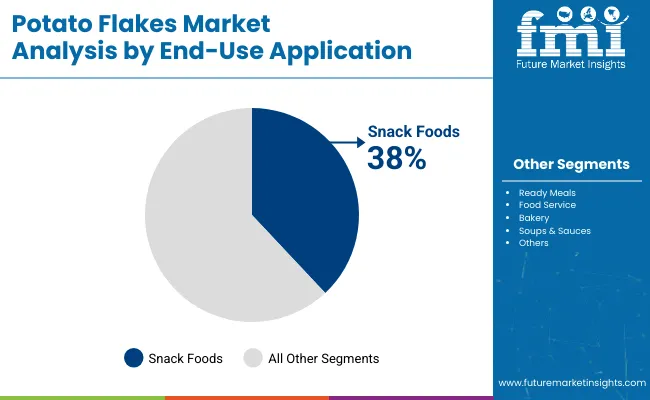
Snack foods are expected to capture 38% of the potato flakes market share by 2025. The increasing demand for convenient, on-the-go snack options, such as potato chips and crisps, is fueling this growth. Potato flakes are an essential ingredient in the production of these snacks, providing a crispy texture and natural flavor.
As consumer preferences shift toward healthier and more sustainable snack options, the use of potato flakes in snack foods continues to grow. Leading snack brands like PepsiCo (Lay's), Kellogg’s, and Intersnack are driving this segment by incorporating potato flakes into a variety of products, from chips to snack bars.
The global transition to convenience foods has profoundly raised the consumption of potato flakes, which are highly regarded for their adaptability and simple preparation. These products can be quickly prepared and be used in various areas such as, but not limited to, ready-to-eat meals, soups, sauces, and snacks which are the perfect match with a modern lifestyle.
Because of the fact that people are a lot more into ready-to-eat products, most of the families and restaurants use potato flakes as an essential component. Furthermore, the market has been disrupted by the introduction of products that are beneficial to health, for example, low sodium and fortified kinds that appeal to health-oriented shoppers.
Moreover, the demand for potato flakes is also buoyed by the growing trend of premium processed foods, especially in urban areas. Transparency in product labeling through natural ingredients without artificial additives is the basis for companies that seek to be considered by health-conscious customers.
The adaptability of potato flakes gives the possibility to be included in different recipes that fulfill different dietary options such as vegan and vegetarian diets. As the standard of living moves toward convenience and health choices, the potato flakes market is set for further upscale turning into a positive trend.
The organic and specialty sector of the potato flakes market has been in a state of rapid expansion, which brings us to the discussions around the customer- and environment-oriented epistemology, that is quite prevalent now.
This product is made without the use of any additives and is thus popular with clean-label and eco-conscious consumers who are in favor of natural ingredients. When more and more individuals choose to eat more healthily, the organic potato flakes grow in popularity proving the trend towards organic foods.
Specialty potato flakes, like the ones used for mashed potato pellets and granules, are gaining ground in the luxury and upscale food segments. Manufacturers are working on getting the necessary certifications and starting sustainable farming practices in response to these changing consumer preferences.
The commitment to quality and sustainability boosts brand equity and builds customers' trust. Meanwhile, as the segment of organic and specialty significantly expands, it is good to know that potato flakes can be a versatile ingredient in this context being the choice of people who are health-conscious and also fitting with modern diets.
Renewable types of potato processing and packaging are the main factors in potato flakes' success. Newer and better approaches to drying, such as drum drying and vacuum drying, which are more effective at ensuring flavor retention, quality, and shelf life for consumers' superior products potato flakes. These methods enable moisture to be extracted efficiently without the loss of the potatoes' natural flavor and nutritional value.
Alongside the aforementioned drying solutions, packaging innovations like resalable and biodegradable options are in keeping with the environmental sustainability campaign, thus winning the favor of eco-friendly conscious buyers.
These advancements guarantee not just the integrity of the product but also satisfy the increased demand for eco-friendly packaging. As manufacturers focus on improving processing sustainability through investments in new technologies, the potato flakes market is in the right place to accommodate revolutionary consumer trends and improve the global demand for healthy, easy-to-cook foods of good quality.
The potato flakes market can be divided into three tiers, each one based on the revenue and market presence of companies. The top-tier companies are the ones that hold the highest market share which includes; Nestlé S.A., McCain Foods Limited, and Idahoan Foods LLC, which are the main players on the market as they have a wide global reach and an excellent production process. These firms typically invest a lot in research and development to create new potato products, for example, specialty flakes of potato and fortified options.
Distribution across different channels and a focus on sustainability help them to serve diverse segments including retail, foodservice, and industrial applications.Besides that Tier 1 companies are also engaged in the pursuit of strategic partnerships and acquisitions to strengthen their global presence and product lines.
Bob's Red Mill Natural Foods Inc., Agrarfrost GmbH & Co. KG, and Lamb Weston Holdings Inc. are thermal companies that are in the mid-range section. They concentrate on narrow markets and personalized solutions like organic or gluten-free potato flakes.
By emphasizing their orientation on local markets and customer requirements, Tier 2 companies have gained a success rate of the development of process technologies which enhance the quality of their products. Their flexibility makes them quick to adopt changes which create new consumer needs, thus they get an advantage.
Tier 3 companies such as Rixona B.V., Patwary Potato Flakes Ltd., and Clarebout Potatoes NV are the local players focused on the market with inadequate distribution channels. These companies operate on the basis of local customer preferences with budget-friendly solutions that are very much distinct from original recipes.
Their operation at a lower scale allows them to act quickly to the market conditions getting back to the community by providing potatoes that really want. Even though the Tier 3 companies might not be as vast as their competitors, their innovativity and focus on budget based solutions meaningfully impact the industry's growth and competitiveness.
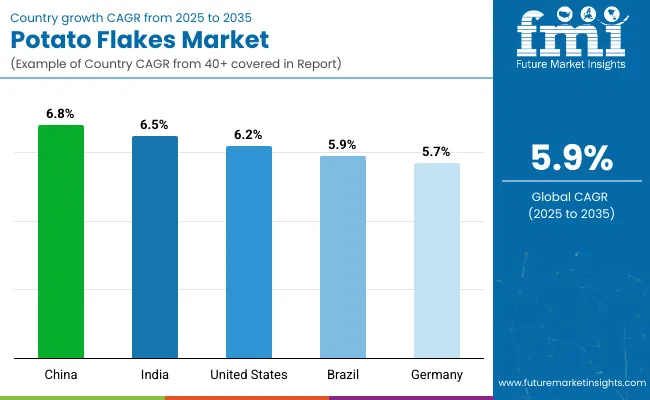
The following table highlights the projected growth rates of the top five markets for potato flakes. The United States and China lead the market due to their high consumption and versatile applications.
| Countries | CAGR, 2025 to 2035 |
|---|---|
| United States | 6.2% |
| China | 6.8% |
| India | 6.5% |
| Germany | 5.7% |
| Brazil | 5.9% |
The United States was a prominent market for potato flakes, mainly due to the major share of processed and convenience foods in consumption. Potato flakes are the most used food ingredients in ready-to-eat meals, snack coatings, and bakery products, and food manufacturers resort to the ingredient due to its easy-to-use feature and flexibility.
Moreover, the fast-growing interest of customers in clean-label and organic options stands the market growth; this, in turn, is due to the health believers, who look for the products containing only natural elements. Innovations in food processing technologies are an additional driving force that helps to further strengthen USA market position, as they enable manufacturers to enhance the quality and durability of potato flakes.
The presence of formidable companies like Nestlé S.A. and Idahoan Foods LLC operates as a catalyst for competition, innovation, and expansion of the products. The potato wafers market in the USA will have a positive perspective because the customers' interests are inclined towards convenient and health products both in the near and distant future.
China is witnessing a transformative phase in the potato flake market, mainly resulting from the rapid growth in urbanization and the consequent nutrition changes. The soaring middle-class population has emerged as a game-changer in the market by pushing instant foods and snacks where potato flakes occupy the major share. As the fast-paced lifestyles are turned to mainly solution preparation with time, people are more inclined towards potato flake products that require less engagement.
This has also been facilitated by the development of e-commerce where different brands are offering the convenience of the direct delivery of the products to consumers. The market is expected to grow at the CAGR rate of 2.4 throughout the forecast period, showing the increasing popularity of potato flakes in additional cooking, soups, and sauces.
Potato flakes market in India is growing significantly due to the establishment and expansion of foodservice and bakery sectors. The penetration of Western cuisine and convenience foods is one major driver for potato flakes which features them in assorted applications, from instant snacks to bakery products.
Furthermore, the advantages of adopting potato flakes in preparing traditional Indian snack items are supported by the growing trend in snacking culture, which is the key factor for the broadening of the market scope. Another major aspect that vegetarian and organic labels can help with is by creating new markets. The changes in public perception are now causing people to look for the best nutrients they can find in food by the choice of the right products.
The advantage of online shopping that includes the increase in the number of available outlets is another factor working in favor of consumers who will have better access to potato flakes. Therefore, India is ready for the impressive growth in the potato flakes sector, since it is reflecting the general trend of the convenience food market and the health direction in consumption.
The potato flakes market in Germany is mainly characterized by the strong organic and sustainable focus, representing the country's commitment to health and environmental concerns. Potato flakes are also the main ingredients for the health-conscious consumers who pay more attention to the natural sources in the premium product categories for snack and bakery items.
The rigorous quality standards and compliance regulations in Germany demand that the consumer demonstrates a continuous commitment to produce high-quality, sustainably-sourced potato flakes. Thus, consumers can build strong trust in these goods. Plus, the solid food processing sector in Germany is also behind the market growth, which is tied to the manufacturers' growing investments in R&D for hiking their productivity.
With the ever-increasing pervasiveness of consumers interested in organic potato flakes, the expansion of this category will likely follow as well. The European potato flakes industry stands to really benefit from these developments, as it is frontlining the drive toward sustainability and conscious food consumption.
In Brazil, the potato flakes market is also very fast raking in demand, becoming a possible probiotic ingredient in ready-to-eat meals. The market will be fueled by the increasing acceptance of naked potato snacks as it contains no meat, gluten, lactose, or any allergens. Urban people, who are heavily into ready-to-eat snacks, are now feeding the potato flakes market quite well, given that these snacks have potato flakes as one of the common ingredients.
Therefore, apart from attending the brunch, having lunch, and snacking, people are benefiting from the time saved cooking. As their day becomes busier with other activities, they are now seeking out convenient meals that require less preparation time.
Thus, the consumption of potato-based flake products in instant-mixing and baking snacks is increasing at a fast pace. This improvement in consumption of corn and forage maize also coincides with the application of potato flakes by the livestock feed sector. Besides, the potato flakes' commonality in the food sector has gained significance by the fact that they are also used as livestock nutrition feed.
Potato flakes, additionally, are commonly used in snacks while Brazil's expanding middle class also contributes to market growth by providing healthier and more convenient food options. Therefore, the potato flake market in Brazil is well on its way to being a top player in the global market in the following years.
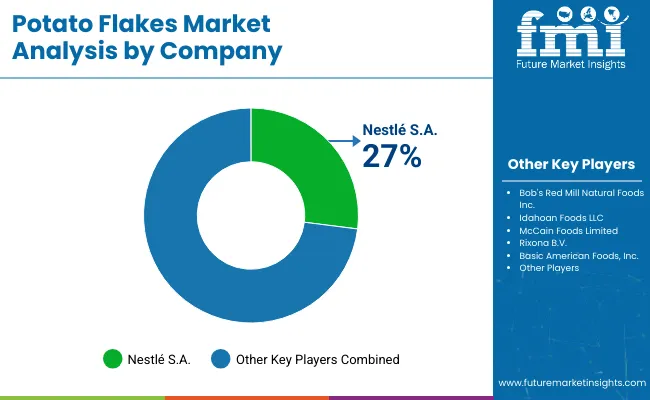
The potato flakes market is highly competitive with key players like Conagra Brands, McCain Foods, Lamb Weston, and J.R. Simplot Company. These companies focus on product innovation, expanding distribution channels, and enhancing supply chain efficiency to maintain market share.
They invest in developing convenient and value-added potato flake products tailored for both retail and foodservice sectors. Strategic partnerships and acquisitions are common to strengthen their global footprint.
Emphasis on sustainable sourcing and meeting consumer demand for clean-label ingredients also distinguishes market leaders. Continuous adaptation to changing consumer preferences and regional expansion remain critical strategies driving competition in this dynamic market.
| Report Attributes | Details |
|---|---|
| Current Total Market Size (2025) | USD 3.4 billion |
| Projected Market Size (2035) | USD 6.03 billion |
| CAGR (2025 to 2035) | 5.9% |
| Base Year for Estimation | 2024 |
| Historical Period | 2020 to 2024 |
| Projections Period | 2025 to 2035 |
| Quantitative Units | USD billion for value and kilotons for volume |
| Form/Types Analyzed (Segment 1) | Standard Flakes, Mashed Potato Pellets, Powder/Granules, Specialty Flakes |
| End-Use Applications Analyzed (Segment 2) | Snack Foods, Ready Meals, Food Service, Bakery, Soups & Sauces, Others |
| Distribution Channels Analyzed (Segment 3) | B2B/Industrial |
| Regions Covered | North America; Latin America; Western Europe; Eastern Europe; South Asia and Pacific; East Asia; Middle East & Africa |
| Countries Covered | United States, Canada, Mexico, Brazil, Argentina, Germany, France, United Kingdom, Italy, Spain, Netherlands, China, India, Japan, South Korea, ANZ, GCC Countries, South Africa |
| Key Players influencing the Potato Flakes Market | Nestlé S.A., Bob's Red Mill Natural Foods Inc., Idahoan Foods LLC, McCain Foods Limited, Rixona B.V., Basic American Foods, Inc., Agrarfrost GmbH & Co. KG, Patwary Potato Flakes Ltd., Clarebout Potatoes NV, Goodrich Cereals, Lamb Weston Holdings Inc. |
| Additional Attributes | Dollar sales by end-use (snacks, ready meals, foodservice), Organic vs conventional segmentation, Demand growth in convenience and quick-prep foods, Usage trends in fast-casual dining and institutional catering, Technological improvements in dehydration and texture retention |
| Customization and Pricing | Customization and Pricing Available on Request |
The global industry is estimated at a value of USD 3.4 billion in 2025.
Sales increased at 5.2% CAGR between 2020 and 2024.
Some of the leaders in this industry include Nestlé S.A., Bob's Red Mill Natural Foods Inc., Idahoan Foods LLC, McCain Foods Limited, Rixona B.V., Basic American Foods, Inc., Agrarfrost GmbH & Co. KG, Patwary Potato Flakes Ltd., and Others.
The Europe and East Asian territory is projected to hold a revenue share of 44.5% over the forecast period.
The industry is projected to grow at a forecast CAGR of 5.9% from 2025 to 2035.


Our Research Products

The "Full Research Suite" delivers actionable market intel, deep dives on markets or technologies, so clients act faster, cut risk, and unlock growth.

The Leaderboard benchmarks and ranks top vendors, classifying them as Established Leaders, Leading Challengers, or Disruptors & Challengers.

Locates where complements amplify value and substitutes erode it, forecasting net impact by horizon

We deliver granular, decision-grade intel: market sizing, 5-year forecasts, pricing, adoption, usage, revenue, and operational KPIs—plus competitor tracking, regulation, and value chains—across 60 countries broadly.

Spot the shifts before they hit your P&L. We track inflection points, adoption curves, pricing moves, and ecosystem plays to show where demand is heading, why it is changing, and what to do next across high-growth markets and disruptive tech

Real-time reads of user behavior. We track shifting priorities, perceptions of today’s and next-gen services, and provider experience, then pace how fast tech moves from trial to adoption, blending buyer, consumer, and channel inputs with social signals (#WhySwitch, #UX).

Partner with our analyst team to build a custom report designed around your business priorities. From analysing market trends to assessing competitors or crafting bespoke datasets, we tailor insights to your needs.
Supplier Intelligence
Discovery & Profiling
Capacity & Footprint
Performance & Risk
Compliance & Governance
Commercial Readiness
Who Supplies Whom
Scorecards & Shortlists
Playbooks & Docs
Category Intelligence
Definition & Scope
Demand & Use Cases
Cost Drivers
Market Structure
Supply Chain Map
Trade & Policy
Operating Norms
Deliverables
Buyer Intelligence
Account Basics
Spend & Scope
Procurement Model
Vendor Requirements
Terms & Policies
Entry Strategy
Pain Points & Triggers
Outputs
Pricing Analysis
Benchmarks
Trends
Should-Cost
Indexation
Landed Cost
Commercial Terms
Deliverables
Brand Analysis
Positioning & Value Prop
Share & Presence
Customer Evidence
Go-to-Market
Digital & Reputation
Compliance & Trust
KPIs & Gaps
Outputs
Full Research Suite comprises of:
Market outlook & trends analysis
Interviews & case studies
Strategic recommendations
Vendor profiles & capabilities analysis
5-year forecasts
8 regions and 60+ country-level data splits
Market segment data splits
12 months of continuous data updates
DELIVERED AS:
PDF EXCEL ONLINE
Market Leaders & Share in the Potato Flakes Industry
UK Potato Flakes Market Report – Growth, Demand & Forecast 2025-2035
USA Potato Flakes Market Growth – Innovations, Trends & Forecast 2025-2035
ASEAN Potato Flakes Market Report – Growth, Demand & Forecast 2025-2035
Europe Potato Flakes Market Trends – Demand, Innovations & Forecast 2025-2035
Australia Potato Flakes Market Trends – Growth, Demand & Analysis 2025-2035
Latin America Potato Flakes Market Report – Demand, Growth & Industry Outlook 2025-2035
Potato Fiber Market Size and Share Forecast Outlook 2025 to 2035
Potato Processing Market Size and Share Forecast Outlook 2025 to 2035
Potato Soup Market Size and Share Forecast Outlook 2025 to 2035
Potato Peel Powder Market Size and Share Forecast Outlook 2025 to 2035
Flakes Making Machine Market Size and Share Forecast Outlook 2025 to 2035
Understanding Potato Soup Market Share & Market Trends
Potato Protein Market Outlook - Growth, Demand & Forecast 2025 to 2035
Potato Granules Market
UK Potato Soup Market Growth – Trends, Demand & Forecast 2025-2035
Pea Flakes Market Size and Share Forecast Outlook 2025 to 2035
USA Potato Soup Market Trends – Growth, Demand & Innovations 2025-2035
Market Share Breakdown of Pea Flakes Manufacturers
Yeast Flakes Market

Thank you!
You will receive an email from our Business Development Manager. Please be sure to check your SPAM/JUNK folder too.
Chat With
MaRIA