Reports

- Global Locations -

Headquarters

Future Market Insights, Inc.

Christiana Corporate, 200
Continental Drive, Suite 401,
Newark, Delaware - 19713,
United States

T: +1-845-579-5705

Americas

Future Market Insights, Inc.

616 Corporate Way, Suite 2-9018,
Valley Cottage, NY 10989, United States

T: +1-347-918-3531

MEA

Future Market Insights

1602-6 Jumeirah Bay X2 Tower, Plot No: JLT-PH2-X2A,
Jumeirah Lakes Towers, Dubai,
United Arab Emirates

Europe

Future Market Insights

3rd Floor, 207 Regent Street,
W1B 3HH London
United Kingdom

T: + 44 (0) 20 8123 9659
D: +44 (0) 20 3287 4268

Asia Pacific

Future Market Insights

IndiaLand Global Tech Park, Unit UG-1, Behind Grand HighStreet, Phase 1, Hinjawadi, MH, Pune – 411057, India

Potato Soup Market Outlook (2022 to 2032)

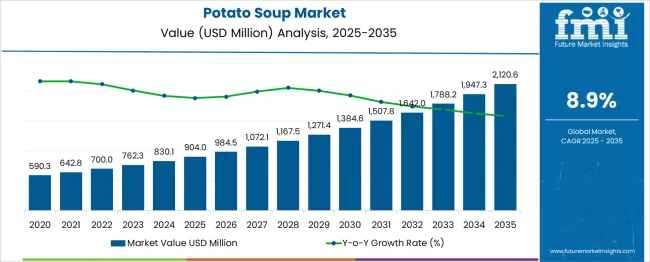
[350 Pages Report] The potato soup market is projected to grow at a CAGR of 8.9% during the forecast period, to reach a value of US$ 1.7 Billion by 2032. The global potato soup demand is projected to grow year-on-year (Y-o-Y) growth of 8.2% in 2022.

Attribute Details
Potato Soup Market Size Value in 2022 US$ 700 Million
Market Forecast Value in 2032 US$ 1.7 Billion
Global Growth Rate (2022 to 2032) ~ 8.9% CAGR
Forecast Period 2022 to 2032
Collective Value Share: Top 3 Countries (2021A) 44.2%

To increase their revenue, potato soup brands must adapt and evolve by offering different soup flavours and keep them coming back to the brands. From Mediterranean flavours with pancetta and Italian tomato to flavours of honey and spiced parsnip, consumers are inclining towards exotic-flavoured potato soup.

Don't pay for what you don't need

Customize your report by selecting specific countries or regions and save 30%!

2017 to 2021 Potato Soup Market Outlook Compared to 2022 to 2032 Forecast

Potato soup demand grew at 8.9% CAGR between 2017 and 2021, according to Future Market Insights (FMI). According to the study, almost 70% of potato soup consumers would pay more for fresh and ready-made soup than that spending time making soups on their own. Hence, potato soup can help in delivering both time and nutrition.

On the back of these factors, the demand for potato soup is further projected to grow at CAGR worth 7.7% over the forecast period (2022 to 2032). The potato soup market along with baked potato soup, fresh potato soup, flavored potato soup, powdered potato soup, ready to cook potato soup, are projected to reflect a favorable growth outlook in terms of revenue, according to Future Market Insights.

Potato Soup Market

Country-wise Insights

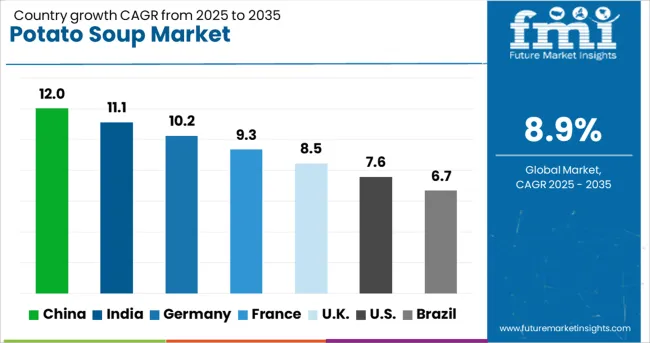
How will the Demand for Potato Soup be Rising in the USA?

Rising Organic Potato Soup Sales to Boost the USA Potato Soup Market

The use of different organic ingredients in potato soup, such as organic leeks, organic fire-roasted sweet potatoes, organic coconut milk, organic green lentils, and others is gaining traction in the US.

Hence, brands like Amy's Kitchen combines all the aforementioned organic items in the Thai Curry Sweet Potato Lentil Soup to make it delicious and to deliver dairy-free and gluten-free product.

What is the Sales Outlook of Potato Soup in Japan?

Inclusion in Traditional Miso Soup Is Propelling Potato Soup Demand in Japan

Japanese miso soup, a flavourful soup broth, is made with dashi and fresh ingredients to reflect the flavors of the season and are very popular staple soup in Japanese cuisine. The traditional soup is now being experimented with in different broth items, among which onion and potato soup broths are the common items. The popular soup is prepared by adding soy sauce and dashi to a mashed buttery potato broth and then, infusing them together.

How Big Is the Opportunity for Potato Soup Market in the UK?

Potato Soup Sales to Surge as a Serving in Universities and Healthcare Facilities

In the UK, several potato soup companies, such as The Real Soup Co., provide great-tasting fresh soup to consumers. These are crafted in small batches for convenience and out-of-home markets.

Along with supermarket and online retail shops, potato soup is being served to universities and healthcare facilities as well as authentic flavors to keep menus interesting and diverse. Further, the soup contains FSA salt guidelines and are vegan, vegetarian, and allergen-free product.

While the potato soup is available on university campuses, such as the University of Southampton, Staffordshire University, and others, the brand has partnered with NACC and HCA to provide the creamy textured soup to the healthcare systems in the UK These soups are made available for the patients who suffer from dysphagia, experience loss of appetite, or with swallowing difficulties.
Nandini Roy Choudhury

Principal Consultant

Talk to Analyst

Find your sweet spots for generating winning opportunities in this market.

Category-wise Insights

Why is Baked Potato Soup Gaining Traction?

Baked Potato Soup to Remain Highly Sought-After Among Consumers

Baked potato soup with no artificial sweeteners, preservatives, colours, or flavours is in demand, be it uncured and smoked bacon in a rich creamy potato paste or russet potatoes. These are home-style cuts and simmered with select seasonings.

Baked potato soup is not only a delicious dish among consumers, but also a crowd-pleaser on its own as a delicious ingredient in pot pie crust or potatoes ‘au gratin’.

Which is the Leading Sales Channel in Potato Soup Market?

Burgeoning Demand for Ready-to-Cook Meals to Propel Potato Soup Production

Potato soup is gradually becoming a popular food option for caterers, making the product a versatile menu option all year round, specifically when suppliers are relying on more diverse flavours now to choose from.

Further, with the growing demand for a value-added meal which is affordable and convenient to consume, the sales of ready-to-cook potato soup will offer a profitable and quick option for them.
Competitive Landscape

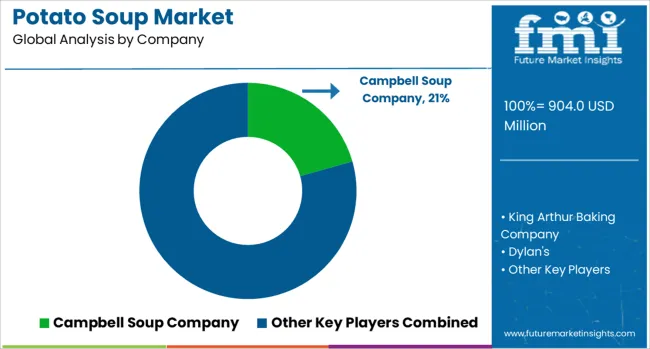
Key potato soup manufacturers are looking for capturing the market with joint ventures, partnerships, mergers, and acquisitions. Further, top potato soup brands are focusing on upgraded and modified products with rising demand for new formulations from the food and beverage industry.

For instance,

  • In April 2022, Casalasco announced its partnership with Rosella, an Australian brand, which serves jams, preserves, vegetable creams, and dressings since 1895 to retail store shelves, and one of the favorite product suppliers to Australians for generations. Through this partnership, Casalasco now produces the classic Delicious Carrot & Potato Soup for the company, as well as Condensed Tomato Soup, Creamy Pumpkin Soup, and Tomato Roasted Bell Pepper Soup.

Get the data you need at a Fraction of the cost

Personalize your report by choosing insights you need
and save 40%!

Scope of Report

Attribute Details
Market Size Value in 2022 US$ 0.7 Billion
Market Forecast Value in 2032 US$ 1.7 Billion
Global Growth Rate 8.9% CAGR
Forecast Period 2022 to 2032
Historical Data Available for 2017 to 2021
Market Analysis MT for Volume and US$ Billion for Value
Key Regions Covered North America, Latin America, Europe, East Asia, South Asia, Oceania, and MEA
Key Countries Covered United States, Canada, Brazil, Mexico, Argentina, Chile, Peru, Germany, France, Italy, Spain, UK, Netherlands, Belgium, Nordic, Russia, Poland, China, Japan, South Korea, India, Thailand, Malaysia, Indonesia, Singapore, Australia, New Zealand, GCC Countries, South Africa, Central Africa, and others
Key Market Segments Covered Product Type, Packaging Type, Flavor, Product Format, Usage Format, Sales Channel, and Regions
Key Companies Profiled
  • Campbell Soup Company
  • King Arthur Baking Company
  • Dylan's
  • Bear Creek® (B&G Foods, Inc.)
  • Idahoan Foods, LLC
  • Progresso (General Mills)
  • Amy's Kitchen, Inc.
  • Knorr (Unilever Plc)
  • The Real Soup Co.
  • Kettle Cuisine, LLC
  • Fresh Fayre (Fresh Direct Limited)
  • Panera Bread
  • Others
Pricing Available upon Request

Potato Soup Market by Category

By Product Type:

  • Plain
  • Baked
  • Mixed
  • Others

By Packaging Type:

  • Fresh
  • Frozen
  • Canned
  • Others

By Flavor:

  • Unflavoured
  • Flavored

By Product Format:

  • Cream
  • Powder
  • Chunk
  • Paste
  • Others

By Usage Format:

  • Ready to Cook
  • Ready to Eat

By Sales Channel:

  • B2B / HoReCa
  • B2C
    • Hypermarkets /Supermarkets
    • Convenience Stores
    • Mom and Pop Stores
    • Discount Stores
    • Food Specialty Stores
    • Independent Small Groceries
    • Online Retail
    • Others Retail Formats

By Region:

  • North America
  • Latin America
  • Europe
  • East Asia
  • South Asia
  • Oceania
  • Middle East & Africa

Frequently Asked Questions

How much worth is the potato soup industry?

The potato soup market is estimated to reach sales nearly US$ 0.7 Billion by 2022.

At what CAGR is the market expected to expand through 2032?

Potato soup market revenue is expected to increase at a CAGR of around 8.9% during the period 2022 to 2032.

How was the performance of potato soup over the past half-decade?

Potato soup sales increased a CAGR of around 7.7% over the past half-decade.

What will be the market for potato soup worth in 2032?

The global potato soup market value will be around US$ 1.7 Billion in 2032.

Who are the key players operating in the market?

Campbell Soup Company, King Arthur Baking Company, Dylan's, Bear Creek® (B&G Foods, Inc.), and Idahoan Foods, LLC are a few among the top players driving the market growth.

Which are the top countries driving the potato soup market demand?

Top countries driving the potato soup demand are the USA, Japan, UK, China, and Thailand.

What are the key factors affecting the potato soup market growth?

High product demand from food service industry, soaring production of raw material, tasty and convenient product form are the factors driving growth of potato soup market.

Table of Content

1. Executive Summary | Potato Soup Market

    1.1. Global Market Outlook

    1.2. Demand-side Trends

    1.3. Supply-side Trends

    1.4. Technology Roadmap Analysis

    1.5. Analysis and Recommendations

2. Market Overview

    2.1. Market Coverage / Taxonomy

    2.2. Market Definition / Scope / Limitations

3. The Massive Impact of the Crisis

    3.1. Global Market Forecast Scenario Comparison of Annual Growth Rates for Short Term (2022 to 2025) and Long Term (2026 to 2032)

        3.1.1. Optimistic Scenario

            3.1.1.1. China

            3.1.1.2. USA

            3.1.1.3. India

            3.1.1.4. Euro Zone

            3.1.1.5. Asia Pacific

            3.1.1.6. Rest of the World

        3.1.2. Likely Scenario

            3.1.2.1. China

            3.1.2.2. US

            3.1.2.3. India

            3.1.2.4. Euro Zone

            3.1.2.5. Asia Pacific

            3.1.2.6. Rest of the World

        3.1.3. Pessimistic Scenario

            3.1.3.1. China

            3.1.3.2. US

            3.1.3.3. India

            3.1.3.4. Euro Zone

            3.1.3.5. Asia Pacific

            3.1.3.6. Rest of the World

    3.2. Key Factors Impacting the Market

    3.3. Note: Market Assessment shall be Provided for Likely Scenario

4. Market Background

    4.1. Global Production Outlook of the Market

    4.2. Product Claims & Nutritional Information Scan of Potato Soup

    4.3. Product Launches Track & Trends

    4.4. Macro-Economic Factors

    4.5. Forecast Factors - Relevance & Impact

    4.6. Consumers Survey Analysis

    4.7. Market Dynamics

        4.7.1. Supply Side Drivers

        4.7.2. Demand Side drivers

        4.7.3. Economic Side Drivers

        4.7.4. Restraints

        4.7.5. Opportunity

        4.7.6. Trends

5. Key Regulations

    5.1. Specialized Processes FDA Regulation

    5.2. Packaging & Labelling Regulations

    5.3. Certifications and Certifying Agency Overview

    5.4. Import/Export Regulations

6. Global Market Demand Analysis 2017 to 2021 and Forecast, 2022 to 2032

    6.1.  Historical Market Volume (Metric Tons) Analysis, 2017 to 2021

    6.2.  Current and Future Market Volume (Metric Tons) Projections, 2022 to 2032

    6.3.  Y-o-Y Growth Trend Analysis 2022 to 2032

7. Global Market - Pricing Analysis

    7.1. Regional Pricing Analysis (USD/Metric Ton) By Product Type (2017,2022,2032)

        7.1.1. Plain

        7.1.2. Baked

        7.1.3. Mixed

        7.1.4. Others

    7.2. Pricing Break-up (2017,2022,2032)

        7.2.1. Producer-Level Pricing

        7.2.2. Distributor Level Pricing

        7.2.3. Retailer Level Pricing

    7.3. Global Average Pricing Analysis Benchmark

8. Global Market Demand (Size in USD Million) Analysis 2017 to 2021 and Forecast, 2022 to 2032

    8.1. Historical Market Value (USD Million) Analysis, 2017 to 2021

    8.2. Current and Future Market Value (USD Million) Projections, 2022 to 2032

        8.2.1. Y-o-Y Growth Trend Analysis

        8.2.2. Absolute $ Opportunity Analysis

9. Global Market Analysis 2017 to 2021 and Forecast 2022 to 2032, By Product Type

    9.1. Introduction / Key Findings

    9.2. Historical Market Size (USD Million) and Volume Analysis By Product Type, 2017 to 2021

    9.3. Current and Future Market Size (USD Million) and Volume Analysis and Forecast By Product Type, 2022 to 2032

        9.3.1. Plain

        9.3.2. Baked

        9.3.3. Mixed

        9.3.4. Others

    9.4. Market Attractiveness Analysis By Product Type

10. Global Market Analysis 2017 to 2021 and Forecast 2022 to 2032, By Packaging Type

    10.1. Introduction / Key Findings

    10.2. Historical Market Size (USD Million) and Volume Analysis By Packaging Type, 2017 to 2021

    10.3. Current and Future Market Size (USD Million) and Volume Analysis and Forecast By Packaging Type, 2022 to 2032

        10.3.1. Fresh

        10.3.2. Frozen

        10.3.3. Canned

        10.3.4. Others

    10.4. Market Attractiveness Analysis By Packaging Type

11. Global Market Analysis 2017 to 2021 and Forecast 2022 to 2032, By Flavor

    11.1. Introduction / Key Findings

    11.2. Historical Market Size (USD Million) and Volume Analysis By Flavor, 2017 to 2021

    11.3. Current and Future Market Size (USD Million) and Volume Analysis and Forecast By Flavor, 2022 to 2032

        11.3.1. Unflavoured

        11.3.2. Flavoured

    11.4. Market Attractiveness Analysis By Flavor

12. Global Market Analysis 2017 to 2021 and Forecast 2022 to 2032, By Product Format

    12.1. Introduction / Key Findings

    12.2. Historical Market Size (USD Million) and Volume Analysis By Product Format, 2017 to 2021

    12.3. Current and Future Market Size (USD Million) and Volume Analysis and Forecast By Product Format, 2022 to 2032

        12.3.1. Cream

        12.3.2. Powder

        12.3.3. Chunk

        12.3.4. Paste

        12.3.5. Others

    12.4. Market Attractiveness Analysis By Product Format

13. Global Market Analysis 2017 to 2021 and Forecast 2022 to 2032, By Usage Format

    13.1. Introduction / Key Findings

    13.2. Historical Market Size (USD Million) and Volume Analysis By Usage Format, 2017 to 2021

    13.3. Current and Future Market Size (USD Million) and Volume Analysis and Forecast By Usage Format, 2022 to 2032

        13.3.1. Ready to Cook

        13.3.2. Ready to Eat

    13.4. Market Attractiveness Analysis By Usage Format

14. Global Market Analysis 2017 to 2021 and Forecast 2022 to 2032, By Sales Channel

    14.1. Introduction / Key Findings

    14.2. Historical Market Size (USD Million) and Volume Analysis By Sales Channel, 2017 to 2021

    14.3. Current and Future Market Size (USD Million) and Volume Analysis and Forecast By Sales Channel, 2022 to 2032

        14.3.1. B2B / HoReCa

        14.3.2. B2C

            14.3.2.1. Hypermarkets /Supermarkets

            14.3.2.2. Convenience Stores

            14.3.2.3. Mom-and-Pop Stores

            14.3.2.4. Discount Stores

            14.3.2.5. Food Specialty Stores

            14.3.2.6. Independent Small Groceries

            14.3.2.7. Online Retail

            14.3.2.8. Other Retail Formats

    14.4. Market Attractiveness Analysis By Sales Channel

15. Global Market Analysis 2017 to 2021 and Forecast 2022 to 2032, By Region

    15.1. Introduction / Key Findings

    15.2. Historical Market Size (USD Million) and Volume Analysis By Region, 2017 to 2021

    15.3. Current and Future Market Size (USD Million) and Volume Analysis and Forecast By Region, 2022 to 2032

        15.3.1. North America

        15.3.2. Latin America

        15.3.3. Europe

        15.3.4. East Asia

        15.3.5. South Asia

        15.3.6. Oceania

        15.3.7. Middle East & Africa

    15.4. Market Attractiveness Analysis By Region

16. North America Market Analysis 2017 to 2021 and Forecast 2022 to 2032

    16.1. Introduction

    16.2. Historical Market Size (USD Million) and Volume Trend Analysis By Market Taxonomy, 2017 to 2021

    16.3. Market Size (USD Million) and Volume Forecast By Market Taxonomy, 2022 to 2032

        16.3.1.  By Country

            16.3.1.1. United States of America

            16.3.1.2. Canada

        16.3.2. By Product Type

        16.3.3. By Flavor

        16.3.4. By Packaging Type

        16.3.5. By Product Format

        16.3.6. By Usage Format

        16.3.7. By Sales Channel

    16.4. Market Attractiveness Analysis

        16.4.1. By Product Type

        16.4.2. By Flavor

        16.4.3. By Packaging Type

        16.4.4. By Product Format

        16.4.5. By Usage Format

        16.4.6. By Sales Channel

    16.5. Market Trends

    16.6. Key Market Participants - Intensity Mapping

    16.7. Drivers and Restraints - Impact Analysis

17. Latin America Market Analysis 2017 to 2021 and Forecast 2022 to 2032

    17.1. Introduction

    17.2. Historical Market Size (USD Million) and Volume Trend Analysis By Market Taxonomy, 2017 to 2021

    17.3. Market Size (USD Million) and Volume Forecast By Market Taxonomy, 2022 to 2032

        17.3.1.  By Country

            17.3.1.1. Brazil

            17.3.1.2. Mexico

            17.3.1.3. Argentina

            17.3.1.4. Chile

            17.3.1.5. Peru

            17.3.1.6. Rest of Latin America

        17.3.2. By Product Type

        17.3.3. By Flavor

        17.3.4. By Packaging Type

        17.3.5. By Product Format

        17.3.6. By Usage Format

        17.3.7. By Sales Channel

    17.4. Market Attractiveness Analysis

        17.4.1. By Product Type

        17.4.2. By Flavor

        17.4.3. By Packaging Type

        17.4.4. By Product Format

        17.4.5. By Usage Format

        17.4.6. By Sales Channel

    17.5. Market Trends

    17.6. Key Market Participants - Intensity Mapping

    17.7. Drivers and Restraints - Impact Analysis

18. Europe Market Analysis 2017 to 2021and Forecast 2022 to 2032

    18.1. Introduction

    18.2. Historical Market Size (USD Million) and Volume Trend Analysis By Market Taxonomy, 2017 to 2021

    18.3. Market Size (USD Million) and Volume Forecast By Market Taxonomy, 2022 to 2032

        18.3.1.  By Country

            18.3.1.1. Germany

            18.3.1.2. Italy

            18.3.1.3. France

            18.3.1.4. UK

            18.3.1.5. Spain

            18.3.1.6. BENELUX

            18.3.1.7. Nordic

            18.3.1.8. Russia

            18.3.1.9. Poland

            18.3.1.10. Rest of Europe

        18.3.2. By Product Type

        18.3.3. By Flavor

        18.3.4. By Packaging Type

        18.3.5. By Product Format

        18.3.6. By Usage Format

        18.3.7. By Sales Channel

    18.4. Market Attractiveness Analysis

        18.4.1. By Product Type

        18.4.2. By Flavor

        18.4.3. By Packaging Type

        18.4.4. By Product Format

        18.4.5. By Usage Format

        18.4.6. By Sales Channel

    18.5. Market Trends

    18.6. Key Market Participants - Intensity Mapping

    18.7. Drivers and Restraints - Impact Analysis

19. East Asia Market Analysis 2017 to 2021 and Forecast 2022 to 2032

    19.1. Introduction

    19.2. Historical Market Size (USD Million) and Volume Trend Analysis By Market Taxonomy, 2017 to 2021

    19.3. Market Size (USD Million) and Volume Forecast By Market Taxonomy, 2022 to 2032

        19.3.1.  By Country

            19.3.1.1. China

            19.3.1.2. East Asia

            19.3.1.3. South Korea

        19.3.2. By Product Type

        19.3.3. By Flavor

        19.3.4. By Packaging Type

        19.3.5. By Product Format

        19.3.6. By Usage Format

        19.3.7. By Sales Channel

    19.4. Market Attractiveness Analysis

        19.4.1. By Product Type

        19.4.2. By Flavor

        19.4.3. By Packaging Type

        19.4.4. By Product Format

        19.4.5. By Usage Format

        19.4.6. By Sales Channel

    19.5. Market Trends

    19.6. Key Market Participants - Intensity Mapping

    19.7. Drivers and Restraints - Impact Analysis

20. South Asia Market Analysis 2017 to 2021 and Forecast 2022 to 2032

    20.1. Introduction

    20.2. Historical Market Size (USD Million) and Volume Trend Analysis By Market Taxonomy, 2017 to 2021

    20.3. Market Size (USD Million) and Volume Forecast By Market Taxonomy, 2022 to 2032

        20.3.1.  By Country

            20.3.1.1. India

            20.3.1.2. Indonesia

            20.3.1.3. Malaysia

            20.3.1.4. Thailand

            20.3.1.5. Rest of South Asia

        20.3.2. By Product Type

        20.3.3. By Flavor

        20.3.4. By Packaging Type

        20.3.5. By Product Format

        20.3.6. By Usage Format

        20.3.7. By Sales Channel

    20.4. Market Attractiveness Analysis

        20.4.1. By Product Type

        20.4.2. By Flavor

        20.4.3. By Packaging Type

        20.4.4. By Product Format

        20.4.5. By Usage Format

        20.4.6. By Sales Channel

    20.5. Market Trends

    20.6. Key Market Participants - Intensity Mapping

    20.7. Drivers and Restraints - Impact Analysis

21. Oceania Market Analysis 2017 to 2021 and Forecast 2022 to 2032

    21.1. Introduction

    21.2. Historical Market Size (USD Million) and Volume Trend Analysis By Market Taxonomy, 2017 to 2021

    21.3. Market Size (USD Million) and Volume Forecast By Market Taxonomy, 2022 to 2032

        21.3.1.  By Country

            21.3.1.1. Australia

            21.3.1.2. New-Zealand

        21.3.2. By Product Type

        21.3.3. By Flavor

        21.3.4. By Packaging Type

        21.3.5. By Product Format

        21.3.6. By Usage Format

        21.3.7. By Sales Channel

    21.4. Market Attractiveness Analysis

        21.4.1. By Product Type

        21.4.2. By Flavor

        21.4.3. By Packaging Type

        21.4.4. By Product Format

        21.4.5. By Usage Format

        21.4.6. By Sales Channel

    21.5. Market Trends

    21.6. Key Market Participants - Intensity Mapping

    21.7. Drivers and Restraints - Impact Analysis

22. Middle East and Africa Market Analysis 2017 to 2021 and Forecast 2022 to 2032

    22.1. Introduction

    22.2. Historical Market Size (USD Million) and Volume Trend Analysis By Market Taxonomy, 2017 to 2021

    22.3. Market Size (USD Million) and Volume Forecast By Market Taxonomy, 2022 to 2032

        22.3.1.  By Country

            22.3.1.1. GCC Countries

            22.3.1.2. North Africa

            22.3.1.3. South Africa

            22.3.1.4. Turkey

            22.3.1.5. Rest of MEA

        22.3.2. By Product Type

        22.3.3. By Flavor

        22.3.4. By Packaging Type

        22.3.5. By Product Format

        22.3.6. By Usage Format

        22.3.7. By Sales Channel

    22.4. Market Attractiveness Analysis

        22.4.1. By Product Type

        22.4.2. By Flavor

        22.4.3. By Packaging Type

        22.4.4. By Product Format

        22.4.5. By Usage Format

        22.4.6. By Sales Channel

    22.5. Market Trends

    22.6. Key Market Participants - Intensity Mapping

    22.7. Drivers and Restraints - Impact Analysis

23. Key Countries Market Analysis 2017 to 2021 and Forecast 2022 to 2032

    23.1. USA Market Value and Volume Analysis 2017 to 2021 and Forecast 2022 to 2032

        23.1.1. By Product Type

        23.1.2. By Flavor

        23.1.3. By Packaging Type

        23.1.4. By Product Format

        23.1.5. By Usage Format

        23.1.6. By Sales Channel

    23.2. Canada Market Value and Volume Analysis 2017 to 2021 and Forecast 2022 to 2032

        23.2.1. By Product Type

        23.2.2. By Flavor

        23.2.3. By Packaging Type

        23.2.4. By Product Format

        23.2.5. By Usage Format

        23.2.6. By Sales Channel

    23.3. Brazil Market Value and Volume Analysis 2017 to 2021 and Forecast 2022 to 2032

        23.3.1. By Product Type

        23.3.2. By Flavor

        23.3.3. By Packaging Type

        23.3.4. By Product Format

        23.3.5. By Usage Format

        23.3.6. By Sales Channel

    23.4. Mexico Market Value and Volume Analysis 2017 to 2021 and Forecast 2022 to 2032

        23.4.1. By Product Type

        23.4.2. By Flavor

        23.4.3. By Packaging Type

        23.4.4. By Product Format

        23.4.5. By Usage Format

        23.4.6. By Sales Channel

    23.5. Russia Market Value and Volume Analysis 2017 to 2021 and Forecast 2022 to 2032

        23.5.1. By Product Type

        23.5.2. By Flavor

        23.5.3. By Packaging Type

        23.5.4. By Product Format

        23.5.5. By Usage Format

        23.5.6. By Sales Channel

    23.6. Poland Market Value and Volume Analysis 2017 to 2021 and Forecast 2022 to 2032

        23.6.1. By Product Type

        23.6.2. By Flavor

        23.6.3. By Packaging Type

        23.6.4. By Product Format

        23.6.5. By Usage Format

        23.6.6. By Sales Channel

    23.7. France Market Value and Volume Analysis 2017 to 2021 and Forecast 2022 to 2032

        23.7.1. By Product Type

        23.7.2. By Flavor

        23.7.3. By Packaging Type

        23.7.4. By Product Format

        23.7.5. By Usage Format

        23.7.6. By Sales Channel

    23.8. Spain Market Value and Volume Analysis 2017 to 2021 and Forecast 2022 to 2032

        23.8.1. By Product Type

        23.8.2. By Flavor

        23.8.3. By Packaging Type

        23.8.4. By Product Format

        23.8.5. By Usage Format

        23.8.6. By Sales Channel

    23.9. Italy Market Value and Volume Analysis 2017 to 2021 and Forecast 2022 to 2032

        23.9.1. By Product Type

        23.9.2. By Flavor

        23.9.3. By Packaging Type

        23.9.4. By Product Format

        23.9.5. By Usage Format

        23.9.6. By Sales Channel

    23.10. Germany Market Value and Volume Analysis 2017 to 2021 and Forecast 2022 to 2032

        23.10.1. By Product Type

        23.10.2. By Flavor

        23.10.3. By Packaging Type

        23.10.4. By Product Format

        23.10.5. By Usage Format

        23.10.6. By Sales Channel

    23.11. UK Market Value and Volume Analysis 2017 to 2021 and Forecast 2022 to 2032

        23.11.1. By Product Type

        23.11.2. By Flavor

        23.11.3. By Packaging Type

        23.11.4. By Product Format

        23.11.5. By Usage Format

        23.11.6. By Sales Channel

    23.12. Chile Market Value and Volume Analysis 2017 to 2021 and Forecast 2022 to 2032

        23.12.1. By Product Type

        23.12.2. By Flavor

        23.12.3. By Packaging Type

        23.12.4. By Product Format

        23.12.5. By Usage Format

        23.12.6. By Sales Channel

    23.13. Peru Market Value and Volume Analysis 2017 to 2021 and Forecast 2022 to 2032

        23.13.1. By Product Type

        23.13.2. By Flavor

        23.13.3. By Packaging Type

        23.13.4. By Product Format

        23.13.5. By Usage Format

        23.13.6. By Sales Channel

    23.14. China Market Value and Volume Analysis 2017 to 2021 and Forecast 2022 to 2032

        23.14.1. By Product Type

        23.14.2. By Flavor

        23.14.3. By Packaging Type

        23.14.4. By Product Format

        23.14.5. By Usage Format

        23.14.6. By Sales Channel

    23.15. Japan Market Value and Volume Analysis 2017 to 2021 and Forecast 2022 to 2032

        23.15.1. By Product Type

        23.15.2. By Flavor

        23.15.3. By Packaging Type

        23.15.4. By Product Format

        23.15.5. By Usage Format

        23.15.6. By Sales Channel

    23.16. India Market Value and Volume Analysis 2017 to 2021 and Forecast 2022 to 2032

        23.16.1. By Product Type

        23.16.2. By Flavor

        23.16.3. By Packaging Type

        23.16.4. By Product Format

        23.16.5. By Usage Format

        23.16.6. By Sales Channel

    23.17. GCC Countries Market Value and Volume Analysis 2017 to 2021 and Forecast 2022 to 2032

        23.17.1. By Product Type

        23.17.2. By Flavor

        23.17.3. By Packaging Type

        23.17.4. By Product Format

        23.17.5. By Usage Format

        23.17.6. By Sales Channel

    23.18. South Africa Market Value and Volume Analysis 2017 to 2021 and Forecast 2022 to 2032

        23.18.1. By Product Type

        23.18.2. By Flavor

        23.18.3. By Packaging Type

        23.18.4. By Product Format

        23.18.5. By Usage Format

        23.18.6. By Sales Channel

    23.19. Australia and New Zealand Market Value and Volume Analysis 2017 to 2021 and Forecast 2022 to 2032

        23.19.1. By Product Type

        23.19.2. By Flavor

        23.19.3. By Packaging Type

        23.19.4. By Product Format

        23.19.5. By Usage Format

        23.19.6. By Sales Channel

    23.20. ASEAN Countries Market Value and Volume Analysis 2017 to 2021 and Forecast 2022 to 2032

        23.20.1. By Product Type

        23.20.2. By Flavor

        23.20.3. By Packaging Type

        23.20.4. By Product Format

        23.20.5. By Usage Format

        23.20.6. By Sales Channel

24. Market Structure Analysis

    24.1. Company Dashboard

    24.2. Industry Structure Analysis by Tier of Companies, 2021E

        24.2.1. %  tier 1 market players

        24.2.2. %  tier 2 market players

        24.2.3. %  tier 3 market players

    24.3. Company Share Analysis of Top Players, 2021E

        24.3.1. By Product Type

        24.3.2. By Region

    24.4. Market Presence Analysis

        24.4.1. Regional Footprint of Players

        24.4.2. Product Footprint by Players

        24.4.3. Channel Footprint by Players

25. Competition Deep Dive (Tentative List)

    25.1. Campbell Soup Company

            25.1.1.1. Overview

            25.1.1.2. Product Portfolio

            25.1.1.3. Profitability by Market Segments

            25.1.1.4. Sales Footprint

            25.1.1.5. SWOT Analysis

            25.1.1.6. Strategy Overview

                25.1.1.6.1. Product Strategy

                25.1.1.6.2. Channel Strategy

    25.2. King Arthur Baking Company

            25.2.1.1. Overview

            25.2.1.2. Product Portfolio

            25.2.1.3. Profitability by Market Segments

            25.2.1.4. Sales Footprint

            25.2.1.5. SWOT Analysis

            25.2.1.6. Strategy Overview

                25.2.1.6.1. Product Strategy

                25.2.1.6.2. Channel Strategy

    25.3. Dylan's

            25.3.1.1. Overview

            25.3.1.2. Product Portfolio

            25.3.1.3. Profitability by Market Segments

            25.3.1.4. Sales Footprint

            25.3.1.5. SWOT Analysis

            25.3.1.6. Strategy Overview

                25.3.1.6.1. Product Strategy

                25.3.1.6.2. Channel Strategy

    25.4. Bear Creek® (B&G Foods, Inc.)

            25.4.1.1. Overview

            25.4.1.2. Product Portfolio

            25.4.1.3. Profitability by Market Segments

            25.4.1.4. Sales Footprint

            25.4.1.5. SWOT Analysis

            25.4.1.6. Strategy Overview

                25.4.1.6.1. Product Strategy

                25.4.1.6.2. Channel Strategy

    25.5. Idahoan Foods, LLC

            25.5.1.1. Overview

            25.5.1.2. Product Portfolio

            25.5.1.3. Profitability by Market Segments

            25.5.1.4. Sales Footprint

            25.5.1.5. SWOT Analysis

            25.5.1.6. Strategy Overview

                25.5.1.6.1. Product Strategy

                25.5.1.6.2. Channel Strategy

    25.6. Progresso (General Mills)

            25.6.1.1. Overview

            25.6.1.2. Product Portfolio

            25.6.1.3. Profitability by Market Segments

            25.6.1.4. Sales Footprint

            25.6.1.5. SWOT Analysis

            25.6.1.6. Strategy Overview

                25.6.1.6.1. Product Strategy

                25.6.1.6.2. Channel Strategy

    25.7. Amy's Kitchen, Inc.

            25.7.1.1. Overview

            25.7.1.2. Product Portfolio

            25.7.1.3. Profitability by Market Segments

            25.7.1.4. Sales Footprint

            25.7.1.5. SWOT Analysis

            25.7.1.6. Strategy Overview

                25.7.1.6.1. Product Strategy

                25.7.1.6.2. Channel Strategy

    25.8. Knorr (Unilever Plc)

            25.8.1.1. Overview

            25.8.1.2. Product Portfolio

            25.8.1.3. Profitability by Market Segments

            25.8.1.4. Sales Footprint

            25.8.1.5. SWOT Analysis

            25.8.1.6. Strategy Overview

                25.8.1.6.1. Product Strategy

                25.8.1.6.2. Channel Strategy

    25.9. The Real Soup Co.

            25.9.1.1. Overview

            25.9.1.2. Product Portfolio

            25.9.1.3. Profitability by Market Segments

            25.9.1.4. Sales Footprint

            25.9.1.5. SWOT Analysis

            25.9.1.6. Strategy Overview

                25.9.1.6.1. Product Strategy

                25.9.1.6.2. Channel Strategy

    25.10. Kettle Cuisine, LLC

            25.10.1.1. Overview

            25.10.1.2. Product Portfolio

            25.10.1.3. Profitability by Market Segments

            25.10.1.4. Sales Footprint

            25.10.1.5. SWOT Analysis

            25.10.1.6. Strategy Overview

                25.10.1.6.1. Product Strategy

                25.10.1.6.2. Channel Strategy

    25.11. Fresh Fayre (Fresh Direct Limited)

            25.11.1.1. Overview

            25.11.1.2. Product Portfolio

            25.11.1.3. Profitability by Market Segments

            25.11.1.4. Sales Footprint

            25.11.1.5. SWOT Analysis

            25.11.1.6. Strategy Overview

                25.11.1.6.1. Product Strategy

                25.11.1.6.2. Channel Strategy

    25.12. Panera Bread

            25.12.1.1. Overview

            25.12.1.2. Product Portfolio

            25.12.1.3. Profitability by Market Segments

            25.12.1.4. Sales Footprint

            25.12.1.5. SWOT Analysis

            25.12.1.6. Strategy Overview

                25.12.1.6.1. Product Strategy

                25.12.1.6.2. Channel Strategy

    25.13. Other Players (on Additional Request)

        25.13.1. Note: Above list is subject to change during the course of the study

26. Assumptions and Acronyms Used

27. Research Methodology

Don't pay for what you don't need

Customize your report by selecting specific countries or regions and save 30%!

List of Tables

Table 1: Global Market Value (USD Million) and Forecast by Region, 2017 to 2021

Table 2: Global Market Value (USD Million) and Forecast by Region, 2022 to 2032

Table 3: Global Market Volume (Units) and Forecast by Region, 2017 to 2021

Table 4: Global Market Volume (Units) and Forecast by Region, 2022 to 2032

Table 5: Global Market Value (USD Million) and Forecast by Product Type, 2017 to 2021

Table 6: Global Market Value (USD Million) and Forecast by Product Type, 2022 to 2032

Table 7: Global Market Volume (Units) and Forecast by Product Type, 2017 to 2021

Table 8: Global Market Volume (Units) and Forecast by Product Type, 2022 to 2032

Table 9: Global Market Value (USD Million) and Forecast by Flavor, 2017 to 2021

Table 10: Global Market Value (USD Million) and Forecast by Flavor, 2022 to 2032

Table 11: Global Market Volume (Units) and Forecast by Flavor, 2017 to 2021

Table 12: Global Market Volume (Units) and Forecast by Flavor, 2022 to 2032

Table 13: Global Market Value (USD Million) and Forecast by Packaging Type, 2017 to 2021

Table 14: Global Market Value (USD Million) and Forecast by Packaging Type, 2022 to 2032

Table 15: Global Market Volume (Units) and Forecast by Packaging Type, 2017 to 2021

Table 16: Global Market Volume (Units) and Forecast by Packaging Type, 2022 to 2032

Table 17: Global Market Value (USD Million) and Forecast by Product Format, 2017 to 2021

Table 18: Global Market Value (USD Million) and Forecast by Product Format, 2022 to 2032

Table 19: Global Market Volume (Units) and Forecast by Product Format, 2017 to 2021

Table 20: Global Market Volume (Units) and Forecast by Product Format, 2022 to 2032

Table 21: Global Market Value (USD Million) and Forecast by Usage Format, 2017 to 2021

Table 22: Global Market Value (USD Million) and Forecast by Usage Format, 2022 to 2032

Table 23: Global Market Volume (Units) and Forecast by Usage Format, 2017 to 2021

Table 24: Global Market Volume (Units) and Forecast by Usage Format, 2022 to 2032

Table 25: Global Market Value (USD Million) and Forecast by Sales Channel, 2017 to 2021

Table 26: Global Market Value (USD Million) and Forecast by Sales Channel, 2022 to 2032

Table 27: Global Market Volume (Units) and Forecast by Sales Channel, 2017 to 2021

Table 28: Global Market Volume (Units) and Forecast by Sales Channel, 2022 to 2032

Table 29: North America Market Value (USD Million) and Forecast by Country, 2017 to 2021

Table 30: North America Market Value (USD Million) and Forecast by Country, 2022 to 2032

Table 31: North America Market Volume (Units) and Forecast by Country, 2017 to 2021

Table 32: North America Market Volume (Units) and Forecast by Country, 2022 to 2032

Table 33: North America Market Value (USD Million) and Forecast by Product Type, 2017 to 2021

Table 34: North America Market Value (USD Million) and Forecast by Product Type, 2022 to 2032

Table 35: North America Market Volume (Units) and Forecast by Product Type, 2017 to 2021

Table 36: North America Market Volume (Units) and Forecast by Product Type, 2022 to 2032

Table 37: North America Market Value (USD Million) and Forecast by Flavor, 2017 to 2021

Table 38: North America Market Value (USD Million) and Forecast by Flavor, 2022 to 2032

Table 39: North America Market Volume (Units) and Forecast by Flavor, 2017 to 2021

Table 40: North America Market Volume (Units) and Forecast by Flavor, 2022 to 2032

Table 41: North America Market Value (USD Million) and Forecast by Packaging Type, 2017 to 2021

Table 42: North America Market Value (USD Million) and Forecast by Packaging Type, 2022 to 2032

Table 43: North America Market Volume (Units) and Forecast by Packaging Type, 2017 to 2021

Table 44: North America Market Volume (Units) and Forecast by Packaging Type, 2022 to 2032

Table 45: North America Market Value (USD Million) and Forecast by Product Format, 2017 to 2021

Table 46: North America Market Value (USD Million) and Forecast by Product Format, 2022 to 2032

Table 47: North America Market Volume (Units) and Forecast by Product Format, 2017 to 2021

Table 48: North America Market Volume (Units) and Forecast by Product Format, 2022 to 2032

Table 49: North America Market Value (USD Million) and Forecast by Usage Format, 2017 to 2021

Table 50: North America Market Value (USD Million) and Forecast by Usage Format, 2022 to 2032

Table 51: North America Market Volume (Units) and Forecast by Usage Format, 2017 to 2021

Table 52: North America Market Volume (Units) and Forecast by Usage Format, 2022 to 2032

Table 53: North America Market Value (USD Million) and Forecast by Sales Channel, 2017 to 2021

Table 54: North America Market Value (USD Million) and Forecast by Sales Channel, 2022 to 2032

Table 55: North America Market Volume (Units) and Forecast by Sales Channel, 2017 to 2021

Table 56: North America Market Volume (Units) and Forecast by Sales Channel, 2022 to 2032

Table 57: Latin America Market Value (USD Million) and Forecast by Country, 2017 to 2021

Table 58: Latin America Market Value (USD Million) and Forecast by Country, 2022 to 2032

Table 59: Latin America Market Volume (Units) and Forecast by Country, 2017 to 2021

Table 60: Latin America Market Volume (Units) and Forecast by Country, 2022 to 2032

Table 61: Latin America Market Value (USD Million) and Forecast by Product Type, 2017 to 2021

Table 62: Latin America Market Value (USD Million) and Forecast by Product Type, 2022 to 2032

Table 63: Latin America Market Volume (Units) and Forecast by Product Type, 2017 to 2021

Table 64: Latin America Market Volume (Units) and Forecast by Product Type, 2022 to 2032

Table 65: Latin America Market Value (USD Million) and Forecast by Flavor, 2017 to 2021

Table 66: Latin America Market Value (USD Million) and Forecast by Flavor, 2022 to 2032

Table 67: Latin America Market Volume (Units) and Forecast by Flavor, 2017 to 2021

Table 68: Latin America Market Volume (Units) and Forecast by Flavor, 2022 to 2032

Table 69: Latin America Market Value (USD Million) and Forecast by Packaging Type, 2017 to 2021

Table 70: Latin America Market Value (USD Million) and Forecast by Packaging Type, 2022 to 2032

Table 71: Latin America Market Volume (Units) and Forecast by Packaging Type, 2017 to 2021

Table 72: Latin America Market Volume (Units) and Forecast by Packaging Type, 2022 to 2032

Table 73: Latin America Market Value (USD Million) and Forecast by Product Format, 2017 to 2021

Table 74: Latin America Market Value (USD Million) and Forecast by Product Format, 2022 to 2032

Table 75: Latin America Market Volume (Units) and Forecast by Product Format, 2017 to 2021

Table 76: Latin America Market Volume (Units) and Forecast by Product Format, 2022 to 2032

Table 77: Latin America Market Value (USD Million) and Forecast by Usage Format, 2017 to 2021

Table 78: Latin America Market Value (USD Million) and Forecast by Usage Format, 2022 to 2032

Table 79: Latin America Market Volume (Units) and Forecast by Usage Format, 2017 to 2021

Table 80: Latin America Market Volume (Units) and Forecast by Usage Format, 2022 to 2032

Table 81: Latin America Market Value (USD Million) and Forecast by Sales Channel, 2017 to 2021

Table 82: Latin America Market Value (USD Million) and Forecast by Sales Channel, 2022 to 2032

Table 83: Latin America Market Volume (Units) and Forecast by Sales Channel, 2017 to 2021

Table 84: Latin America Market Volume (Units) and Forecast by Sales Channel, 2022 to 2032

Table 85: Europe Market Value (USD Million) and Forecast by Country, 2017 to 2021

Table 86: Europe Market Value (USD Million) and Forecast by Country, 2022 to 2032

Table 87: Europe Market Volume (Units) and Forecast by Country, 2017 to 2021

Table 88: Europe Market Volume (Units) and Forecast by Country, 2022 to 2032

Table 89: Europe Market Value (USD Million) and Forecast by Product Type, 2017 to 2021

Table 90: Europe Market Value (USD Million) and Forecast by Product Type, 2022 to 2032

Table 91: Europe Market Volume (Units) and Forecast by Product Type, 2017 to 2021

Table 92: Europe Market Volume (Units) and Forecast by Product Type, 2022 to 2032

Table 93: Europe Market Value (USD Million) and Forecast by Flavor, 2017 to 2021

Table 94: Europe Market Value (USD Million) and Forecast by Flavor, 2022 to 2032

Table 95: Europe Market Volume (Units) and Forecast by Flavor, 2017 to 2021

Table 96: Europe Market Volume (Units) and Forecast by Flavor, 2022 to 2032

Table 97: Europe Market Value (USD Million) and Forecast by Packaging Type, 2017 to 2021

Table 98: Europe Market Value (USD Million) and Forecast by Packaging Type, 2022 to 2032

Table 99: Europe Market Volume (Units) and Forecast by Packaging Type, 2017 to 2021

Table 100: Europe Market Volume (Units) and Forecast by Packaging Type, 2022 to 2032

Table 101: Europe Market Value (USD Million) and Forecast by Product Format, 2017 to 2021

Table 102: Europe Market Value (USD Million) and Forecast by Product Format, 2022 to 2032

Table 103: Europe Market Volume (Units) and Forecast by Product Format, 2017 to 2021

Table 104: Europe Market Volume (Units) and Forecast by Product Format, 2022 to 2032

Table 105: Europe Market Value (USD Million) and Forecast by Usage Format, 2017 to 2021

Table 106: Europe Market Value (USD Million) and Forecast by Usage Format, 2022 to 2032

Table 107: Europe Market Volume (Units) and Forecast by Usage Format, 2017 to 2021

Table 108: Europe Market Volume (Units) and Forecast by Usage Format, 2022 to 2032

Table 109: Europe Market Value (USD Million) and Forecast by Sales Channel, 2017 to 2021

Table 110: Europe Market Value (USD Million) and Forecast by Sales Channel, 2022 to 2032

Table 111: Europe Market Volume (Units) and Forecast by Sales Channel, 2017 to 2021

Table 112: Europe Market Volume (Units) and Forecast by Sales Channel, 2022 to 2032

Table 113: East Asia Market Value (USD Million) and Forecast by Country, 2017 to 2021

Table 114: East Asia Market Value (USD Million) and Forecast by Country, 2022 to 2032

Table 115: East Asia Market Volume (Units) and Forecast by Country, 2017 to 2021

Table 116: East Asia Market Volume (Units) and Forecast by Country, 2022 to 2032

Table 117: East Asia Market Value (USD Million) and Forecast by Product Type, 2017 to 2021

Table 118: East Asia Market Value (USD Million) and Forecast by Product Type, 2022 to 2032

Table 119: East Asia Market Volume (Units) and Forecast by Product Type, 2017 to 2021

Table 120: East Asia Market Volume (Units) and Forecast by Product Type, 2022 to 2032

Table 121: East Asia Market Value (USD Million) and Forecast by Flavor, 2017 to 2021

Table 122: East Asia Market Value (USD Million) and Forecast by Flavor, 2022 to 2032

Table 123: East Asia Market Volume (Units) and Forecast by Flavor, 2017 to 2021

Table 124: East Asia Market Volume (Units) and Forecast by Flavor, 2022 to 2032

Table 125: East Asia Market Value (USD Million) and Forecast by Packaging Type, 2017 to 2021

Table 126: East Asia Market Value (USD Million) and Forecast by Packaging Type, 2022 to 2032

Table 127: East Asia Market Volume (Units) and Forecast by Packaging Type, 2017 to 2021

Table 128: East Asia Market Volume (Units) and Forecast by Packaging Type, 2022 to 2032

Table 129: East Asia Market Value (USD Million) and Forecast by Product Format, 2017 to 2021

Table 130: East Asia Market Value (USD Million) and Forecast by Product Format, 2022 to 2032

Table 131: East Asia Market Volume (Units) and Forecast by Product Format, 2017 to 2021

Table 132: East Asia Market Volume (Units) and Forecast by Product Format, 2022 to 2032

Table 133: East Asia Market Value (USD Million) and Forecast by Usage Format, 2017 to 2021

Table 134: East Asia Market Value (USD Million) and Forecast by Usage Format, 2022 to 2032

Table 135: East Asia Market Volume (Units) and Forecast by Usage Format, 2017 to 2021

Table 136: East Asia Market Volume (Units) and Forecast by Usage Format, 2022 to 2032

Table 137: East Asia Market Value (USD Million) and Forecast by Sales Channel, 2017 to 2021

Table 138: East Asia Market Value (USD Million) and Forecast by Sales Channel, 2022 to 2032

Table 139: East Asia Market Volume (Units) and Forecast by Sales Channel, 2017 to 2021

Table 140: East Asia Market Volume (Units) and Forecast by Sales Channel, 2022 to 2032

Table 141: South Asia Market Value (USD Million) and Forecast by Country, 2017 to 2021

Table 142: South Asia Market Value (USD Million) and Forecast by Country, 2022 to 2032

Table 143: South Asia Market Volume (Units) and Forecast by Country, 2017 to 2021

Table 144: South Asia Market Volume (Units) and Forecast by Country, 2022 to 2032

Table 145: South Asia Market Value (USD Million) and Forecast by Product Type, 2017 to 2021

Table 146: South Asia Market Value (USD Million) and Forecast by Product Type, 2022 to 2032

Table 147: South Asia Market Volume (Units) and Forecast by Product Type, 2017 to 2021

Table 148: South Asia Market Volume (Units) and Forecast by Product Type, 2022 to 2032

Table 149: South Asia Market Value (USD Million) and Forecast by Flavor, 2017 to 2021

Table 150: South Asia Market Value (USD Million) and Forecast by Flavor, 2022 to 2032

Table 151: South Asia Market Volume (Units) and Forecast by Flavor, 2017 to 2021

Table 152: South Asia Market Volume (Units) and Forecast by Flavor, 2022 to 2032

Table 153: South Asia Market Value (USD Million) and Forecast by Packaging Type, 2017 to 2021

Table 154: South Asia Market Value (USD Million) and Forecast by Packaging Type, 2022 to 2032

Table 155: South Asia Market Volume (Units) and Forecast by Packaging Type, 2017 to 2021

Table 156: South Asia Market Volume (Units) and Forecast by Packaging Type, 2022 to 2032

Table 157: South Asia Market Value (USD Million) and Forecast by Product Format, 2017 to 2021

Table 158: South Asia Market Value (USD Million) and Forecast by Product Format, 2022 to 2032

Table 159: South Asia Market Volume (Units) and Forecast by Product Format, 2017 to 2021

Table 160: South Asia Market Volume (Units) and Forecast by Product Format, 2022 to 2032

Table 161: South Asia Market Value (USD Million) and Forecast by Usage Format, 2017 to 2021

Table 162: South Asia Market Value (USD Million) and Forecast by Usage Format, 2022 to 2032

Table 163: South Asia Market Volume (Units) and Forecast by Usage Format, 2017 to 2021

Table 164: South Asia Market Volume (Units) and Forecast by Usage Format, 2022 to 2032

Table 165: South Asia Market Value (USD Million) and Forecast by Sales Channel, 2017 to 2021

Table 166: South Asia Market Value (USD Million) and Forecast by Sales Channel, 2022 to 2032

Table 167: South Asia Market Volume (Units) and Forecast by Sales Channel, 2017 to 2021

Table 168: South Asia Market Volume (Units) and Forecast by Sales Channel, 2022 to 2032

Table 169: Oceania Market Value (USD Million) and Forecast by Country, 2017 to 2021

Table 170: Oceania Market Value (USD Million) and Forecast by Country, 2022 to 2032

Table 171: Oceania Market Volume (Units) and Forecast by Country, 2017 to 2021

Table 172: Oceania Market Volume (Units) and Forecast by Country, 2022 to 2032

Table 173: Oceania Market Value (USD Million) and Forecast by Product Type, 2017 to 2021

Table 174: Oceania Market Value (USD Million) and Forecast by Product Type, 2022 to 2032

Table 175: Oceania Market Volume (Units) and Forecast by Product Type, 2017 to 2021

Table 176: Oceania Market Volume (Units) and Forecast by Product Type, 2022 to 2032

Table 177: Oceania Market Value (USD Million) and Forecast by Flavor, 2017 to 2021

Table 178: Oceania Market Value (USD Million) and Forecast by Flavor, 2022 to 2032

Table 179: Oceania Market Volume (Units) and Forecast by Flavor, 2017 to 2021

Table 180: Oceania Market Volume (Units) and Forecast by Flavor, 2022 to 2032

Table 181: Oceania Market Value (USD Million) and Forecast by Packaging Type, 2017 to 2021

Table 182: Oceania Market Value (USD Million) and Forecast by Packaging Type, 2022 to 2032

Table 183: Oceania Market Volume (Units) and Forecast by Packaging Type, 2017 to 2021

Table 184: Oceania Market Volume (Units) and Forecast by Packaging Type, 2022 to 2032

Table 185: Oceania Market Value (USD Million) and Forecast by Product Format, 2017 to 2021

Table 186: Oceania Market Value (USD Million) and Forecast by Product Format, 2022 to 2032

Table 187: Oceania Market Volume (Units) and Forecast by Product Format, 2017 to 2021

Table 188: Oceania Market Volume (Units) and Forecast by Product Format, 2022 to 2032

Table 189: Oceania Market Value (USD Million) and Forecast by Usage Format, 2017 to 2021

Table 190: Oceania Market Value (USD Million) and Forecast by Usage Format, 2022 to 2032

Table 191: Oceania Market Volume (Units) and Forecast by Usage Format, 2017 to 2021

Table 192: Oceania Market Volume (Units) and Forecast by Usage Format, 2022 to 2032

Table 193: Oceania Market Value (USD Million) and Forecast by Sales Channel, 2017 to 2021

Table 194: Oceania Market Value (USD Million) and Forecast by Sales Channel, 2022 to 2032

Table 195: Oceania Market Volume (Units) and Forecast by Sales Channel, 2017 to 2021

Table 196: Oceania Market Volume (Units) and Forecast by Sales Channel, 2022 to 2032

Table 197: MEA Market Value (USD Million) and Forecast by Country, 2017 to 2021

Table 198: MEA Market Value (USD Million) and Forecast by Country, 2022 to 2032

Table 199: MEA Market Volume (Units) and Forecast by Country, 2017 to 2021

Table 200: MEA Market Volume (Units) and Forecast by Country, 2022 to 2032

Table 201: MEA Market Value (USD Million) and Forecast by Product Type, 2017 to 2021

Table 202: MEA Market Value (USD Million) and Forecast by Product Type, 2022 to 2032

Table 203: MEA Market Volume (Units) and Forecast by Product Type, 2017 to 2021

Table 204: MEA Market Volume (Units) and Forecast by Product Type, 2022 to 2032

Table 205: MEA Market Value (USD Million) and Forecast by Flavor, 2017 to 2021

Table 206: MEA Market Value (USD Million) and Forecast by Flavor, 2022 to 2032

Table 207: MEA Market Volume (Units) and Forecast by Flavor, 2017 to 2021

Table 208: MEA Market Volume (Units) and Forecast by Flavor, 2022 to 2032

Table 209: MEA Market Value (USD Million) and Forecast by Packaging Type, 2017 to 2021

Table 210: MEA Market Value (USD Million) and Forecast by Packaging Type, 2022 to 2032

Table 211: MEA Market Volume (Units) and Forecast by Packaging Type, 2017 to 2021

Table 212: MEA Market Volume (Units) and Forecast by Packaging Type, 2022 to 2032

Table 213: MEA Market Value (USD Million) and Forecast by Product Format, 2017 to 2021

Table 214: MEA Market Value (USD Million) and Forecast by Product Format, 2022 to 2032

Table 215: MEA Market Volume (Units) and Forecast by Product Format, 2017 to 2021

Table 216: MEA Market Volume (Units) and Forecast by Product Format, 2022 to 2032

Table 217: MEA Market Value (USD Million) and Forecast by Usage Format, 2017 to 2021

Table 218: MEA Market Value (USD Million) and Forecast by Usage Format, 2022 to 2032

Table 219: MEA Market Volume (Units) and Forecast by Usage Format, 2017 to 2021

Table 220: MEA Market Volume (Units) and Forecast by Usage Format, 2022 to 2032

Table 221: MEA Market Value (USD Million) and Forecast by Sales Channel, 2017 to 2021

Table 222: MEA Market Value (USD Million) and Forecast by Sales Channel, 2022 to 2032

Table 223: MEA Market Volume (Units) and Forecast by Sales Channel, 2017 to 2021

Table 224: MEA Market Volume (Units) and Forecast by Sales Channel, 2022 to 2032
Nandini Roy Choudhury

Principal Consultant

Talk to Analyst

Find your sweet spots for generating winning opportunities in this market.

List of Charts

Figure 1: Global Market Value Share (%) and BPS Analysis by Region, 2017 & 2022 & 2032

Figure 2: Global Market Y-o-Y Analysis by Region, 2022 to 2032

Figure 3: Global Market Attractiveness, by Region, 2022 to 2032

Figure 4: Global Market Value Share (%) and BPS Analysis by Product Type, 2017 & 2022 & 2032

Figure 5: Global Market Y-o-Y Analysis by Product Type, 2022 to 2032

Figure 6: Global Market Attractiveness, by Product Type, 2022 to 2032

Figure 7: Global Market Value Share (%) and BPS Analysis by Flavor, 2017 & 2022 & 2032

Figure 8: Global Market Y-o-Y Analysis by Flavor, 2022 to 2032

Figure 9: Global Market Attractiveness, by Flavor, 2022 to 2032

Figure 10: Global Market Value Share (%) and BPS Analysis by Packaging Type, 2017 & 2022 & 2032

Figure 11: Global Market Y-o-Y Analysis by Packaging Type, 2022 to 2032

Figure 12: Global Market Attractiveness, by Packaging Type, 2022 to 2032

Figure 13: Global Market Value Share (%) and BPS Analysis by Product Format, 2017 & 2022 & 2032

Figure 14: Global Market Y-o-Y Analysis by Product Format, 2022 to 2032

Figure 15: Global Market Attractiveness, by Product Format, 2022 to 2032

Figure 16: Global Market Value Share (%) and BPS Analysis by Usage Format, 2017 & 2022 & 2032

Figure 17: Global Market Y-o-Y Analysis by Usage Format, 2022 to 2032

Figure 18: Global Market Attractiveness, by Usage Format, 2022 to 2032

Figure 19: Global Market Value Share (%) and BPS Analysis by Sales Channel, 2017 & 2022 & 2032

Figure 20: Global Market Y-o-Y Analysis by Sales Channel, 2022 to 2032

Figure 21: Global Market Attractiveness, by Sales Channel, 2022 to 2032

Figure 22: North America Market Value Share (%) and BPS Analysis by Country, 2017 & 2022 & 2032

Figure 23: North America Market Y-o-Y Analysis by Country, 2022 to 2032

Figure 24: North America Market Attractiveness, by Country, 2022 to 2032

Figure 25: North America Market Value Share (%) and BPS Analysis by Product Type, 2017 & 2022 & 2032

Figure 26: North America Market Y-o-Y Analysis by Product Type, 2022 to 2032

Figure 27: North America Market Attractiveness, by Product Type, 2022 to 2032

Figure 28: North America Market Value Share (%) and BPS Analysis by Flavor, 2017 & 2022 & 2032

Figure 29: North America Market Y-o-Y Analysis by Flavor, 2022 to 2032

Figure 30: North America Market Attractiveness, by Flavor, 2022 to 2032

Figure 31: North America Market Value Share (%) and BPS Analysis by Packaging Type, 2017 & 2022 & 2032

Figure 32: North America Market Y-o-Y Analysis by Packaging Type, 2022 to 2032

Figure 33: North America Market Attractiveness, by Packaging Type, 2022 to 2032

Figure 34: North America Market Value Share (%) and BPS Analysis by Product Format, 2017 & 2022 & 2032

Figure 35: North America Market Y-o-Y Analysis by Product Format, 2022 to 2032

Figure 36: North America Market Attractiveness, by Product Format, 2022 to 2032

Figure 37: North America Market Value Share (%) and BPS Analysis by Usage Format, 2017 & 2022 & 2032

Figure 38: North America Market Y-o-Y Analysis by Usage Format, 2022 to 2032

Figure 39: North America Market Attractiveness, by Usage Format, 2022 to 2032

Figure 40: North America Market Value Share (%) and BPS Analysis by Sales Channel, 2017 & 2022 & 2032

Figure 41: North America Market Y-o-Y Analysis by Sales Channel, 2022 to 2032

Figure 42: North America Market Attractiveness, by Sales Channel, 2022 to 2032

Figure 43: Latin America Market Value Share (%) and BPS Analysis by Country, 2017 & 2022 & 2032

Figure 44: Latin America Market Y-o-Y Analysis by Country, 2022 to 2032

Figure 45: Latin America Market Attractiveness, by Country, 2022 to 2032

Figure 46: Latin America Market Value Share (%) and BPS Analysis by Product Type, 2017 & 2022 & 2032

Figure 47: Latin America Market Y-o-Y Analysis by Product Type, 2022 to 2032

Figure 48: Latin America Market Attractiveness, by Product Type, 2022 to 2032

Figure 49: Latin America Market Value Share (%) and BPS Analysis by Flavor, 2017 & 2022 & 2032

Figure 50: Latin America Market Y-o-Y Analysis by Flavor, 2022 to 2032

Figure 51: Latin America Market Attractiveness, by Flavor, 2022 to 2032

Figure 52: Latin America Market Value Share (%) and BPS Analysis by Packaging Type, 2017 & 2022 & 2032

Figure 53: Latin America Market Y-o-Y Analysis by Packaging Type, 2022 to 2032

Figure 54: Latin America Market Attractiveness, by Packaging Type, 2022 to 2032

Figure 55: Latin America Market Value Share (%) and BPS Analysis by Product Format, 2017 & 2022 & 2032

Figure 56: Latin America Market Y-o-Y Analysis by Product Format, 2022 to 2032

Figure 57: Latin America Market Attractiveness, by Product Format, 2022 to 2032

Figure 58: Latin America Market Value Share (%) and BPS Analysis by Usage Format, 2017 & 2022 & 2032

Figure 59: Latin America Market Y-o-Y Analysis by Usage Format, 2022 to 2032

Figure 60: Latin America Market Attractiveness, by Usage Format, 2022 to 2032

Figure 61: Latin America Market Value Share (%) and BPS Analysis by Sales Channel, 2017 & 2022 & 2032

Figure 62: Latin America Market Y-o-Y Analysis by Sales Channel, 2022 to 2032

Figure 63: Latin America Market Attractiveness, by Sales Channel, 2022 to 2032

Figure 64: Europe Market Value Share (%) and BPS Analysis by Country, 2017 & 2022 & 2032

Figure 65: Europe Market Y-o-Y Analysis by Country, 2022 to 2032

Figure 66: Europe Market Attractiveness, by Country, 2022 to 2032

Figure 67: Europe Market Value Share (%) and BPS Analysis by Product Type, 2017 & 2022 & 2032

Figure 68: Europe Market Y-o-Y Analysis by Product Type, 2022 to 2032

Figure 69: Europe Market Attractiveness, by Product Type, 2022 to 2032

Figure 70: Europe Market Value Share (%) and BPS Analysis by Flavor, 2017 & 2022 & 2032

Figure 71: Europe Market Y-o-Y Analysis by Flavor, 2022 to 2032

Figure 72: Europe Market Attractiveness, by Flavor, 2022 to 2032

Figure 73: Europe Market Value Share (%) and BPS Analysis by Packaging Type, 2017 & 2022 & 2032

Figure 74: Europe Market Y-o-Y Analysis by Packaging Type, 2022 to 2032

Figure 75: Europe Market Attractiveness, by Packaging Type, 2022 to 2032

Figure 76: Europe Market Value Share (%) and BPS Analysis by Product Format, 2017 & 2022 & 2032

Figure 77: Europe Market Y-o-Y Analysis by Product Format, 2022 to 2032

Figure 78: Europe Market Attractiveness, by Product Format, 2022 to 2032

Figure 79: Europe Market Value Share (%) and BPS Analysis by Usage Format, 2017 & 2022 & 2032

Figure 80: Europe Market Y-o-Y Analysis by Usage Format, 2022 to 2032

Figure 81: Europe Market Attractiveness, by Usage Format, 2022 to 2032

Figure 82: Europe Market Value Share (%) and BPS Analysis by Sales Channel, 2017 & 2022 & 2032

Figure 83: Europe Market Y-o-Y Analysis by Sales Channel, 2022 to 2032

Figure 84: Europe Market Attractiveness, by Sales Channel, 2022 to 2032

Figure 85: East Asia Market Value Share (%) and BPS Analysis by Country, 2017 & 2022 & 2032

Figure 86: East Asia Market Y-o-Y Analysis by Country, 2022 to 2032

Figure 87: East Asia Market Attractiveness, by Country, 2022 to 2032

Figure 88: East Asia Market Value Share (%) and BPS Analysis by Product Type, 2017 & 2022 & 2032

Figure 89: East Asia Market Y-o-Y Analysis by Product Type, 2022 to 2032

Figure 90: East Asia Market Attractiveness, by Product Type, 2022 to 2032

Figure 91: East Asia Market Value Share (%) and BPS Analysis by Flavor, 2017 & 2022 & 2032

Figure 92: East Asia Market Y-o-Y Analysis by Flavor, 2022 to 2032

Figure 93: East Asia Market Attractiveness, by Flavor, 2022 to 2032

Figure 94: East Asia Market Value Share (%) and BPS Analysis by Packaging Type, 2017 & 2022 & 2032

Figure 95: East Asia Market Y-o-Y Analysis by Packaging Type, 2022 to 2032

Figure 96: East Asia Market Attractiveness, by Packaging Type, 2022 to 2032

Figure 97: East Asia Market Value Share (%) and BPS Analysis by Product Format, 2017 & 2022 & 2032

Figure 98: East Asia Market Y-o-Y Analysis by Product Format, 2022 to 2032

Figure 99: East Asia Market Attractiveness, by Product Format, 2022 to 2032

Figure 100: East Asia Market Value Share (%) and BPS Analysis by Usage Format, 2017 & 2022 & 2032

Figure 101: East Asia Market Y-o-Y Analysis by Usage Format, 2022 to 2032

Figure 102: East Asia Market Attractiveness, by Usage Format, 2022 to 2032

Figure 103: East Asia Market Value Share (%) and BPS Analysis by Sales Channel, 2017 & 2022 & 2032

Figure 104: East Asia Market Y-o-Y Analysis by Sales Channel, 2022 to 2032

Figure 105: East Asia Market Attractiveness, by Sales Channel, 2022 to 2032

Figure 106: South Asia Market Value Share (%) and BPS Analysis by Country, 2017 & 2022 & 2032

Figure 107: South Asia Market Y-o-Y Analysis by Country, 2022 to 2032

Figure 108: South Asia Market Attractiveness, by Country, 2022 to 2032

Figure 109: South Asia Market Value Share (%) and BPS Analysis by Product Type, 2017 & 2022 & 2032

Figure 110: South Asia Market Y-o-Y Analysis by Product Type, 2022 to 2032

Figure 111: South Asia Market Attractiveness, by Product Type, 2022 to 2032

Figure 112: South Asia Market Value Share (%) and BPS Analysis by Flavor, 2017 & 2022 & 2032

Figure 113: South Asia Market Y-o-Y Analysis by Flavor, 2022 to 2032

Figure 114: South Asia Market Attractiveness, by Flavor, 2022 to 2032

Figure 115: South Asia Market Value Share (%) and BPS Analysis by Packaging Type, 2017 & 2022 & 2032

Figure 116: South Asia Market Y-o-Y Analysis by Packaging Type, 2022 to 2032

Figure 117: South Asia Market Attractiveness, by Packaging Type, 2022 to 2032

Figure 118: South Asia Market Value Share (%) and BPS Analysis by Product Format, 2017 & 2022 & 2032

Figure 119: South Asia Market Y-o-Y Analysis by Product Format, 2022 to 2032

Figure 120: South Asia Market Attractiveness, by Product Format, 2022 to 2032

Figure 121: South Asia Market Value Share (%) and BPS Analysis by Usage Format, 2017 & 2022 & 2032

Figure 122: South Asia Market Y-o-Y Analysis by Usage Format, 2022 to 2032

Figure 123: South Asia Market Attractiveness, by Usage Format, 2022 to 2032

Figure 124: South Asia Market Value Share (%) and BPS Analysis by Sales Channel, 2017 & 2022 & 2032

Figure 125: South Asia Market Y-o-Y Analysis by Sales Channel, 2022 to 2032

Figure 126: South Asia Market Attractiveness, by Sales Channel, 2022 to 2032

Figure 127: Oceania Market Value Share (%) and BPS Analysis by Country, 2017 & 2022 & 2032

Figure 128: Oceania Market Y-o-Y Analysis by Country, 2022 to 2032

Figure 129: Oceania Market Attractiveness, by Country, 2022 to 2032

Figure 130: Oceania Market Value Share (%) and BPS Analysis by Product Type, 2017 & 2022 & 2032

Figure 131: Oceania Market Y-o-Y Analysis by Product Type, 2022 to 2032

Figure 132: Oceania Market Attractiveness, by Product Type, 2022 to 2032

Figure 133: Oceania Market Value Share (%) and BPS Analysis by Flavor, 2017 & 2022 & 2032

Figure 134: Oceania Market Y-o-Y Analysis by Flavor, 2022 to 2032

Figure 135: Oceania Market Attractiveness, by Flavor, 2022 to 2032

Figure 136: Oceania Market Value Share (%) and BPS Analysis by Packaging Type, 2017 & 2022 & 2032

Figure 137: Oceania Market Y-o-Y Analysis by Packaging Type, 2022 to 2032

Figure 138: Oceania Market Attractiveness, by Packaging Type, 2022 to 2032

Figure 139: Oceania Market Value Share (%) and BPS Analysis by Product Format, 2017 & 2022 & 2032

Figure 140: Oceania Market Y-o-Y Analysis by Product Format, 2022 to 2032

Figure 141: Oceania Market Attractiveness, by Product Format, 2022 to 2032

Figure 142: Oceania Market Value Share (%) and BPS Analysis by Usage Format, 2017 & 2022 & 2032

Figure 143: Oceania Market Y-o-Y Analysis by Usage Format, 2022 to 2032

Figure 144: Oceania Market Attractiveness, by Usage Format, 2022 to 2032

Figure 145: Oceania Market Value Share (%) and BPS Analysis by Sales Channel, 2017 & 2022 & 2032

Figure 146: Oceania Market Y-o-Y Analysis by Sales Channel, 2022 to 2032

Figure 147: Oceania Market Attractiveness, by Sales Channel, 2022 to 2032

Figure 148: MEA Market Value Share (%) and BPS Analysis by Country, 2017 & 2022 & 2032

Figure 149: MEA Market Y-o-Y Analysis by Country, 2022 to 2032

Figure 150: MEA Market Attractiveness, by Country, 2022 to 2032

Figure 151: MEA Market Value Share (%) and BPS Analysis by Product Type, 2017 & 2022 & 2032

Figure 152: MEA Market Y-o-Y Analysis by Product Type, 2022 to 2032

Figure 153: MEA Market Attractiveness, by Product Type, 2022 to 2032

Figure 154: MEA Market Value Share (%) and BPS Analysis by Flavor, 2017 & 2022 & 2032

Figure 155: MEA Market Y-o-Y Analysis by Flavor, 2022 to 2032

Figure 156: MEA Market Attractiveness, by Flavor, 2022 to 2032

Figure 157: MEA Market Value Share (%) and BPS Analysis by Packaging Type, 2017 & 2022 & 2032

Figure 158: MEA Market Y-o-Y Analysis by Packaging Type, 2022 to 2032

Figure 159: MEA Market Attractiveness, by Packaging Type, 2022 to 2032

Figure 160: MEA Market Value Share (%) and BPS Analysis by Product Format, 2017 & 2022 & 2032

Figure 161: MEA Market Y-o-Y Analysis by Product Format, 2022 to 2032

Figure 162: MEA Market Attractiveness, by Product Format, 2022 to 2032

Figure 163: MEA Market Value Share (%) and BPS Analysis by Usage Format, 2017 & 2022 & 2032

Figure 164: MEA Market Y-o-Y Analysis by Usage Format, 2022 to 2032

Figure 165: MEA Market Attractiveness, by Usage Format, 2022 to 2032

Figure 166: MEA Market Value Share (%) and BPS Analysis by Sales Channel, 2017 & 2022 & 2032

Figure 167: MEA Market Y-o-Y Analysis by Sales Channel, 2022 to 2032

Figure 168: MEA Market Attractiveness, by Sales Channel, 2022 to 2032

Recommendations

Food and Beverage

Dried Soup Market

Published : July 2023

Food and Beverage

Gluten-Free Soup Market

Published : May 2023

Food and Beverage

Frozen Potato Market

Published : May 2023

Food and Beverage

Sweet Potato Fly Market

Published : March 2022

Explore Food and Beverage Insights

View Reports