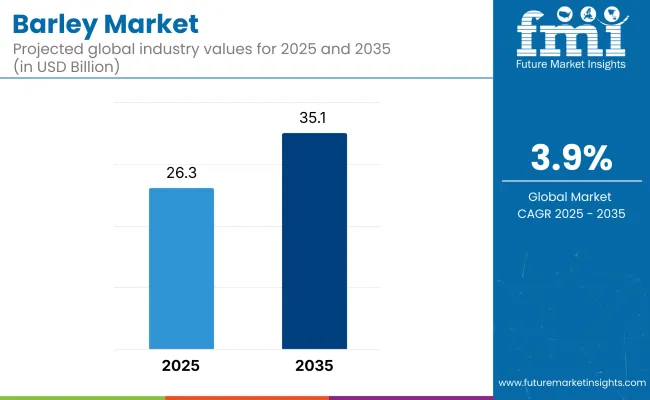
The global barley market is estimated to be worth USD 26.3 billion by 2025 and is projected to reach a value of USD 35.1 billion by 2035, reflecting a CAGR of 3.9% over the assessment period 2025 to 2035.
| Metrics | Values |
|---|---|
| Industry Size (2025E) | USD 26.3 billion |
| Industry Value (2035F) | USD 35.1 billion |
| CAGR (2025 to 2035) | 3.9% |
Growth across the barley sector is being fueled by its indispensable role in both feed and food chains, underpinned by its fiber-rich profile, fermentable characteristics, and agronomic versatility. Barley’s high adaptability to varying climatic conditions and its low input cost requirements have long positioned it as a favorable cereal crop globally.
The increasing demand for feed-grade barley-expected to account for 42.3% of market share in 2025-continues to be influenced by the growing scale of animal husbandry and livestock-based industries, where it serves as a key nutritional grain source due to its balanced energy-to-protein ratio and digestibility.
Over the next decade, market expansion is expected to be further driven by the rising adoption of barley in brewing, particularly malted barley, which remains a critical ingredient in beer production. Changing consumer preferences towards craft and specialty beers, along with innovation in malt-based beverages, have opened new opportunities in this segment.
Meanwhile, barley is increasingly utilized in the functional food sector, particularly in whole grain and high-fiber formulations aligned with clean-label and health-focused trends. The growing awareness of beta-glucan, a soluble fiber found in barley known for its cholesterol-lowering effects, is influencing consumer interest and manufacturer incorporation into cereals, snack bars, and bakery products.
Regionally, Europe continues to dominate production and processing due to favorable climate, technological advancement in agriculture, and the presence of key players such as Soufflet Group and Axéréal. Additionally, countries such as Australia and Canada have emerged as key exporters, strengthening global supply chains. Market participants are increasingly investing in sustainability-led barley sourcing, traceability systems, and barley breeding programs targeting climate resilience and yield stability.
According to industry disclosures, Soufflet has emphasized its commitment to sustainable barley sourcing to meet evolving maltster and brewer expectations between 2023 and 2025. This aligns with regulatory pressure and consumer scrutiny around agricultural sustainability practices, ensuring that barley continues to play a significant role in future food, beverage, and feed ecosystems.
The table below presents a comparative assessment of the variation in CAGR over six months for the base year (2024) and the current year (2025) in the global industry. This analysis highlights key shifts in industry performance, providing stakeholders with a clearer view of the growth trajectory. The first half of the year, or H1, spans from January to June, while the second half, H2, includes July to December.
| Particular | Value CAGR |
|---|---|
| H1 2024 | 3.0% (2024 to 2034) |
| H2 2024 | 3.1% (2024 to 2034) |
| H1 2025 | 3.2% (2025 to 2035) |
| H2 2025 | 3.3% (2025 to 2035) |
The above table presents the expected CAGR for the global industry over a semi-annual period spanning from 2024 to 2035. In H1 2024, the business is projected to grow at a CAGR of 3.0%, followed by a slight increase to 3.1% in H2 2024. Moving into 2025, the CAGR is expected to rise to 3.2% in H1 and maintain a steady increase to 3.3% in H2.
In H1 2025, the industry witnessed an increase of 2 BPS, while in H2 2025, the industry observed a rise of 3 BPS, indicating a consistent upward trend. These variations suggest strong industry stability, driven by sustainable product farming initiatives, increasing demand for malted product in brewing and functional food applications, and advancements in climate-resistant product strains ensuring long-term productivity.
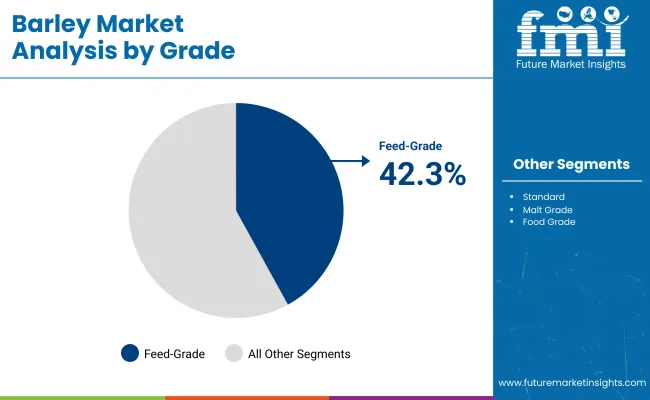
Feed-grade barley accounted for approximately 42.3% of the global market share in 2025 and is anticipated to witness a steady CAGR of around 3.6% through 2035. Its nutritional value, particularly its fermentable fiber and moderate protein profile, continues to reinforce its strategic importance across ruminant, swine, and poultry diets.
Demand from large-scale commercial farming operations and integrated livestock producers remains elevated, especially in regions where feed cost optimization and gut health modulation are prioritized.
The segment is expected to maintain dominance due to barley’s functional attributes such as rumen-friendly starch availability, enzyme interaction benefits, and positive impact on livestock performance outcomes.
Amid volatile corn and wheat prices, barley is increasingly positioned as a resilient alternative, particularly in temperate regions with abundant local production. Strategic feed formulation practices are expected to further integrate barley in compound mixes, particularly in sustainable or antibiotic-reduction-focused systems.
Additionally, government-backed cereal subsidies and feed security programs across Europe and parts of Asia are poised to support long-term feed-grade barley utilization. With animal protein consumption forecasted to rise globally, this segment’s contribution to nutritional stability, herd productivity, and regional feed independence is likely to be reinforced in the years ahead.
Malted barley is projected to grow at a CAGR of 4.1% between 2025 and 2035, gaining momentum from sustained demand in brewing and distilling applications. While accounting for a smaller volume compared to feed-grade barley, this segment commands a higher unit value and contributes significantly to value-added grain processing chains. Global expansion in craft brewing, premium lager formats, and non-alcoholic malt-based beverages continues to drive the need for consistent, high-quality malt.
Market positioning of malted barley has been reinforced through tight integration between barley producers, malting companies, and brewers, where traceability, sensory quality, and enzymatic performance are closely monitored.
In developed markets, barley breeders and agribusinesses have collaborated to develop malt-specific varieties with improved extract yield and disease resistance. Meanwhile, emerging markets in Southeast Asia and Africa are increasingly turning to local malting infrastructure to reduce import dependence and promote agricultural value capture.
As brewing companies double down on heritage, flavor, and local sourcing stories, the role of malted barley in innovation pipelines has become more visible. It is anticipated that sustainability-linked contracts, precision agronomy, and varietal differentiation will enhance both production and marketing strategies. Overall, this segment is expected to retain its premium positioning within the global barley value chain.
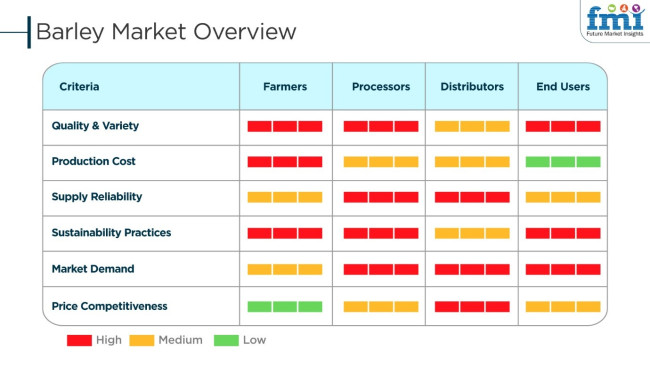
Barley business is driven by growing demand in food, beverage, and animal feed markets and the growing use of functional and plant foods. Growers emphasize high-yielding and disease-resistant product types for reliable supply. Processors highlight efficiency in malting and milling, quality control, and sustainability for brewing and health food. Distributors emphasize pricing management, logistics, and supply chain management to meet growing worldwide demand.
End-users such as breweries, food manufacturers, and animal feed mills place a premium on quality, nutrient content, and traceability. Craft beer, organic product, and proteins trends are driving innovation. Climatic change resistance and sustainability also influence farm and production strategy. As tastes of consumers continue to shift, the industry for gluten-free product, fibre-rich product, and functional ingredients keep on expanding, taking the industry forward toward premium and special product offerings.
Expanding Global Demand for Malted Product in Alcoholic Beverage Production
The alcoholic beverage industry remains the primary driver of product demand, particularly for malted product used in brewing and distilling. With the growing consumption of beer and whiskey worldwide, the demand for high-quality malted product continues to rise.
The craft beer movement, especially in North America and Europe, has further fueled demand for specialty malts that enhance flavor, color, and texture. Additionally, emerging markets in Asia and Latin America are witnessing a surge in beer production, driven by urbanization, evolving consumer preferences, and higher disposable incomes.
AB InBev, Heineken, and Diageo are investing in product supply chain resilience to mitigate risks related to climate change and price volatility. These companies are focusing on contract farming, sustainability programs, and advanced processing technologies to ensure a consistent supply of malted product.
Moreover, non-alcoholic malt beverages are gaining popularity in regions with alcohol restrictions, further boosting demand. As breweries continue to innovate with new beer styles and malt formulations, the global industry will witness sustained long-term growth, reinforcing the strategic importance of product in the beverage industry.
Growing Adoption of Product in Functional and Plant-Based Food Segments
The product is increasingly being incorporated into functional foods, plant-based diets, and health-conscious consumer segments. The rising awareness of product’s nutritional benefits, such as high fiber content, beta-glucans for heart health, and essential micronutrients, has driven its adoption in various food applications. Barley-based products, including flour, flakes, and protein isolates, are being integrated into bakery, cereals, plant-based dairy, and meat alternatives.
Companies such as Nestlé and General Mills are expanding their portfolios to include barley-enriched products that cater to the demand for gut health, weight management, and reduced glycemic index diets.
Additionally, regulatory bodies, such as the European Food Safety Authority (EFSA) and the USA Food and Drug Administration (FDA), have recognized product’s health benefits, leading to increased labeling approvals for cholesterol reduction claims. With the growing adoption of plant-based diets, barley protein is also emerging as an alternative to soy and pea proteins, creating new growth avenues for the global industry.
Rising Use of Barley Extracts in Natural and Organic Skincare Products
These extracts are gaining significant traction in the personal care and cosmetics industry, primarily due to their antioxidant, anti-inflammatory, and skin-rejuvenating properties. As consumers shift toward natural and organic skincare solutions, barley-based ingredients are increasingly being incorporated into moisturizers, serums, and anti-aging formulations. The high concentration of beta-glucans in product helps improve skin hydration and elasticity, making it a valuable component in premium skincare products.
L’Oréal, Estée Lauder, and Shiseido are investing in product-derived bioactives to cater to the growing demand for clean beauty products. These companies are focusing on R&D to enhance the efficacy of extracts in skin barrier repair and UV protection formulations.
Furthermore, the surge in demand for hypoallergenic and sensitive-skin-friendly products has positioned product as a preferred natural ingredient in dermatologically tested cosmetics. With regulatory bodies supporting plant-based and organic certifications, product’s role in the skincare segment is expected to expand, offering lucrative opportunities for ingredient suppliers and personal care brands.
The industry is at multiple critical risks with the factors such as climate variability to changing consumer demand, supply chain disruptions, price volatility, and regulatory changes.
The impact of climate variability on product yield and quality is major, as droughts, floods, and unexpected weather conditions can both lead to decreased production and higher costs. The production of extreme climate events can have a knock-on effect on the food, feed, and brewing industries, which may be unable to operate optimally due to supply shortages.
Regulatory changes like pesticide use limits, sustainability standards, and trade regulations can influence product planting, storage, and export. Traders and farmers can thus be faced with the risk of non-compliance in case they are unable to adapt to the agricultural policies of regional and international organizations.
An adjustment in food choice by consumers for gluten-free cereals and other ingredients used for brewing is one aspect that may be able to affect the utilization of product for malting and brewing. However, the growth in health foods and animal feed may be able to aid the industry to adjust to the changes.
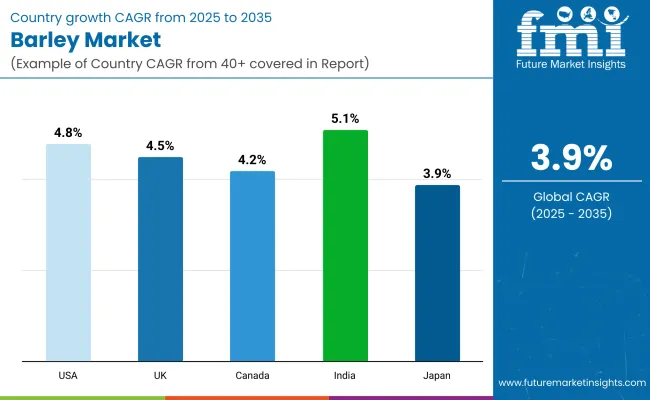
| Countries | CAGR (2025 to 2035) |
|---|---|
| USA | 4.8% |
| UK | 4.5% |
| Canada | 4.2% |
| India | 5.1% |
| Japan | 3.9% |
The USA is among the globe's largest consumers and producers of product, and brewery investment and sustainable farming characterize the industry. The country hosts leading beer brands and craft breweries that drive malted product demand. Growth in premium and specialty beer drives brewers to purchase high-quality types of product with distinct malting properties. In addition, the expanding industry for non-alcoholic malt beverages is attracting health-oriented consumers seeking functional and low-alcohol drinks.
USA product production is concentrated in North Dakota, Montana, and Idaho, where the climate favors high-yielding cultivation. However, changing weather patterns and water shortages have prompted greater investment in climate-resilient product types and precision agriculture techniques.
Regenerative agricultural practices and carbon sequestration programs improve the health and productivity of the soil in the long term. Such practices ensure a steady supply for both domestic and export markets. FMI believes the USA barley industry will likely grow at a 4.8% CAGR during the forecast period.
Growth Factors in the USA
| Key Drivers | Details |
|---|---|
| Rise in Craft and Premium Beer Segment | High-quality malted product demand drives specialty brewing. |
| Growth in Non-Alcoholic Malt Drinks | Health-conscious consumers drink functional, low-alcohol drinks. |
| Climate-Resistant Product Varieties and Regenerative Farming | Climate-resistant product varieties and regenerative farming boost yields. |
| Ideal Growing Conditions | North Dakota, Montana, and Idaho dominate product production. |
Canada's industry relies on increasing demand from the brewing and food industries. The country's craft brewing business is a principal driver of demand for malting barley, and breweries seek to source local high-quality varieties.
In addition, barley functional foods, including plant protein substitutes and high-fiber foods, are expanding the industry. While unexpected climatic trends and soil quality are raising the alarm, Canadian product farming has witnessed the embracement of high-tech agrotech solutions, including artificial intelligence-based crop monitoring and green irrigation.
The schemes offered by the government allow farmers to adopt greenways so that a consistent product output can be maintained. FMI is of the opinion that Canada's industry will achieve 4.2% CAGR growth during the forecast period.
Growth Factors in Canada
| Key Drivers | Details |
|---|---|
| Craft Brewing Growth | Demand for locally sourced malting barley is strong. |
| Functional Food Applications Growth | Protein and fiber products have gained popularity. |
| Agritech Advances | Farm AI monitoring and eco-friendly irrigation optimize yields. |
| Sustainable Farming Government Support | Policies support climate-resilient product cultivation. |
The UK possesses a well-developed industry, serving its distilling and brewing sectors and growing its export industry. The country is a high-quality malting product producer essential for its renowned beer and whiskey industries. Rising demand is spurred by the growing consumption of craft beer and the expansion of whiskey distilleries. British exports of malted product are increasing, particularly in Asian and European markets where tradition and heritage drive premiumization patterns.
Government incentives for carbon-neutral farming allow farmers to maintain yields while reducing emissions. Industry stability is increased through trade diversification in the context of European uncertainty. FMI opines that the UK barley industry will expand at a 4.5% CAGR during the research period.
Growth Factors in the UK
| Key Drivers | Details |
|---|---|
| Beer and Whiskey Industries' Demand | Malted product remains an imperative for alcoholic beverages. |
| Craft Brewing Growth | Craving for craft beer raises demand for specialty product. |
| Precision Farming Adoption | Farmers adopt smart irrigation and climate-resilient product varieties. |
| Government Incentives for Carbon-Neutral Farming | The policy promotes product farming with a reduced carbon footprint. |
India's industry is developing rapidly, and traditional and new applications are gaining popularity. The brewing industry, particularly in beer production, remains the biggest user of malting product. The food industry also employs product in health foods like breakfast cereals and vitamins.
Product production in India is localized in regions such as Rajasthan, Uttar Pradesh, and Haryana, where the crop performs well in semi-arid climates. In response to increasing demand, Indian farmers increasingly use hybrid product varieties with enhanced drought tolerance. Government policies favoring contract farming and sustainable agriculture practices further consolidate the supply chain. FMI believes that India's industry is expected to expand at a 5.1% CAGR over the period of study.
Growth Factors in India
| Key Drivers | Details |
|---|---|
| Increasing Demand from the Brewing Industry | Beer brewing is a heavy consumer of malting product. |
| Increasing Food Items Based on Product | Product is needed in cereals and supplements by health-conscious consumers. |
| Adoption of Drought-Resistant Product | Farmers take up hybrid strains to increase production. |
| Government Assistance for Sustainable Farming | Policies encourage environmentally sustainable farming practices. |
The industry in Japan is stable, with large markets for brewing, processing food, and animal feed. The beer industry uses high-quality malted product, particularly for premium and craft beer. Barley functional foods such as barley tea and high-fiber foods also constitute domestic demand.
Japan relies on imported product from Australia and Canada to meet industry demand. Local production focuses on niche markets like organic and specialty varieties of product. Technological innovations in food processing and brewing are the key drivers for the utilization of product. FMI estimates that Japan's industry is expected to grow at a 3.9% CAGR during the forecast period.
Growth Factors in Japan
| Key Drivers | Details |
|---|---|
| Demand for Premium and Craft Beer | High-quality malted product remains the focus. |
| Expansion in Functional Foods | Tea and snack foods made from product have gained popularity. |
| Reliance on Imports | Australia and Canada supply the majority of Japan's product. |
| Advances in Food Processing Technology | Technology enhances barley-based product applications. |
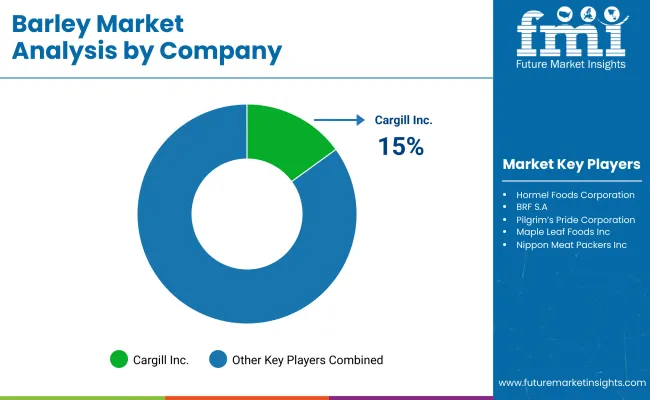
Cargill Inc. (15-20%)
This company is at the top of the industry worldwide through its very well-integrated systems, processing features, and chain networks.
Malteries Soufflet (10-15%)
Leading malt producer in Europe with a comprehensive footprint internationally, offering malt to the premium brewing and distilling industries.
GrainCorp (8-12%)
Its main concern is grain storage and logistics activities, ensuring the reliable trading and resilience of the product supply chain.
AB InBev (5-10%)
Investing in climate-resilient product farming while dealing closely with local farmers to ensure constant quality.
Heineken (5-8%)
It continues its journey to broaden its sustainable sourcing initiative by minimizing the environmental impacts in its supply chain.
Other Key Players (30-40% Combined)
By application, the industry is segmented into alcoholic beverages, non-alcoholic beverages, personal care products, animal feed, food, and pharmaceuticals (supplements).
By grade, the industry is segmented into malt grade, standard, food grade, specialty, pharmaceutical grade, cosmetic grade, and feed grade.
By product type, the industry is segmented into barley flour, pearl barley, barley grits, barley malt, barley flakes, and whole grain barley.
By region, the industry is segmented into North America, Latin America, Europe, Asia Pacific, and the Middle East & Africa.
The industry is slated to reach USD 26.3 billion in 2025.
The industry is predicted to reach USD 35.1 billion by 2035.
India, poised to witness 5.1% CAGR from 2025 to 2035, is slated to register fastest growth.
Key companies include Tyson Foods Inc., JBS S.A., WH Group (Smithfield Foods), Cargill Inc., Hormel Foods Corporation, BRF S.A., Pilgrim’s Pride Corporation, Maple Leaf Foods Inc., Nippon Meat Packers Inc., and Danish Crown Group.
Barley malt is being widely used.


Our Research Products

The "Full Research Suite" delivers actionable market intel, deep dives on markets or technologies, so clients act faster, cut risk, and unlock growth.

The Leaderboard benchmarks and ranks top vendors, classifying them as Established Leaders, Leading Challengers, or Disruptors & Challengers.

Locates where complements amplify value and substitutes erode it, forecasting net impact by horizon

We deliver granular, decision-grade intel: market sizing, 5-year forecasts, pricing, adoption, usage, revenue, and operational KPIs—plus competitor tracking, regulation, and value chains—across 60 countries broadly.

Spot the shifts before they hit your P&L. We track inflection points, adoption curves, pricing moves, and ecosystem plays to show where demand is heading, why it is changing, and what to do next across high-growth markets and disruptive tech

Real-time reads of user behavior. We track shifting priorities, perceptions of today’s and next-gen services, and provider experience, then pace how fast tech moves from trial to adoption, blending buyer, consumer, and channel inputs with social signals (#WhySwitch, #UX).

Partner with our analyst team to build a custom report designed around your business priorities. From analysing market trends to assessing competitors or crafting bespoke datasets, we tailor insights to your needs.
Supplier Intelligence
Discovery & Profiling
Capacity & Footprint
Performance & Risk
Compliance & Governance
Commercial Readiness
Who Supplies Whom
Scorecards & Shortlists
Playbooks & Docs
Category Intelligence
Definition & Scope
Demand & Use Cases
Cost Drivers
Market Structure
Supply Chain Map
Trade & Policy
Operating Norms
Deliverables
Buyer Intelligence
Account Basics
Spend & Scope
Procurement Model
Vendor Requirements
Terms & Policies
Entry Strategy
Pain Points & Triggers
Outputs
Pricing Analysis
Benchmarks
Trends
Should-Cost
Indexation
Landed Cost
Commercial Terms
Deliverables
Brand Analysis
Positioning & Value Prop
Share & Presence
Customer Evidence
Go-to-Market
Digital & Reputation
Compliance & Trust
KPIs & Gaps
Outputs
Full Research Suite comprises of:
Market outlook & trends analysis
Interviews & case studies
Strategic recommendations
Vendor profiles & capabilities analysis
5-year forecasts
8 regions and 60+ country-level data splits
Market segment data splits
12 months of continuous data updates
DELIVERED AS:
PDF EXCEL ONLINE
Barley Flake Market Size and Share Forecast Outlook 2025 to 2035
Barley Protein Market – Growth, Demand & Plant-Based Protein Trends
Feed Barley Market Analysis - Size, Share, and Forecast Outlook 2025 to 2035
Malted barley flour Market Size and Share Forecast Outlook 2025 to 2035

Thank you!
You will receive an email from our Business Development Manager. Please be sure to check your SPAM/JUNK folder too.
Chat With
MaRIA