Acetone Market Size and Share Forecast Outlook 2025 to 2035

The Acetone Market is estimated to be valued at USD 7.8 billion in 2025 and is projected to reach USD 13.9 billion by 2035, registering a compound annual growth rate (CAGR) of 6.0% over the forecast period.

The Acetone market is experiencing steady growth driven by its extensive use across various industrial applications, particularly in the chemicals and solvent sectors. The future outlook for this market is shaped by increasing demand for high-purity acetone, especially grades above 99.5%, in applications requiring precise chemical reactions and manufacturing processes. Rising consumption in end-use industries such as chemicals, pharmaceuticals, and coatings is further supporting market expansion.

Technological advancements in production processes have improved yield and quality, enabling manufacturers to meet stringent purity standards. The market is also benefiting from growing industrialization and the expansion of chemical manufacturing facilities worldwide. Increasing awareness about the efficiency and versatility of acetone as a solvent, coupled with its role in producing polymers, adhesives, and coatings, is propelling adoption across multiple industries.

Additionally, the ongoing focus on sustainability and regulatory compliance in chemical manufacturing is encouraging the use of acetone in environmentally friendly processes As demand for high-purity solvents continues to rise, the Acetone market is poised for sustained growth in both established and emerging regions.
Quick Stats for Acetone Market

  • Acetone Market Industry Value (2025): USD 7.8 billion
  • Acetone Market Forecast Value (2035): USD 13.9 billion
  • Acetone Market Forecast CAGR: 6.0%
  • Leading Segment in Acetone Market in 2025: ≥ 99.5% (60.0%)
  • Key Growth Region in Acetone Market: North America, Asia-Pacific, Europe
  • Top Key Players in Acetone Market: Ineos Phenol, Royal Dutch Shell PLC, Formosa Chemical and Fibre Corporation, Mitsubishi Chemical Corporation, ExxonMobil Chemical Company, Chevron Phillips Chemical, BASF, LyondellBasell, Cepsa Quimica, Altivia Chemicals, Sasol Ltd., The Dow Chemical Company, Domo Chemicals GmbH, SABIC

Acetone Market Country Value Analysis

Metric Value
Acetone Market Estimated Value in (2025 E) USD 7.8 billion
Acetone Market Forecast Value in (2035 F) USD 13.9 billion
Forecast CAGR (2025 to 2035) 6.0%

Segmental Analysis

The market is segmented by Grade, Application, End Use, and Chemical Segment and region. By Grade, the market is divided into ≥ 99.5% and < 99.5%. In terms of Application, the market is classified into Solvent, Methyl Methacrylate, Bisphenol A, and Methyl Isobutyl Ketone. Based on End Use, the market is segmented into Chemicals, Pharmaceuticals, and Cosmetics And Personal Care. By Chemical Segment, the market is divided into Agricultural Chemicals, Paints And Coatings, Rubber Processing, Polymer And Resin Processing, Adhesives, and Printing Ink. Regionally, the market is classified into North America, Latin America, Western Europe, Eastern Europe, Balkan & Baltic Countries, Russia & Belarus, Central Asia, East Asia, South Asia & Pacific, and the Middle East & Africa.
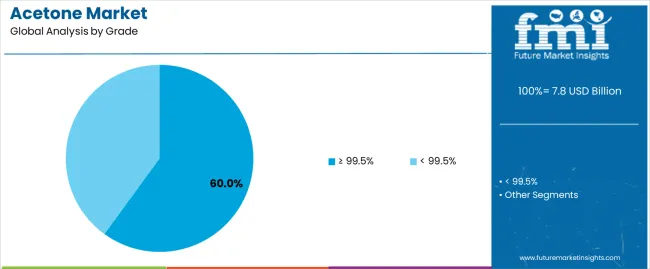
Insights into the ≥ 99.5% Grade Segment

Acetone Market Analysis By Grade

The ≥ 99.5% grade segment is projected to hold 60.0% of the Acetone market revenue share in 2025, making it the leading grade. This dominance is attributed to the increasing requirement for high-purity acetone in critical chemical processes, where impurities can impact product quality and consistency.

The growth of this segment is further supported by stringent industry standards and regulatory requirements, which mandate the use of high-purity solvents in pharmaceuticals, coatings, and electronic chemicals. Manufacturers prefer this grade due to its reliability in delivering consistent performance across diverse applications.

Additionally, advancements in purification technologies have facilitated large-scale production of ≥ 99.5% grade acetone, ensuring steady supply to meet rising industrial demand The versatility, high solvency power, and compatibility of this grade with various chemical reactions continue to reinforce its position as the dominant choice in the market.
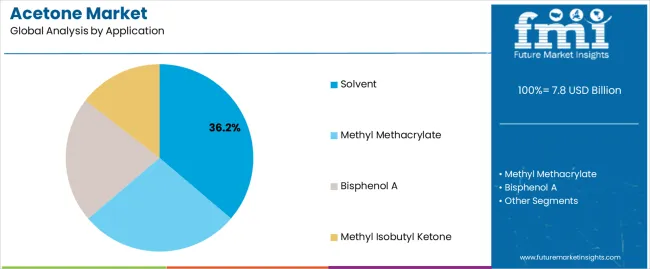
Insights into the Solvent Application Segment

Acetone Market Analysis By Application

The solvent application segment is expected to capture 36.2% of the Acetone market revenue share in 2025, positioning it as the leading application. The growth of this segment is driven by the wide use of acetone as an effective solvent in paints, coatings, adhesives, and cleaning formulations.

Its strong solvency and fast evaporation rate make it suitable for both industrial and laboratory applications, ensuring efficient performance. Increasing industrial production and expansion of chemical manufacturing units have further propelled the adoption of acetone as a solvent.

Moreover, its compatibility with various organic and inorganic compounds has reinforced its dominance in this segment The ongoing demand for high-quality solvents that meet regulatory and performance standards continues to drive market growth.
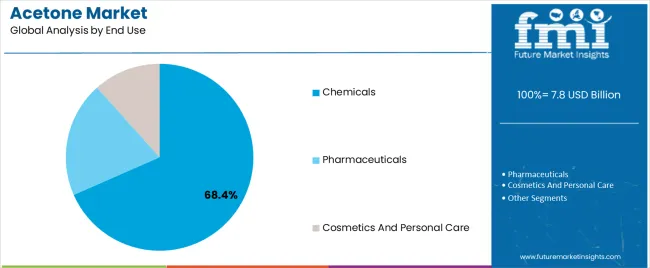
Insights into the Chemicals End-Use Industry Segment

Acetone Market Analysis By End Use

The chemicals end-use industry segment is anticipated to account for 68.4% of the Acetone market revenue in 2025, making it the leading end-use industry. This growth is driven by the extensive application of acetone in chemical synthesis, polymer production, and intermediate manufacturing. The versatility and high purity of acetone make it a preferred solvent and reagent for chemical reactions and formulations.

Industrial demand is further strengthened by the expansion of chemical manufacturing facilities and rising production of paints, coatings, and adhesives. The ability to provide consistent quality and reliable performance has reinforced acetone’s position in the chemicals sector.

Additionally, stringent quality standards and regulatory compliance in chemical manufacturing processes support the continued adoption of acetone As industrial activities expand and chemical production scales increase globally, the chemicals end-use segment is expected to maintain its dominant market position.

Semi-annual Market Update

The annual growth rates of the global acetone market from 2025 to 2035 are illustrated in the table below. Starting with the base year 2025 and going up to the present year 2025, the report examines how the growth trajectory changes from the first half of the year, i.e. January through June (H1) to the second half consisting of July through December (H2). It gives stakeholders a comprehensive picture of the performance over time and insights into potential future developments.

The figures provided show the growth for each half-year between 2025 and 2025. The market was projected to rise at a CAGR of 4.8% in the first half (H1) of 2025. The second half (H2) had a noticeable surge of 5% CAGR.

Particular Value CAGR
H1 4.8% (2025 to 2035)
H2 5% (2025 to 2035)
H1 5.1% (2025 to 2035)
H2 5.3% (2025 to 2035)

Moving into the subsequent period, from H1 2025 to H2 2025, the CAGR is projected to slightly increase to 5.1% in the first half and relatively broaden to 5.3% in the second half. In the first half (H1), there was a surge of 30 BPS while in the second half (H2), there was a slight increase of 30 BPS.

Key Industry Highlights

Pharmaceutical Industry Augments Demand with Requirement for Solvents

The pharmaceutical industry is booming due to increasing healthcare requirements backed by the growing prevalence of chronic diseases and ongoing drug development activities. This will likely influence demand as the organic compound is widely used as a solvent in pharmaceutical manufacturing.

Drug manufacturing processes like formulation, extraction, and purification often require the organic compound. Its capability of dissolving a wide range of solutes helps produce pharmaceutical products with high quality. This further leads to efficient and stable therapeutic applications.

Strict regulatory standards and requirements for efficient, high-purity solvents in pharmaceutical production are also estimated to contribute to growth. With increasing innovation and the developing pharmaceutical industry, demand for reliable solvents like dimethyl ketone is projected to increase through 2035.

Increasing Use of Nail Care Products to Create Growth Avenues

Increasing consumer awareness of personal grooming is leading to the rising consumption of dimethyl ketone. The chemical serves as an efficient solvent and is projected to be utilized in the production of nail care and cosmetic products.

Growing beauty and personal care industry on a global scale is set to augment the production of nail polish removers, fragrances, bath products, skin care products, and cleansing items, bolstering demand for dimethyl ketone. Individuals are more likely to change their nail polish frequently due to the rapidly evolving fashion trends and the influence of social media. This is projected to further boost sales in the forecast period.

Development of new dimethyl ketone formulations that are not harsh on the skin and nails is anticipated to attract modern health-conscious consumers. This rise in consumer awareness and usage of personal care products is set to boost growth.

High Demand for Methyl Methacrylate in Construction Projects is a Key Trend

Robust growth in the construction and automotive industries is anticipated to bolster the need for methyl methacrylate (MMA). In the construction industry, MMA is mainly utilized for producing long-lasting, weather-resistant materials, such as acrylic sheets and coatings.

It is highly preferred due to its enhanced aesthetic appeal and endurance trait, which is a prerequisite to any contemporary construction project. The rapid pace of infrastructure development activities is further estimated to foster the requirement for these high-performance materials.

In the automotive industry, methyl methacrylate plays an essential role in producing lightweight components, such as automobile windows, light covers, and interior parts that are resistant to breakage. Increasing demand for fuel-efficient vehicles along with technological strides witnessed by electric vehicle manufacturers has resulted in surging demand for methyl methacrylate-based products.

Methyl methacrylate in adhesives and coatings improves vehicle performance and aesthetics. With both segments developing new technologies, demand for methyl methacrylate is predicted to increase substantially.

Key Companies Adopt Bio-based Feedstock to Lower Environmental Impact

The conventional production process of acetone is based on the utilization of fossil fuels as petroleum-based feedstock depleted finite resources. It also emits greenhouse gases into the atmosphere and exacerbates climate change. The environmental load originating from fossil fuel extraction and processing brings about serious concerns related to sustainability.

Governments of different countries worldwide are imposing stringent regulations with respect to the environment and climate change. They are striving to minimize ecological footprints resulting from industry-related activities.

Dimethyl ketone producers are anticipated to face new challenges that involve adaptation to those regulations. These include reduced targets for emissions, strict standards of waste management, or the need for sustainable methods of production.

To address these environmental challenges, key producers are exploring alternative, sustainable methods of production. A few promising approaches involve utilizing bio-based feedstock, such as agricultural residues or waste streams and employing innovative, energy-efficient processes to reduce both resource consumption and emissions. These help in aligning with the evolving landscape of eco-friendly industrial practices.

Health and Safety Risks Associated with Dimethyl Ketone Production Hinder Sales

Acetone poses health and safety risks during production and handling, thereby impacting growth. It is highly flammable and might lead to several health hazards, such as respiratory issues and skin irritation.

Governing bodies across the globe have hence imposed strict regulations for the production and handling of this organic compound, leading to high costs for manufacturers. Expensive nature associated with the implementation of safety measures, coupled with concerns regarding environmental pollution due to emissions from industrial processes is inhibiting growth.

2020 to 2024 Global Acetone Sales Analysis Compared to Demand Forecast from 2025 to 2035

The global acetone industry recorded a CAGR of 3.4% during the historical period between 2020 and 2025. The growth was positive as it reached a value of USD 6,955.1 million in 2025 from USD 6,090.4 million in 2020.

The industry experienced significant fluctuations due to economic qualms during the historical period. The global economy encountered several challenges, such as trade disputes, currency fluctuations, and geopolitical conflicts impacting industries dependent on these compounds.

The COVID-19 pandemic disrupted global supply chains and industrial activities, causing a temporary downturn in the industry. This resulted in delays and decreased the manufacturing capacity. Lockdowns and restrictions impacted transportation and logistics, making it difficult to maintain regular supply and distribution channels.

Decreased industrial activities and demand fluctuations in key end-use industries, such as automotive, construction, and paints and coatings made the situation more challenging for the dimethyl ketone market participants. The industry is anticipated to reach a value of USD 6,955.1 million by 2025. It is further expected to grow at a CAGR of 6.3% to reach USD 13,521.8 million by 2035.

The industry demonstrated resilient growth in the post-COVID-19 period with a slow but steady recovery owing to the easing lockdown restrictions globally. The supply chains are being incorporated with new changes as part of the new normal.

Once economic activity reaches pre-crisis levels, industrial activity is expected to reach its trend performance after a delay of 3 years, growing steadily for the next 4 years before coming to a stable position in the later period of 2035. The acetone demand pattern is anticipated to reflect the same trend during this period.

Market Concentration

Tier 1 companies include industry leaders with annual revenues exceeding USD 1,000 to 1,200 million. These companies capture a significant global share ranging from 58% to 61%. These frontrunners are generally characterized by high production capacity and a wide product portfolio.

Tier 1 organizations are distinguished by extensive expertise in manufacturing and a broad geographical reach that is underpinned by a robust consumer base. These businesses provide a wide range of products and deploy the latest technology to meet regulatory standards. Prominent companies within Tier 1 include Ineos Phenol, Royal Dutch Shell PLC, Formos, Chemical and Fibre Corporation, Mitsubishi Chemical Corporation, ExxonMobil Chemical Company, and BASF.

Tier 2 companies encompass mid-sized participants, holding a presence in specific regions and exerting significant influence in local economies. These firms are distinguished by their robust presence overseas and in-depth industry expertise.

Businesses in Tier 2 possess strong technological capabilities and strictly adhere to regulatory requirements. These firms, however, may not wield cutting-edge technology or maintain an extensive global reach. Noteworthy entities in Tier 2 include Barentz, Gulf Chemical International Corp., Sumitomo Chemical Co., Ltd, Titan Chemicals Corporation Ltd., and Wacker Chemie AG.

Tier 3 comprises a huge amount of small-scale enterprises operating within the regional sphere and catering to specialized needs. These enterprises have revenues below USD 50 million to 100 million. They are focused on meeting local demands and are therefore categorized within the Tier 3 segment.

Companies in Tier 3 are prominently small-scale participants with a limited geographical presence. In this context, Tier 3 is acknowledged as an informal sector, indicating a segment distinguished by lack of extensive organization and formal structure in comparison to the structured organizations in Tier 1 and Tier 2. Renowned companies in Tier 3 include EMCO Limited, and Reda Chemicals India Pvt Ltd.

Country-wise Insights

The section provides businesses with an overview of the industry. It consists of a detailed analysis of the emerging trends and opportunities on a country-by-country basis. This country-specific examination is projected to assist organizations in understanding the complex nature of the business.

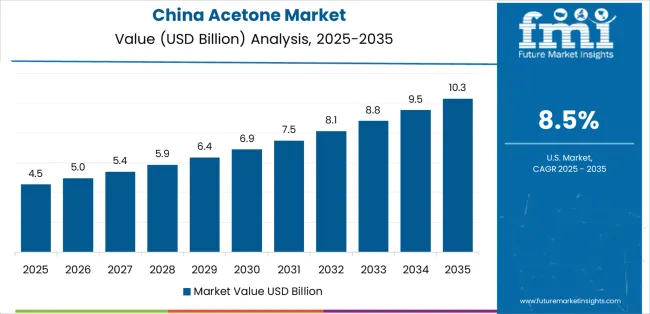
China is estimated to emerge as a dominating country during the forecast period with a projected CAGR of 8.3% through 2035. South Korea, Japan, and Brazil are likely to follow to become the prominent countries with projected CAGRs of 7.3%, 6.8%, and 6.7%, respectively.

Country Value CAGR (2025 to 2035)
China 8.3%
South Korea 7.3%
Japan 6.8%
Brazil 6.7%
United States 5.8%

High Demand for Paints and Coatings in Construction Industry Pushes Sales in China

Sales of dimethyl ketone in China are projected to surge at a CAGR of 8.3% during the forecast period. The country is expected to reach USD 4,820.3 million by 2035 owing to thriving construction and infrastructure industries.

The country’s increasing number of infrastructure projects, including residential, commercial, and industrial units have resulted in a massive requirement for paints and coatings. Dimethyl ketone is a crucial component in paints and coatings.

The compound is used as a solvent aiding paint formulations to ensure their proper mixing and application. It also facilitates quick drying and enhances the finish of coatings.

China’s automotive and electronics industries use acetone in paint formulations and surface treatments to improve the durability and appearance of their products. Government investments in infrastructure, housing, and industrial projects are set to fuel demand for paints and coatings during the forecast period.

China is one of the leading manufacturers of electronic goods such as mobile phones, computers, and television sets. Manufacturers are projected to utilize acetone for cleaning these devices during their production.

South Korea’s Booming Electronics Manufacturing Industry to Augment Demand

The acetone market in South Korea is projected to surge at a CAGR of 7.3% during the assessment period. The country is expected to be worth USD 670.5 million by 2035.

South Korea is one of the leading producers and exporters of semiconductors and electronic products across the globe. These industries have a high demand for ultra-pure acetone. The compound is set to be used for surface cleaning and preparation application in the manufacturing process as it removes surface contaminants selectively without leaving any residues.

South Korea’s high-tech industry heavily relies on innovation and superior technologies. This dependency is resulting in an increasing demand for high-quality solvents, such as acetone. Increased research and development investments coupled with a robust electronics industry contribute toward a stable demand in the country.

Acetone is also utilized in other high-tech processes, such as the manufacturing of special materials and machines, further augmenting sales of the compound. The robust technological base along with continuous progression in electronics has assisted in securing a steady demand and increasing consumption of the compound, pushing its requirement in South Korea.

Demand Soars in Japan Amid Growing Use in High-quality Medicine Production

Japan’s acetone industry is predicted to rise steadily at a CAGR of 6.8% during the forecast period, attaining a value of USD 940.3 million by 2035. High demand for the compound is associated with the presence of a well-established and developed pharmaceutical industry in the country.

In the pharmaceutical industry, the compound is set to be used for formulation, extraction, and purification processes. As a solvent, it will likely play a crucial role in the production of high-quality medicines as it assists in dissolving and separating active pharmaceutical ingredients.

Research and development activities coupled with the stringent regulatory framework facilitate the utilization of dimethyl ketone for pharmaceutical applications. The compound helps the country’s robust, dominating, and innovative pharmaceutical industry to maintain efficacy and safety during the drug manufacturing process.

Japan’s focus on healthcare and the manufacturing of prescription as well as non-prescription drugs is another factor fueling demand for dimethyl ketone. The presence of large pharmaceutical companies and a strong healthcare infrastructure is further creating a stable acetone market in Japan.

Category-wise Insights

The section provides businesses with insightful data and analysis of the two leading segments. Segmentation of these categories assists organizations to understand the dynamics and invest in the beneficial zones.

Solvent is set to lead the application segment with a value share of 36.2% in 2025. The chemicals segment is projected to dominate in terms of the end-use category with a value share of 68.4% in the same year.

Rising Need for High-performance Materials Spurs Sales of Acetone as Solvents

Segment Solvent (Application)
Value Share (2025) 36.2%

The solvent segment is predicted to witness a decent CAGR of 7.1% during the assessment period. This growth is set to be driven by the increasing demand for reliable solvents across various industries, including paints and coatings, adhesives, and pharmaceuticals.

Expansion and modernization of industries, particularly manufacturing, construction, and healthcare, are estimated to raise the need for effective solvents like acetone. The rising emphasis on high-performance materials and the continuous development of new applications for acetone as a solvent further contribute to this robust demand.

Chemical Manufacturers Seek Reliable Solvents for Producing Resins and Plastics

Segment Chemicals (End-use)
Value Share (2025) 68.4%

The chemical segment is poised for significant growth over the forecast period with a projected value share of 68.4% in 2025. This dominance is attributed to the compound’s extensive use in producing various chemical intermediates, such as bisphenol A (BPA), methyl methacrylate (MMA), and methyl isobutyl ketone (MIBK). These intermediates are crucial in the manufacturing of plastics, resins, and other high-performance materials that are widely used in the automotive, construction, and electronics industries.

Growing demand for durable and lightweight materials is boosted by technological innovations and consumer preferences, further propelling the need for dimethyl ketone in chemical firms. The compound’s role as a solvent in numerous industrial processes enhances its worth in the chemical industry.

Expansion of the industry is also supported by increasing industrial activities and rising investments in research and development activities. The chemical segment, as a result, remains a critical growth driver for the expansion and evolution of the market.
Competition Outlook

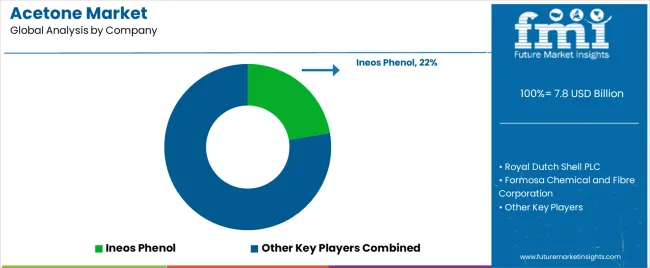
Acetone Market Analysis By Company

The global acetone market is fragmented with the presence of several leading and small-scale companies. Key companies are focusing on investing huge sums in research and development activities to broaden their existing product offerings. They are also engaging in partnerships with mid-sized players, acquisitions and mergers, and new agreements. They need to provide cost-effective products to gain a competitive advantage worldwide.

A few manufacturers are striving to reduce operating costs by producing the chemical locally. Industry giants like LG Chem Ltd, Honeywell International Inc., Shell Chemical Co, Mitsui Chemicals Inc., BASF, and Dow Chemical Company are focusing on surging profits by funding innovations. They are also investing in the development of state-of-the-art production facilities, especially in emerging economies due to the easy access to low-cost labor and raw material.

Industry Updates

  • In January 2025, Haldia Petrochemicals Ltd, based in Kolkata, opened India’s enormous phenol plant. The project is anticipated to be complete by the first quarter of 2029. Once operational, it will be capable of producing 185 KTPA of acetone and 300 kilotons of phenol per annum.
  • In December 2025, Thailand-based PTT Global Chemical (PTTGC) announced its plan to resume its acetone and phenol production capacity at 90% through the same month. The initiative would enable PTTGC to enhance resource allocation and improve operational efficiency. The company’s manufacturing facility has a total annual capacity of 150 thousand tons of acetone and 250 thousand tons of phenol.
  • In April 2025, KBR, Inc., headquartered in the United States, and China-based Wanhua Chemical Group Co., Ltd. penned an agreement to offer new technology to develop a 650 KTA acetone/phenol plant in Shandong Province. The plant achieved a new record for rapid start-up as it manufactured high-quality products in only eight days.

Leading Acetone Brands

  • Ineos Phenol
  • Royal Dutch Shell PLC
  • Formosa Chemical and Fibre Corporation
  • Mitsubishi Chemical Corporation
  • ExxonMobil Chemical Company
  • Chevron Phillips Chemical
  • BASF
  • LyondellBasell
  • Cepsa Quimica
  • Altivia chemicals
  • Sasol Ltd.
  • The Dow Chemical Company
  • Domo Chemicals GmbH
  • SABIC

Key Segments of Market Report

By Grade:

In terms of grade, the industry is divided into ≥ 99.5% and < 99.5%.

By Application:

Solvent, methyl methacrylate, bisphenol A, and methyl isobutyl ketone are a few applications of dimethyl ketone.

By End-use:

The compound is significantly used in chemicals, pharmaceuticals, and cosmetics and personal care industries. The chemical segment is further divided into agricultural chemicals, paints and coatings, rubber processing, polymer and resin processing, adhesives, and printing ink.

By Region:

The sector is spread across North America, Latin America, Western Europe, Eastern Europe, East Asia, South Asia, and the Middle East and Africa.

Frequently Asked Questions

How big is the acetone market in 2025?

The global acetone market is estimated to be valued at USD 7.8 billion in 2025.

What will be the size of acetone market in 2035?

The market size for the acetone market is projected to reach USD 13.9 billion by 2035.

How much will be the acetone market growth between 2025 and 2035?

The acetone market is expected to grow at a 6.0% CAGR between 2025 and 2035.

What are the key product types in the acetone market?

The key product types in acetone market are ≥ 99.5% and < 99.5%.

Which application segment to contribute significant share in the acetone market in 2025?

In terms of application, solvent segment to command 36.2% share in the acetone market in 2025.

Table of Content

  1. Executive Summary
    • Global Market Outlook
    • Demand-side Trends
    • Supply-side Trends
    • Technology Roadmap Analysis
    • Analysis and Recommendations
  2. Market Overview
    • Market Coverage / Taxonomy
    • Market Definition / Scope / Limitations
  3. Market Background
    • Market Dynamics
      • Drivers
      • Restraints
      • Opportunity
      • Trends
    • Scenario Forecast
      • Demand in Optimistic Scenario
      • Demand in Likely Scenario
      • Demand in Conservative Scenario
    • Opportunity Map Analysis
    • Product Life Cycle Analysis
    • Supply Chain Analysis
    • Investment Feasibility Matrix
    • Value Chain Analysis
    • PESTLE and Porter’s Analysis
    • Regulatory Landscape
    • Regional Parent Market Outlook
    • Production and Consumption Statistics
    • Import and Export Statistics
  4. Global Market Analysis 2020 to 2024 and Forecast, 2025 to 2035
    • Historical Market Size Value (USD Million) Analysis, 2020 to 2024
    • Current and Future Market Size Value (USD Million) Projections, 2025 to 2035
      • Y-o-Y Growth Trend Analysis
      • Absolute $ Opportunity Analysis
  5. Global Market Pricing Analysis 2020 to 2024 and Forecast 2025 to 2035
  6. Global Market Analysis 2020 to 2024 and Forecast 2025 to 2035, By Grade
    • Introduction / Key Findings
    • Historical Market Size Value (USD Million) Analysis By Grade , 2020 to 2024
    • Current and Future Market Size Value (USD Million) Analysis and Forecast By Grade , 2025 to 2035
      • ≥ 99.5%
      • < 99.5%
    • Y-o-Y Growth Trend Analysis By Grade , 2020 to 2024
    • Absolute $ Opportunity Analysis By Grade , 2025 to 2035
  7. Global Market Analysis 2020 to 2024 and Forecast 2025 to 2035, By Application
    • Introduction / Key Findings
    • Historical Market Size Value (USD Million) Analysis By Application, 2020 to 2024
    • Current and Future Market Size Value (USD Million) Analysis and Forecast By Application, 2025 to 2035
      • Solvent
      • Methyl Methacrylate
      • Bisphenol A
      • Methyl Isobutyl Ketone
    • Y-o-Y Growth Trend Analysis By Application, 2020 to 2024
    • Absolute $ Opportunity Analysis By Application, 2025 to 2035
  8. Global Market Analysis 2020 to 2024 and Forecast 2025 to 2035, By End Use
    • Introduction / Key Findings
    • Historical Market Size Value (USD Million) Analysis By End Use, 2020 to 2024
    • Current and Future Market Size Value (USD Million) Analysis and Forecast By End Use, 2025 to 2035
      • Chemicals
      • Pharmaceuticals
      • Cosmetics And Personal Care
    • Y-o-Y Growth Trend Analysis By End Use, 2020 to 2024
    • Absolute $ Opportunity Analysis By End Use, 2025 to 2035
  9. Global Market Analysis 2020 to 2024 and Forecast 2025 to 2035, By Chemical Segment
    • Introduction / Key Findings
    • Historical Market Size Value (USD Million) Analysis By Chemical Segment, 2020 to 2024
    • Current and Future Market Size Value (USD Million) Analysis and Forecast By Chemical Segment, 2025 to 2035
      • Agricultural Chemicals
      • Paints And Coatings
      • Rubber Processing
      • Polymer And Resin Processing
      • Adhesives
      • Printing Ink
    • Y-o-Y Growth Trend Analysis By Chemical Segment, 2020 to 2024
    • Absolute $ Opportunity Analysis By Chemical Segment, 2025 to 2035
  10. Global Market Analysis 2020 to 2024 and Forecast 2025 to 2035, By Region
    • Introduction
    • Historical Market Size Value (USD Million) Analysis By Region, 2020 to 2024
    • Current Market Size Value (USD Million) Analysis and Forecast By Region, 2025 to 2035
      • North America
      • Latin America
      • Western Europe
      • Eastern Europe
      • East Asia
      • South Asia and Pacific
      • Middle East & Africa
    • Market Attractiveness Analysis By Region
  11. North America Market Analysis 2020 to 2024 and Forecast 2025 to 2035, By Country
    • Historical Market Size Value (USD Million) Trend Analysis By Market Taxonomy, 2020 to 2024
    • Market Size Value (USD Million) Forecast By Market Taxonomy, 2025 to 2035
      • By Country
        • USA
        • Canada
        • Mexico
      • By Grade
      • By Application
      • By End Use
      • By Chemical Segment
    • Market Attractiveness Analysis
      • By Country
      • By Grade
      • By Application
      • By End Use
      • By Chemical Segment
    • Key Takeaways
  12. Latin America Market Analysis 2020 to 2024 and Forecast 2025 to 2035, By Country
    • Historical Market Size Value (USD Million) Trend Analysis By Market Taxonomy, 2020 to 2024
    • Market Size Value (USD Million) Forecast By Market Taxonomy, 2025 to 2035
      • By Country
        • Brazil
        • Chile
        • Rest of Latin America
      • By Grade
      • By Application
      • By End Use
      • By Chemical Segment
    • Market Attractiveness Analysis
      • By Country
      • By Grade
      • By Application
      • By End Use
      • By Chemical Segment
    • Key Takeaways
  13. Western Europe Market Analysis 2020 to 2024 and Forecast 2025 to 2035, By Country
    • Historical Market Size Value (USD Million) Trend Analysis By Market Taxonomy, 2020 to 2024
    • Market Size Value (USD Million) Forecast By Market Taxonomy, 2025 to 2035
      • By Country
        • Germany
        • UK
        • Italy
        • Spain
        • France
        • Nordic
        • BENELUX
        • Rest of Western Europe
      • By Grade
      • By Application
      • By End Use
      • By Chemical Segment
    • Market Attractiveness Analysis
      • By Country
      • By Grade
      • By Application
      • By End Use
      • By Chemical Segment
    • Key Takeaways
  14. Eastern Europe Market Analysis 2020 to 2024 and Forecast 2025 to 2035, By Country
    • Historical Market Size Value (USD Million) Trend Analysis By Market Taxonomy, 2020 to 2024
    • Market Size Value (USD Million) Forecast By Market Taxonomy, 2025 to 2035
      • By Country
        • Russia
        • Poland
        • Hungary
        • Balkan & Baltic
        • Rest of Eastern Europe
      • By Grade
      • By Application
      • By End Use
      • By Chemical Segment
    • Market Attractiveness Analysis
      • By Country
      • By Grade
      • By Application
      • By End Use
      • By Chemical Segment
    • Key Takeaways
  15. East Asia Market Analysis 2020 to 2024 and Forecast 2025 to 2035, By Country
    • Historical Market Size Value (USD Million) Trend Analysis By Market Taxonomy, 2020 to 2024
    • Market Size Value (USD Million) Forecast By Market Taxonomy, 2025 to 2035
      • By Country
        • China
        • Japan
        • South Korea
      • By Grade
      • By Application
      • By End Use
      • By Chemical Segment
    • Market Attractiveness Analysis
      • By Country
      • By Grade
      • By Application
      • By End Use
      • By Chemical Segment
    • Key Takeaways
  16. South Asia and Pacific Market Analysis 2020 to 2024 and Forecast 2025 to 2035, By Country
    • Historical Market Size Value (USD Million) Trend Analysis By Market Taxonomy, 2020 to 2024
    • Market Size Value (USD Million) Forecast By Market Taxonomy, 2025 to 2035
      • By Country
        • India
        • ASEAN
        • Australia & New Zealand
        • Rest of South Asia and Pacific
      • By Grade
      • By Application
      • By End Use
      • By Chemical Segment
    • Market Attractiveness Analysis
      • By Country
      • By Grade
      • By Application
      • By End Use
      • By Chemical Segment
    • Key Takeaways
  17. Middle East & Africa Market Analysis 2020 to 2024 and Forecast 2025 to 2035, By Country
    • Historical Market Size Value (USD Million) Trend Analysis By Market Taxonomy, 2020 to 2024
    • Market Size Value (USD Million) Forecast By Market Taxonomy, 2025 to 2035
      • By Country
        • Kingdom of Saudi Arabia
        • Other GCC Countries
        • Turkiye
        • South Africa
        • Other African Union
        • Rest of Middle East & Africa
      • By Grade
      • By Application
      • By End Use
      • By Chemical Segment
    • Market Attractiveness Analysis
      • By Country
      • By Grade
      • By Application
      • By End Use
      • By Chemical Segment
    • Key Takeaways
  18. Key Countries Market Analysis
    • US
      • Pricing Analysis
      • Market Share Analysis, 2024
        • By Grade
        • By Application
        • By End Use
        • By Chemical Segment
    • Canada
      • Pricing Analysis
      • Market Share Analysis, 2024
        • By Grade
        • By Application
        • By End Use
        • By Chemical Segment
    • Mexico
      • Pricing Analysis
      • Market Share Analysis, 2024
        • By Grade
        • By Application
        • By End Use
        • By Chemical Segment
    • Brazil
      • Pricing Analysis
      • Market Share Analysis, 2024
        • By Grade
        • By Application
        • By End Use
        • By Chemical Segment
    • Chile
      • Pricing Analysis
      • Market Share Analysis, 2024
        • By Grade
        • By Application
        • By End Use
        • By Chemical Segment
    • Germany
      • Pricing Analysis
      • Market Share Analysis, 2024
        • By Grade
        • By Application
        • By End Use
        • By Chemical Segment
    • UK
      • Pricing Analysis
      • Market Share Analysis, 2024
        • By Grade
        • By Application
        • By End Use
        • By Chemical Segment
    • Italy
      • Pricing Analysis
      • Market Share Analysis, 2024
        • By Grade
        • By Application
        • By End Use
        • By Chemical Segment
    • Spain
      • Pricing Analysis
      • Market Share Analysis, 2024
        • By Grade
        • By Application
        • By End Use
        • By Chemical Segment
    • France
      • Pricing Analysis
      • Market Share Analysis, 2024
        • By Grade
        • By Application
        • By End Use
        • By Chemical Segment
    • India
      • Pricing Analysis
      • Market Share Analysis, 2024
        • By Grade
        • By Application
        • By End Use
        • By Chemical Segment
    • ASEAN
      • Pricing Analysis
      • Market Share Analysis, 2024
        • By Grade
        • By Application
        • By End Use
        • By Chemical Segment
    • Australia & New Zealand
      • Pricing Analysis
      • Market Share Analysis, 2024
        • By Grade
        • By Application
        • By End Use
        • By Chemical Segment
    • China
      • Pricing Analysis
      • Market Share Analysis, 2024
        • By Grade
        • By Application
        • By End Use
        • By Chemical Segment
    • Japan
      • Pricing Analysis
      • Market Share Analysis, 2024
        • By Grade
        • By Application
        • By End Use
        • By Chemical Segment
    • South Korea
      • Pricing Analysis
      • Market Share Analysis, 2024
        • By Grade
        • By Application
        • By End Use
        • By Chemical Segment
    • Russia
      • Pricing Analysis
      • Market Share Analysis, 2024
        • By Grade
        • By Application
        • By End Use
        • By Chemical Segment
    • Poland
      • Pricing Analysis
      • Market Share Analysis, 2024
        • By Grade
        • By Application
        • By End Use
        • By Chemical Segment
    • Hungary
      • Pricing Analysis
      • Market Share Analysis, 2024
        • By Grade
        • By Application
        • By End Use
        • By Chemical Segment
    • Kingdom of Saudi Arabia
      • Pricing Analysis
      • Market Share Analysis, 2024
        • By Grade
        • By Application
        • By End Use
        • By Chemical Segment
    • Turkiye
      • Pricing Analysis
      • Market Share Analysis, 2024
        • By Grade
        • By Application
        • By End Use
        • By Chemical Segment
    • South Africa
      • Pricing Analysis
      • Market Share Analysis, 2024
        • By Grade
        • By Application
        • By End Use
        • By Chemical Segment
  19. Market Structure Analysis
    • Competition Dashboard
    • Competition Benchmarking
    • Market Share Analysis of Top Players
      • By Regional
      • By Grade
      • By Application
      • By End Use
      • By Chemical Segment
  20. Competition Analysis
    • Competition Deep Dive
      • Ineos Phenol
        • Overview
        • Product Portfolio
        • Profitability by Market Segments (Product/Age /Sales Channel/Region)
        • Sales Footprint
        • Strategy Overview
          • Marketing Strategy
          • Product Strategy
          • Channel Strategy
      • Royal Dutch Shell PLC
      • Formosa Chemical and Fibre Corporation
      • Mitsubishi Chemical Corporation
      • ExxonMobil Chemical Company
      • Chevron Phillips Chemical
      • BASF
      • LyondellBasell
      • Cepsa Quimica
      • Altivia Chemicals
      • Sasol Ltd.
      • The Dow Chemical Company
      • Domo Chemicals GmbH
      • SABIC
  21. Assumptions & Acronyms Used
  22. Research Methodology

List of Tables

  • Table 1: Global Market Value (USD Million) Forecast by Region, 2020 to 2035
  • Table 2: Global Market Value (USD Million) Forecast by Grade , 2020 to 2035
  • Table 3: Global Market Value (USD Million) Forecast by Application, 2020 to 2035
  • Table 4: Global Market Value (USD Million) Forecast by End Use, 2020 to 2035
  • Table 5: Global Market Value (USD Million) Forecast by Chemical Segment, 2020 to 2035
  • Table 6: North America Market Value (USD Million) Forecast by Country, 2020 to 2035
  • Table 7: North America Market Value (USD Million) Forecast by Grade , 2020 to 2035
  • Table 8: North America Market Value (USD Million) Forecast by Application, 2020 to 2035
  • Table 9: North America Market Value (USD Million) Forecast by End Use, 2020 to 2035
  • Table 10: North America Market Value (USD Million) Forecast by Chemical Segment, 2020 to 2035
  • Table 11: Latin America Market Value (USD Million) Forecast by Country, 2020 to 2035
  • Table 12: Latin America Market Value (USD Million) Forecast by Grade , 2020 to 2035
  • Table 13: Latin America Market Value (USD Million) Forecast by Application, 2020 to 2035
  • Table 14: Latin America Market Value (USD Million) Forecast by End Use, 2020 to 2035
  • Table 15: Latin America Market Value (USD Million) Forecast by Chemical Segment, 2020 to 2035
  • Table 16: Western Europe Market Value (USD Million) Forecast by Country, 2020 to 2035
  • Table 17: Western Europe Market Value (USD Million) Forecast by Grade , 2020 to 2035
  • Table 18: Western Europe Market Value (USD Million) Forecast by Application, 2020 to 2035
  • Table 19: Western Europe Market Value (USD Million) Forecast by End Use, 2020 to 2035
  • Table 20: Western Europe Market Value (USD Million) Forecast by Chemical Segment, 2020 to 2035
  • Table 21: Eastern Europe Market Value (USD Million) Forecast by Country, 2020 to 2035
  • Table 22: Eastern Europe Market Value (USD Million) Forecast by Grade , 2020 to 2035
  • Table 23: Eastern Europe Market Value (USD Million) Forecast by Application, 2020 to 2035
  • Table 24: Eastern Europe Market Value (USD Million) Forecast by End Use, 2020 to 2035
  • Table 25: Eastern Europe Market Value (USD Million) Forecast by Chemical Segment, 2020 to 2035
  • Table 26: East Asia Market Value (USD Million) Forecast by Country, 2020 to 2035
  • Table 27: East Asia Market Value (USD Million) Forecast by Grade , 2020 to 2035
  • Table 28: East Asia Market Value (USD Million) Forecast by Application, 2020 to 2035
  • Table 29: East Asia Market Value (USD Million) Forecast by End Use, 2020 to 2035
  • Table 30: East Asia Market Value (USD Million) Forecast by Chemical Segment, 2020 to 2035
  • Table 31: South Asia and Pacific Market Value (USD Million) Forecast by Country, 2020 to 2035
  • Table 32: South Asia and Pacific Market Value (USD Million) Forecast by Grade , 2020 to 2035
  • Table 33: South Asia and Pacific Market Value (USD Million) Forecast by Application, 2020 to 2035
  • Table 34: South Asia and Pacific Market Value (USD Million) Forecast by End Use, 2020 to 2035
  • Table 35: South Asia and Pacific Market Value (USD Million) Forecast by Chemical Segment, 2020 to 2035
  • Table 36: Middle East & Africa Market Value (USD Million) Forecast by Country, 2020 to 2035
  • Table 37: Middle East & Africa Market Value (USD Million) Forecast by Grade , 2020 to 2035
  • Table 38: Middle East & Africa Market Value (USD Million) Forecast by Application, 2020 to 2035
  • Table 39: Middle East & Africa Market Value (USD Million) Forecast by End Use, 2020 to 2035
  • Table 40: Middle East & Africa Market Value (USD Million) Forecast by Chemical Segment, 2020 to 2035

List of Figures

  • Figure 1: Global Market Pricing Analysis
  • Figure 2: Global Market Value (USD Million) Forecast 2020-2035
  • Figure 3: Global Market Value Share and BPS Analysis by Grade , 2025 and 2035
  • Figure 4: Global Market Y-o-Y Growth Comparison by Grade , 2025-2035
  • Figure 5: Global Market Attractiveness Analysis by Grade
  • Figure 6: Global Market Value Share and BPS Analysis by Application, 2025 and 2035
  • Figure 7: Global Market Y-o-Y Growth Comparison by Application, 2025-2035
  • Figure 8: Global Market Attractiveness Analysis by Application
  • Figure 9: Global Market Value Share and BPS Analysis by End Use, 2025 and 2035
  • Figure 10: Global Market Y-o-Y Growth Comparison by End Use, 2025-2035
  • Figure 11: Global Market Attractiveness Analysis by End Use
  • Figure 12: Global Market Value Share and BPS Analysis by Chemical Segment, 2025 and 2035
  • Figure 13: Global Market Y-o-Y Growth Comparison by Chemical Segment, 2025-2035
  • Figure 14: Global Market Attractiveness Analysis by Chemical Segment
  • Figure 15: Global Market Value (USD Million) Share and BPS Analysis by Region, 2025 and 2035
  • Figure 16: Global Market Y-o-Y Growth Comparison by Region, 2025-2035
  • Figure 17: Global Market Attractiveness Analysis by Region
  • Figure 18: North America Market Incremental Dollar Opportunity, 2025-2035
  • Figure 19: Latin America Market Incremental Dollar Opportunity, 2025-2035
  • Figure 20: Western Europe Market Incremental Dollar Opportunity, 2025-2035
  • Figure 21: Eastern Europe Market Incremental Dollar Opportunity, 2025-2035
  • Figure 22: East Asia Market Incremental Dollar Opportunity, 2025-2035
  • Figure 23: South Asia and Pacific Market Incremental Dollar Opportunity, 2025-2035
  • Figure 24: Middle East & Africa Market Incremental Dollar Opportunity, 2025-2035
  • Figure 25: North America Market Value Share and BPS Analysis by Country, 2025 and 2035
  • Figure 26: North America Market Value Share and BPS Analysis by Grade , 2025 and 2035
  • Figure 27: North America Market Y-o-Y Growth Comparison by Grade , 2025-2035
  • Figure 28: North America Market Attractiveness Analysis by Grade
  • Figure 29: North America Market Value Share and BPS Analysis by Application, 2025 and 2035
  • Figure 30: North America Market Y-o-Y Growth Comparison by Application, 2025-2035
  • Figure 31: North America Market Attractiveness Analysis by Application
  • Figure 32: North America Market Value Share and BPS Analysis by End Use, 2025 and 2035
  • Figure 33: North America Market Y-o-Y Growth Comparison by End Use, 2025-2035
  • Figure 34: North America Market Attractiveness Analysis by End Use
  • Figure 35: North America Market Value Share and BPS Analysis by Chemical Segment, 2025 and 2035
  • Figure 36: North America Market Y-o-Y Growth Comparison by Chemical Segment, 2025-2035
  • Figure 37: North America Market Attractiveness Analysis by Chemical Segment
  • Figure 38: Latin America Market Value Share and BPS Analysis by Country, 2025 and 2035
  • Figure 39: Latin America Market Value Share and BPS Analysis by Grade , 2025 and 2035
  • Figure 40: Latin America Market Y-o-Y Growth Comparison by Grade , 2025-2035
  • Figure 41: Latin America Market Attractiveness Analysis by Grade
  • Figure 42: Latin America Market Value Share and BPS Analysis by Application, 2025 and 2035
  • Figure 43: Latin America Market Y-o-Y Growth Comparison by Application, 2025-2035
  • Figure 44: Latin America Market Attractiveness Analysis by Application
  • Figure 45: Latin America Market Value Share and BPS Analysis by End Use, 2025 and 2035
  • Figure 46: Latin America Market Y-o-Y Growth Comparison by End Use, 2025-2035
  • Figure 47: Latin America Market Attractiveness Analysis by End Use
  • Figure 48: Latin America Market Value Share and BPS Analysis by Chemical Segment, 2025 and 2035
  • Figure 49: Latin America Market Y-o-Y Growth Comparison by Chemical Segment, 2025-2035
  • Figure 50: Latin America Market Attractiveness Analysis by Chemical Segment
  • Figure 51: Western Europe Market Value Share and BPS Analysis by Country, 2025 and 2035
  • Figure 52: Western Europe Market Value Share and BPS Analysis by Grade , 2025 and 2035
  • Figure 53: Western Europe Market Y-o-Y Growth Comparison by Grade , 2025-2035
  • Figure 54: Western Europe Market Attractiveness Analysis by Grade
  • Figure 55: Western Europe Market Value Share and BPS Analysis by Application, 2025 and 2035
  • Figure 56: Western Europe Market Y-o-Y Growth Comparison by Application, 2025-2035
  • Figure 57: Western Europe Market Attractiveness Analysis by Application
  • Figure 58: Western Europe Market Value Share and BPS Analysis by End Use, 2025 and 2035
  • Figure 59: Western Europe Market Y-o-Y Growth Comparison by End Use, 2025-2035
  • Figure 60: Western Europe Market Attractiveness Analysis by End Use
  • Figure 61: Western Europe Market Value Share and BPS Analysis by Chemical Segment, 2025 and 2035
  • Figure 62: Western Europe Market Y-o-Y Growth Comparison by Chemical Segment, 2025-2035
  • Figure 63: Western Europe Market Attractiveness Analysis by Chemical Segment
  • Figure 64: Eastern Europe Market Value Share and BPS Analysis by Country, 2025 and 2035
  • Figure 65: Eastern Europe Market Value Share and BPS Analysis by Grade , 2025 and 2035
  • Figure 66: Eastern Europe Market Y-o-Y Growth Comparison by Grade , 2025-2035
  • Figure 67: Eastern Europe Market Attractiveness Analysis by Grade
  • Figure 68: Eastern Europe Market Value Share and BPS Analysis by Application, 2025 and 2035
  • Figure 69: Eastern Europe Market Y-o-Y Growth Comparison by Application, 2025-2035
  • Figure 70: Eastern Europe Market Attractiveness Analysis by Application
  • Figure 71: Eastern Europe Market Value Share and BPS Analysis by End Use, 2025 and 2035
  • Figure 72: Eastern Europe Market Y-o-Y Growth Comparison by End Use, 2025-2035
  • Figure 73: Eastern Europe Market Attractiveness Analysis by End Use
  • Figure 74: Eastern Europe Market Value Share and BPS Analysis by Chemical Segment, 2025 and 2035
  • Figure 75: Eastern Europe Market Y-o-Y Growth Comparison by Chemical Segment, 2025-2035
  • Figure 76: Eastern Europe Market Attractiveness Analysis by Chemical Segment
  • Figure 77: East Asia Market Value Share and BPS Analysis by Country, 2025 and 2035
  • Figure 78: East Asia Market Value Share and BPS Analysis by Grade , 2025 and 2035
  • Figure 79: East Asia Market Y-o-Y Growth Comparison by Grade , 2025-2035
  • Figure 80: East Asia Market Attractiveness Analysis by Grade
  • Figure 81: East Asia Market Value Share and BPS Analysis by Application, 2025 and 2035
  • Figure 82: East Asia Market Y-o-Y Growth Comparison by Application, 2025-2035
  • Figure 83: East Asia Market Attractiveness Analysis by Application
  • Figure 84: East Asia Market Value Share and BPS Analysis by End Use, 2025 and 2035
  • Figure 85: East Asia Market Y-o-Y Growth Comparison by End Use, 2025-2035
  • Figure 86: East Asia Market Attractiveness Analysis by End Use
  • Figure 87: East Asia Market Value Share and BPS Analysis by Chemical Segment, 2025 and 2035
  • Figure 88: East Asia Market Y-o-Y Growth Comparison by Chemical Segment, 2025-2035
  • Figure 89: East Asia Market Attractiveness Analysis by Chemical Segment
  • Figure 90: South Asia and Pacific Market Value Share and BPS Analysis by Country, 2025 and 2035
  • Figure 91: South Asia and Pacific Market Value Share and BPS Analysis by Grade , 2025 and 2035
  • Figure 92: South Asia and Pacific Market Y-o-Y Growth Comparison by Grade , 2025-2035
  • Figure 93: South Asia and Pacific Market Attractiveness Analysis by Grade
  • Figure 94: South Asia and Pacific Market Value Share and BPS Analysis by Application, 2025 and 2035
  • Figure 95: South Asia and Pacific Market Y-o-Y Growth Comparison by Application, 2025-2035
  • Figure 96: South Asia and Pacific Market Attractiveness Analysis by Application
  • Figure 97: South Asia and Pacific Market Value Share and BPS Analysis by End Use, 2025 and 2035
  • Figure 98: South Asia and Pacific Market Y-o-Y Growth Comparison by End Use, 2025-2035
  • Figure 99: South Asia and Pacific Market Attractiveness Analysis by End Use
  • Figure 100: South Asia and Pacific Market Value Share and BPS Analysis by Chemical Segment, 2025 and 2035
  • Figure 101: South Asia and Pacific Market Y-o-Y Growth Comparison by Chemical Segment, 2025-2035
  • Figure 102: South Asia and Pacific Market Attractiveness Analysis by Chemical Segment
  • Figure 103: Middle East & Africa Market Value Share and BPS Analysis by Country, 2025 and 2035
  • Figure 104: Middle East & Africa Market Value Share and BPS Analysis by Grade , 2025 and 2035
  • Figure 105: Middle East & Africa Market Y-o-Y Growth Comparison by Grade , 2025-2035
  • Figure 106: Middle East & Africa Market Attractiveness Analysis by Grade
  • Figure 107: Middle East & Africa Market Value Share and BPS Analysis by Application, 2025 and 2035
  • Figure 108: Middle East & Africa Market Y-o-Y Growth Comparison by Application, 2025-2035
  • Figure 109: Middle East & Africa Market Attractiveness Analysis by Application
  • Figure 110: Middle East & Africa Market Value Share and BPS Analysis by End Use, 2025 and 2035
  • Figure 111: Middle East & Africa Market Y-o-Y Growth Comparison by End Use, 2025-2035
  • Figure 112: Middle East & Africa Market Attractiveness Analysis by End Use
  • Figure 113: Middle East & Africa Market Value Share and BPS Analysis by Chemical Segment, 2025 and 2035
  • Figure 114: Middle East & Africa Market Y-o-Y Growth Comparison by Chemical Segment, 2025-2035
  • Figure 115: Middle East & Africa Market Attractiveness Analysis by Chemical Segment
  • Figure 116: Global Market - Tier Structure Analysis
  • Figure 117: Global Market - Company Share Analysis
Dashboard
Dashboard
Dashboard
Dashboard
Dashboard
Dashboard

Full Research Suite comprises of:

Market outlook & trends analysis

Market outlook & trends analysis

Interviews & case studies

Interviews & case studies

Strategic recommendations

Strategic recommendations

Vendor profiles & capabilities analysis

Vendor profiles & capabilities analysis

5-year forecasts

5-year forecasts

8 regions and 60+ country-level data splits

8 regions and 60+ country-level data splits

Market segment data splits

Market segment data splits

12 months of continuous data updates

12 months of continuous data updates

DELIVERED AS:

PDF EXCEL ONLINE

Full Research Suite


$5000

$7500

$10000

Buy Report Now
Similar Industry Reports

Similar Industry Reports

Diacetone Alcohol Market

Diacetone Alcohol Market Size and Share Forecast Outlook 2025 to 2035

Diacetone Glucose Market

Diacetone Glucose Market Size and Share Forecast Outlook 2025 to 2035

Acetylacetone Market

Acetylacetone Market Size and Share Forecast Outlook 2025 to 2035

Future Market Insights

Acetone Market

Chat With MaRIA

Chat With

MaRIA

Hi There, I am MaRIA, Your Market Research Intelligence Assistant. How may I help you?