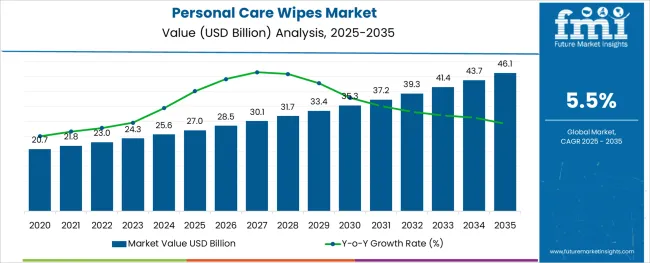
The Personal Care Wipes Market is estimated to be valued at USD 27.0 billion in 2025 and is projected to reach USD 46.1 billion by 2035, registering a compound annual growth rate (CAGR) of 5.5% over the forecast period.

The alginic acid market is undergoing consistent growth, propelled by rising demand from food processing, pharmaceutical formulations, and cosmetic applications. A growing focus on natural and sustainable ingredients in manufacturing processes has positioned alginic acid as a preferred biopolymer across industries.
The market is further supported by its diverse functional benefits, including water retention, gelling, and stabilizing properties, which make it indispensable in high-performance formulations. Increased regulatory acceptance of alginates as safe additives and the push towards cleaner labeling in food and personal care products have reinforced their adoption.
Ongoing innovation in extraction technologies and the utilization of algae as a renewable resource are paving the way for cost-effective production and expanded applications, ensuring sustained market expansion in the coming years.
The market is segmented by Product and Distribution Channel and region. By Product, the market is divided into Cosmetic & Facial Wipes and Flushable Wipes. In terms of Distribution Channel, the market is classified into Supermarkets, E-commerce, and Hypermarkets. Regionally, the market is classified into North America, Latin America, Western Europe, Eastern Europe, Balkan & Baltic Countries, Russia & Belarus, Central Asia, East Asia, South Asia & Pacific, and the Middle East & Africa.
When segmented by salts, sodium alginate is expected to command 27.5 % of the market revenue in 2025, marking it as the leading subsegment in this category. This leadership has been driven by its superior solubility, ease of incorporation into formulations, and versatility in a wide range of applications.
Its ability to form stable gels and maintain viscosity under varying conditions has made it highly sought after in both food and pharmaceutical sectors. Manufacturers have prioritized sodium alginate due to its consistent performance, cost-effectiveness, and regulatory acceptance, which have collectively strengthened its position.
The segment’s prominence has also been enhanced by its adaptability to evolving consumer preferences for plant-derived and sustainable ingredients, reinforcing its market share.
Segmented by end user industry, the food industry is projected to hold 33.0 % of the market revenue in 2025, positioning it as the most prominent sector. This dominance has been shaped by the industry’s increasing reliance on alginic acid and its derivatives to deliver desirable textures, stabilize emulsions, and improve shelf life of processed foods.
As consumer demand for clean label and natural additives has intensified, the food sector has responded by integrating alginates into bakery, dairy, and confectionery products. Enhanced production efficiency and compliance with food safety standards have further encouraged widespread use.
The segment’s leadership has also been supported by product differentiation strategies where alginates contribute to premium quality and innovation, securing their role in modern food formulations.
Based on product segment, the global personal care wipes market is categorized into facial & cosmetic, flushable wipes, baby wipes, and hand & body wipe. Among all, baby wipes dominate the global personal care wipes market size during the forecast period. Baby wipes are expected to gain a significant share of more than 50% during the forecast period. Due to growing concerns about the skin of infants, chemical resistance and taking precautions towards sensitive skin are fueling the demand for baby wipes during the forecast period. These wipes are probably more popular among parents, and several reputable brands are competing to gain market share in the upcoming years.
On the other hand, flushable wipes are expected to be the fastest-growing wipes during the forecast period. The market for flushable wipes is expected to increase in recent years due to skin-protective antibacterial and deodorizing wipes. Additionally, due to their improved cleaning and refreshing quality, the usage of these wipes is likely to expand the adoption of flushable wipes in recent years. It replaces outdated toilet paper, which is anticipated to boost market expansion.
Based on the distribution channel segment, the global personal care wipes market is categorized into supermarkets, hypermarkets, and e-commerce, among others. The supermarkets are likely to dominate the market by securing nearly 33% of the share during the forecast period. The supermarket business has been expanding in recent years due to the availability of numerous products at reasonable prices in an easily structured manner for consumers. Moreover, receiving huge discounts on products will attract more consumers, who, on the other hand, are likely to fuel the market growth over the forecast period.


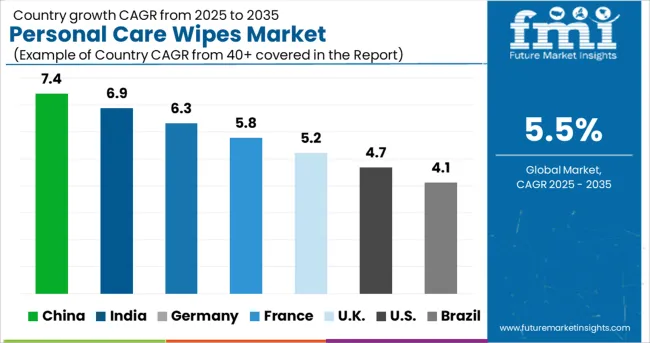
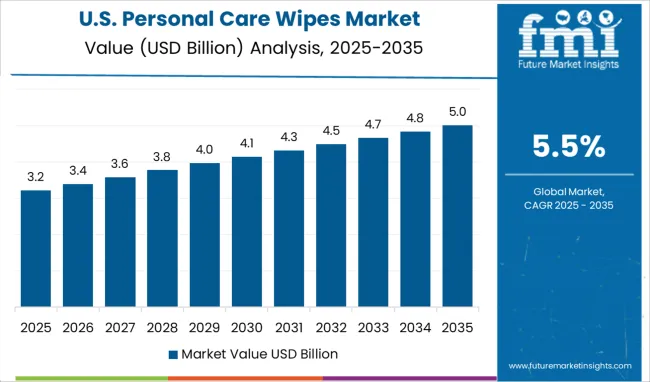
The North American personal care wipes market is leading the global market due to capturing the maximum share during the forecast period. The USA is the leading country in the region that secured a significant share due to growing consumer awareness, hygiene, and health consciousness during the forecast period. Additionally, the availability of a wide range of personal care products is supporting the growth of the USA personal care wipes market over the course of the forecast period.
The European market is capturing a significant share during the forecast period. The United Kingdom's personal care wipes market is led by a growing population and developing economies during the forecast period. Moreover, the number of key players innovating several products for infant babies is growing the demand for baby personal care wipes in the United Kingdom personal care wipes market size.
The Asia Pacific market is one of the fastest-growing regions in the global market during the forecast period.
Due to rising skin diseases and infections, Korea is one of the main countries in the region that contributes a sizable share of the global market for personal care wipes. During the forecasted period. The market for Korean personal care wipes will rise due to rising purchasing power, expanding urbanization, and improved industrial infrastructure.
Japan's personal care wipes market is another leader in the region that recorded the maximum share during the forecast period. The rising disposable income of females and rising skincare awareness by consumers are accelerating the demand for personal care wipes during the forecast period. Several key players are growing the market size by adopting various marketing tactics in recent years.
How are the Start-up Companies Innovating Products that Add Value in the Global Market for Personal Care Wipes?
Personal care wipes start-up companies are popping up in the market during the forecast period. Several key market manufacturers are making innovations with these start-ups to launch new products in the market. They are developing advanced technology and unique trends that attract consumers' requirements. Some of the start-ups in the market are as follows:
Carell is a start-up company that provides skin-friendly and gentle personal care wipes to improve hygiene among consumers. They offer distinctive moisturizers that support glowing skin. Additionally, in recent years, the market has seen great success with wipes created by them. Moreover, they make products that are free of alcohol and have been dermatologist-tested. To combat dryness and dehydrate the skin. However, they also added vitamin E and aloe vera gel extracts.
Some start-up companies are making pH-level personal care wipes for genital skin care, which has increased the demand for personal care wipes in recent years. These start-ups are making customized, soft, and premium quality wipes as per consumers' requirements. Moreover, they offer these products to different skin types all around the globe during the forecast period. The use of personal care wipes has increased recently due to innovations, including the addition of honey, aloe vera, and rose water extracts for refreshing effects and skin hydration.

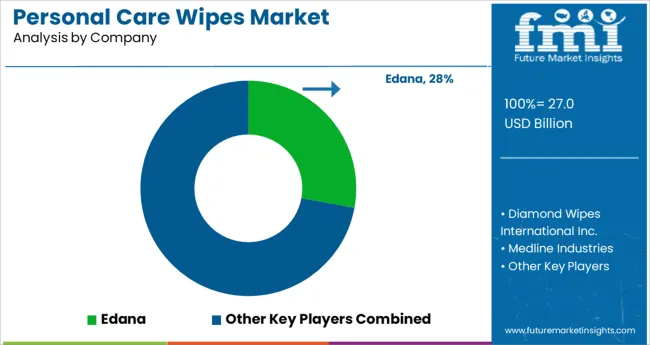
The market is fragmented by the number of key players present in the global market during the forecast period. These key players are adopting several marketing tactics to acquire the lion’s share of the market. Some of the marketing methodologies are mergers, partnerships, acquisitions, collaborations, product launches, and global expansion, among others.
These market players are developing products by making lots of effort as per customers' needs. From developing premium quality products to convenient packaging, these players are playing a vital role in the market during the foreseen time. In addition, growing fragrance wipes innovations are growing the sales of personal care wipes in recent years. Some of the recent developments in the market are:
Recent Developments in the Market for Personal Care Wipes
Some of the prominent key players in the market are
The global personal care wipes market is estimated to be valued at USD 27.0 billion in 2025.
It is projected to reach USD 46.1 billion by 2035.
The market is expected to grow at a 5.5% CAGR between 2025 and 2035.
The key product types are cosmetic & facial wipes and flushable wipes.
supermarkets segment is expected to dominate with a 46.3% industry share in 2025.


Full Research Suite comprises of:
Market outlook & trends analysis
Interviews & case studies
Strategic recommendations
Vendor profiles & capabilities analysis
5-year forecasts
8 regions and 60+ country-level data splits
Market segment data splits
12 months of continuous data updates
DELIVERED AS:
PDF EXCEL ONLINE
Personal Emergency Response System (PERS) Market Size and Share Forecast Outlook 2025 to 2035
Personal Protective Equipment Market Size and Share Forecast Outlook 2025 to 2035
Personality Assessment Solution Market Size and Share Forecast Outlook 2025 to 2035
Personalized Immunotherapy Market Size and Share Forecast Outlook 2025 to 2035
Personal Navigation Devices Market Size and Share Forecast Outlook 2025 to 2035
Personal Genome Testing Market Size and Share Forecast Outlook 2025 to 2035
Personal Watercraft Jet Ski Market Size and Share Forecast Outlook 2025 to 2035
Personalized Packaging Market Size and Share Forecast Outlook 2025 to 2035
Personalized Toys Market Size and Share Forecast Outlook 2025 to 2035
Personalized Nutrition Market - Size, Share, and Forecast Outlook 2025 to 2035
Personal Watercraft Market Growth - Trends & Forecast 2025 to 2035
Personal Mobility Devices Market Analysis - Trends, Growth & Forecast 2025 to 2035
Personalized Beauty Devices Market Trends - Growth & Forecast 2025 to 2035
Personalized Bakery Products Market Analysis by Product Type, Price Range, Sales Channel, End-User and Region 2025 to 2035
Personal CRM Market Report - Growth & Forecast 2025 to 2035
Personalized Medicine Market is segmented by Personalized Medicine Diagnostics, Medicine Therapeutics, and Medical Care from 2025 to 2035
Personal Fitness Trainer Market - Trends, Growth & Forecast 2025 to 2035
Personalized Home Decor Market Insights & Forecast 2024-2034
Personal Protective Gloves Market
Personal Protective Equipment Packaging Market

Thank you!
You will receive an email from our Business Development Manager. Please be sure to check your SPAM/JUNK folder too.
Chat With
MaRIA