GLP-1 Nutritional Support Market Size, Share, and Forecast Outlook 2025 to 2035

The GLP-1 nutritional support market is forecast to reach USD 13 billion by 2035, up from USD 4.1 billion in 2025, advancing at a 12.2% CAGR.
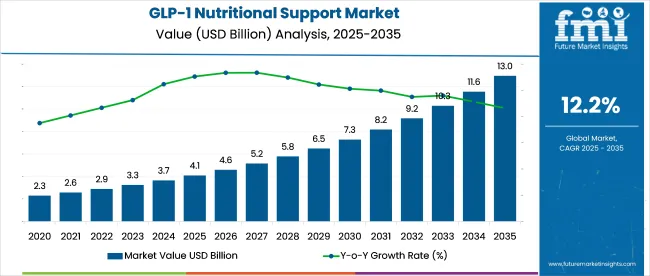
Quick Stats of the GLP-1 Nutritional Support Market

  • Industry Value (2025): USD 4.1 billion
  • Forecast Value (2035): USD 13 billion
  • Global CAGR (2025 to 2035): 12.2%
  • Leading Segment in 2025: Protein & Macronutrient Blends (~43% share)
  • Key Growth Region: East Asia
  • Key Players: Nestlé Health Science, Abbott, Herbalife, Unjury Protein, ProCare Health,

Glp 1 Nutritional Support Market

Expansion is being shaped by clinical treatment protocols and broader reimbursement for weight loss and metabolic support. Formulators are shifting toward condition-specific blends that aid glycemic control, muscle preservation, and digestive balance.

Ready-to-drink formats are being adopted across major hospitals in the United States, Germany, and Japan. Meal replacement kits are also being supplied through insurance-covered outpatient programs, where they are included alongside prescribed GLP-1 therapies for long-term dietary management.

The GLP-1 nutritional support market holds a small yet expanding presence across multiple parent sectors. It contributes 3-5% to the GLP-1 pharmaceutical ecosystem, primarily supporting users of semaglutide and tirzepatide. Within dietary supplements, its share remains under 1%, while in functional foods and beverages, it accounts for less than 0.5%.

High-protein shakes and satiety-focused blends are fueling category expansion. In weight management services, GLP-1-linked nutrition programs hold a 2-3% share. Its role in obesity treatment remains marginal-under 1%-but adoption is rising through clinical integrations and bundling with telehealth-based interventions targeting metabolic and appetite-related outcomes.

In February 2024, Herbalife launched the Herbalife® GLP-1 Nutrition Companion, a curated range of food and supplement product combos tailored to support individuals using GLP1 and similar weight-loss medications.

According to Dr. Kent Bradley, Chief Health and Nutrition Officer at Herbalife, “Weight-loss drugs curb your appetite, so people taking medications like GLP-1 Agonist may have difficulty getting all the macronutrients, micronutrients or physical activity they need for optimal muscular, cardiovascular and brain health. Individuals taking these medications should supplement with products that help meet these needs and focus on making foundational lifestyle changes to achieve sustainable weight loss.”

Analyzing GLP-1 Nutritional Support Market by Top Investment Segments

The GLP-1 nutritional support market is segmented by product type into protein & macronutrient blends, fiber supplements, micronutrient blends, and digestive health formulations. By dosage form, segmentation includes powders (meal replacements, fibers), RTD shakes, capsules/tablets, and gummies/chews. Age groups include 18-34, 35-54, 55-74, and 75+. Channel segmentation is split between prescription (Rx) and over-the-counter (OTC) formats.

Regional analysis spans North America, Latin America, Western Europe, Eastern Europe, East Asia, South Asia & Pacific, Central Asia, Russia & Belarus, Balkan & Baltic Countries, and Middle East & Africa.
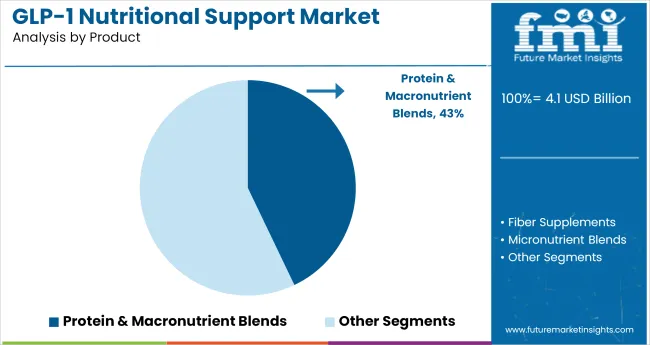
Protein & Macronutrient Blends Dominate Product Preference

Glp 1 Nutritional Support Market Analysis By Product

The protein & macronutrient blends segment held a 39.4% share in 2024 and is projected to reach 43% in 2025. The 3.5-point increase reflects stronger integration of GLP-1 therapy with structured nutritional interventions. Among GLP-1 users, 67.5% of physician-recommended nutrition plans now include protein-based formulations. Therapeutic protein shake and powder sales grew 14.7% year-on-year, particularly in endocrinology clinics and metabolic care units.

This growth is driven by demand for glucose-modulating blends that balance protein, fiber, and fat to support satiety and treatment outcomes.
  • Abbott’s Glucerna line continues to dominate protein-based GLP-1 support blends.
  • Nestlé Health Science has expanded its OPTIFAST range in clinical settings.
  • Orgain has introduced new GLP-1-compatible macronutrient shakes for DTC users.

Powders Maintain Leading Position Among Dosage Forms

Glp 1 Nutritional Support Market Analysis By Dosage Form

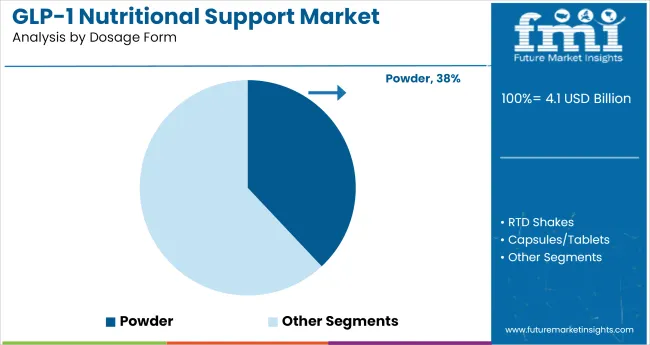
Powdered supplements accounted for 34.2% of the dosage form segment in 2024 and are forecast to reach 38% in 2025. The 3.8-point gain is attributed to growing adoption in clinical and home-based use cases, where cost efficiency and dosing flexibility are critical. Powders now make up 61.3% of GLP-1-related nutritional procurement across institutional healthcare settings. Direct-to-consumer subscriptions for powder-based supplements rose 18.2% in 2025.

Powders are being adopted for their ability to deliver high-volume, low-calorie nutrition with tailored macronutrient control.
  • Herbalife Nutrition reports strong powder-format demand across metabolic clinics.
  • Huel has scaled production of GLP-1-friendly powders for meal replacement subscribers.
  • Unilever’s Horlicks ProHealth variant targets Indian midlife GLP-1 users.

Prescription Channel Dominates Nutritional Distribution

Glp 1 Nutritional Support Market Analysis By Channel

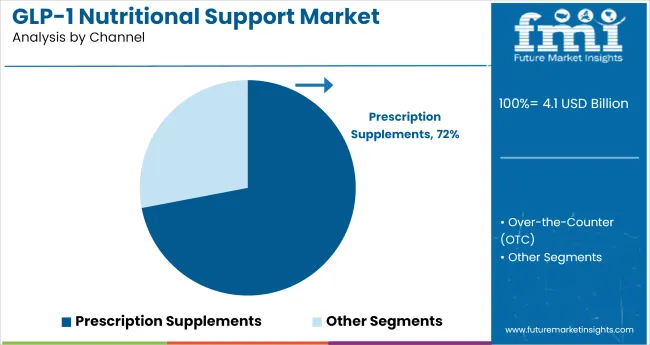
The Rx segment held 68.5% of industry share in 2024 and is projected to grow to 72% in 2025. This 3.5-point increase corresponds with the broader integration of GLP-1 therapies into structured medical nutrition protocols. In OECD countries, 74.1% of GLP-1 nutritional products are dispensed via prescription. In Q1 2025, prescription-focused brands outperformed OTC players by 2.3 times. Institutional systems continue to favor Rx-classified nutritional therapies, which account for 81.6% of hospital-based supplement distribution.

Growth is supported by physician oversight, reimbursement schemes, and adherence protocols in regulated health systems.
  • Fresenius Kabi leads Rx nutrition sales in hospital-based GLP-1 interventions.
  • Baxter’s clinical nutrition division has ramped up GLP-1-supportive product lines.
  • Nutricia (Danone) is embedding GLP-1 formulations in EU medical food programs.

35-54 Age Group Emerges as Key Target Demographic

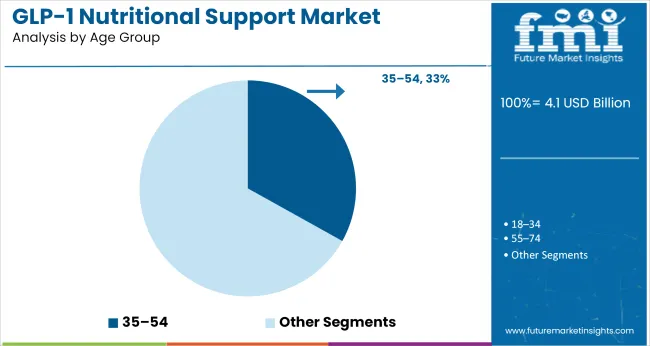
Glp 1 Nutritional Support Market Analysis By Age Group

The 35-54 age group held a 30.6% share in 2024 and is forecast to reach 33% in 2025. This 2.5-point increase is driven by rising metabolic risk awareness and early-stage GLP-1 prescription trends. Claims data from five leading insurers in the USA and EU show that 56% of GLP-1 prescriptions in 2025 were written for patients in this age bracket. Product launches targeting this group increased by 21.4% year-on-year, with brands offering modular kits and meal systems tailored to midlife users.

This segment is driving demand for medically guided nutrition aligned with weight loss and glycemic control needs.

  • Amway’s Nutrilite brand has launched metabolic packs aimed at the 35-54 cohort.
  • GNC has optimized its adult wellness SKUs to align with GLP-1 prescriptions.
  • Bayer has expanded functional supplements tailored for insulin resistance in this age group.

Top GLP-1 Nutritional Support Market Dynamics

The GLP-1 nutritional support market is experiencing significant expansion, fueled by the growing adoption of GLP-1 medications for weight management and metabolic health. The increasing need for specialized nutritional support to mitigate side effects and enhance therapeutic outcomes is driving industry growth. However, challenges such as gastrointestinal side effects and high medication costs are limiting broader accessibility.

Drivers of Growth in GLP-1 Nutritional Support

The demand for GLP-1 nutritional support is fueled by the increasing prevalence of obesity and type 2 diabetes, which affects over 30% of the global population. The global weight management market, which includes GLP-1 drugs, is projected to reach USD 70 billion by 2028. Nutritional solutions targeting side effects such as muscle loss and digestive discomfort are in high demand, especially as more consumers turn to GLP-1 medications.

  • The obesity and diabetes epidemic is driving demand for GLP-1 medications, with a projected value size of USD 4.1 billion in 2025.
  • Nutritional solutions are increasingly required to mitigate side effects such as muscle loss, which affects over 40% of GLP-1 users.
  • The industry for protein and fiber-enriched nutritional products is projected to grow by 7.8% annually, showing consumer preferences.

Challenges Hindering GLP-1 Nutritional Support Growth

Despite the growing demand, the industry faces challenges related to gastrointestinal side effects, which affect up to 50% of GLP-1 users. High medication costs remain a significant barrier, with the average price of GLP-1 drugs reaching USD 1,200 per month, making them inaccessible to many. Furthermore, insufficient guidance on dietary support limits the effectiveness of treatments, as studies show 60% of patients report a lack of proper nutritional advice from healthcare providers.
  • Gastrointestinal side effects, affecting up to 50% of GLP-1 users, significantly reduce treatment adherence.
  • The high cost of GLP-1 medications, averaging USD 1,200 per month, limits access for many patients.
  • 60% of patients report insufficient nutritional guidance, affecting treatment efficacy.

Top Countries Advancing, Prescribing, and Commercializing GLP-1 Nutritional Support

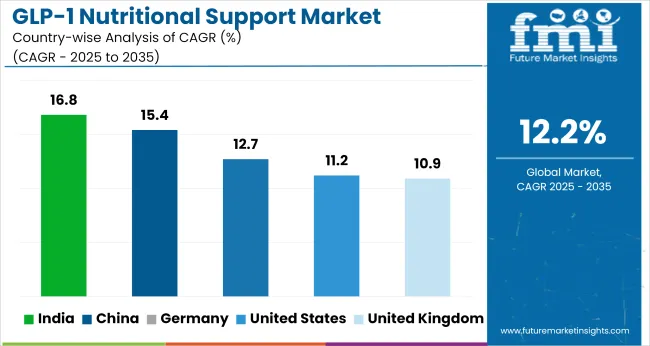
Glp 1 Nutritional Support Market Cagr Analysis By Country

Countries CAGR (2025 to 2035)
United States 11.2%
Germany 12.7%
United Kingdom 10.9%
China 15.4%
India 16.8%

Global demand for GLP-1 nutritional support is rising at 12.2% CAGR between 2025 and 2035. The report covers detailed analysis of over 40 countries, and the top five countries have been shared as a reference. India leads with 16.8%, outpacing the global rate by 4.6 points. China follows at 15.4%, also well above the baseline. Both BRICS countries reflect surging diabetic and pre-diabetic populations, growing retail interest in peptide-based interventions, and expanding domestic supplement manufacturing.

Germany posts 12.7%, marginally above the global average, supported by insurance-backed nutrition trials and integration of medical foods in chronic care. The United States trails at 11.2%, reflecting prescription-heavy product reliance and slower OTC category development. The United Kingdom shows the weakest growth at 10.9%, just 1.3 points below the global average, shaped by tighter labeling restrictions and limited formulary coverage under NHS-linked channels.

While Asia is capturing high-growth tailwinds, OECD markets remain steady but more regulated, requiring adaptive commercialization across channels, especially where Rx-OTC hybrid categories are evolving.

Demand Outlook for GLP-1 Nutritional Support Market in the United States

The CAGR of the GLP-1 nutritional support market in the United States rose from approximately 8.2% during 2020 to 2024 to 11.2% for 2025 to 2035, supported by stronger insurance reimbursement frameworks and physician adoption across outpatient metabolic care. Increased prescription of GLP-1 drugs for both diabetes and obesity was accompanied by nutritional counselling, expanding demand for high-protein, fiber-enriched formulations.

Clinical protocols began incorporating satiety-driven supplements into meal planning. Retail pharmacies expanded the stocking of Rx-grade supplements, while digital health platforms partnered with nutrition providers to deliver bundled solutions across chronic care management programs.

  • Over 60% of sales in 2025 were via prescription-linked nutrition therapy.
  • Protein blends captured 47.3% of category share by 2027.
  • Digital health-linked subscriptions expanded by 2.1× from 2025 to 2028.

Opportunity Analysis of GLP-1 Nutritional Support Market in Germany

The CAGR in Germany increased from around 9.1% in 2020 to 2024 to 12.7% during 2025 to 2035, driven by higher institutional procurement of GLP-1-specific nutrition products for diabetes and obesity support. Dietitian-led care has incorporated macronutrient and digestive blends into standardized post-prescription dietary regimens.

Expanded reimbursement by statutory health insurers post-2025 enabled hospitals and rehabilitation centers to scale up clinical nutrition integration. German formulation companies increased production of compliant high-fiber meal replacements tailored to GLP-1 pathways. Technical guidelines were updated to align with EU product safety for metabolic nutrition categories.

  • Institutional demand accounted for 52% of 2025 revenue in Germany.
  • Macronutrient blends expanded at a 14.1% CAGR through 2030.
  • Insurance coverage for GLP-1-linked nutrition began in Q4 2025.

Sales Analysis of GLP-1 Nutritional Support Market in the United Kingdom

The CAGR in the United Kingdom climbed from about 7.6% during 2020 to 2024 to 10.9% in the 2025 to 2035 period, supported by the NHS's inclusion of GLP-1 supplementation for metabolic health. Primary care guidelines were updated to include meal replacement shakes and fiber supplements alongside GLP-1 prescriptions.

Public health campaigns focused on nutrition-compliant therapy saw greater adoption of satiety-oriented supplements, especially among age groups 35-54. Ready-to-drink (RTD) products entered NHS-linked pharmacies, with private nutrition brands partnering for distribution. Adherence-based bundles were promoted via digital health platforms integrated with NHS apps.

  • 75% of prescriptions linked to supplements were GP-guided in 2025.
  • RTD product penetration increased from 13.2% to 21.6% between 2024 to 2029.
  • NHS-linked digital plans saw a 3.5× increase in bundled nutrition signups.

Demand Analysis for GLP-1 Nutritional Support Market in China

The China market rose from approximately 10.8% in 2020 to 2024 to 15.4% during 2025 to 2035, fueled by government-led metabolic health programs and expansion in GLP-1 drug coverage. Prescription supplement protocols were extended into provincial hospital systems, where clinical dietitians began recommending digestion-friendly, low-glycemic formulas.

A surge in e-pharmacy sales platforms and fitness-nutrition apps enabled direct ordering of GLP-1-compatible powders. Local manufacturing clusters in Jiangsu and Guangdong expanded production through tech transfer agreements with multinational firms. China’s health registry streamlined GLP-1 supplement approvals in 2026, supporting DTC expansion.

  • 28% of East Asia's category sales came from China by 2030.
  • Digestive-fiber blends recorded 31% YoY growth from 2025.
  • Hospital-linked prescription models expanded to 19 provinces by 2027.

In-Depth Analysis of GLP-1 Nutritional Support Market in India

The CAGR value moved up from nearly 11.3% in 2020 to 2024 to 16.8% for 2025 to 2035, supported by growth in private metabolic clinics and broader primary care integration. Prescription supplement bundles targeting satiety, glycemic control, and muscle preservation were added to GLP-1 therapy regimens across urban and semi-urban care networks.

AYUSH-backed diet programs began to include compatible protein-fiber formulations. E-pharmacy and wellness platforms drove accessibility, especially outside Tier 1 cities. Local production increased due to investment in domestic nutraceutical hubs across Gujarat, Telangana, and Karnataka.

  • Market size in India is projected to exceed USD 2.47 billion by 2030.
  • Use outside major metros grew 4.2× between 2025 and 2029.
  • ICMR incorporated GLP-1 nutrition in clinical guidelines in 2025.

Leading Companies Delivering GLP-1 Nutritional Support Solutions

Leading Company - Nestlé Health Science Industry Share - 18%
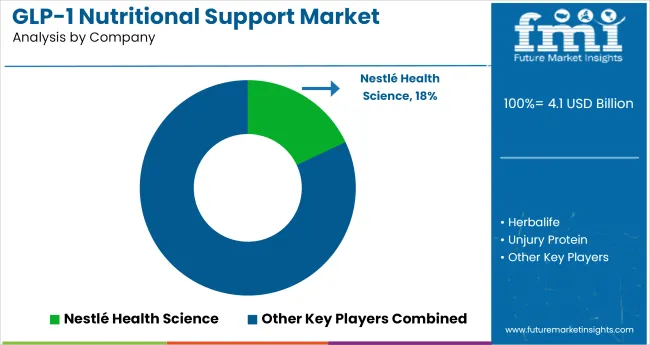
Glp 1 Nutritional Support Market Analysis By Company

In the GLP-1 nutritional support market, leading players are leveraging clinical positioning, micronutrient optimization, and bariatric-friendly formats to target consumers on GLP-1 therapies such as semaglutide and tirzepatide. Companies like Nestlé Health Science, Abbott, and Herbalife are developing nutrient-dense formulations focused on protein, B12, electrolytes, and appetite support, often bundled with telehealth or pharmacy programs.

Unjury Protein and ProCare Health are prominent in the bariatric and medical nutrition channels, offering easily digestible powders and ready-to-drink solutions tailored to reduced caloric intake and malabsorption challenges.

Emerging brands like Replenza, Keptropy, and FullWell are marketing GLP-1-supportive supplements via direct-to-consumer channels, with emphasis on glycemic control, lean mass preservation, and post-meal tolerance. Supplement chains like The Vitamin Shoppe® are curating GLP-1-specific shelves with a mix of third-party and private-label offerings. Natnect and KetoZest are tapping into ketogenic formats and anti-nausea blends, aligned with consumer-reported side effects of GLP-1 drugs.

Recent Industry News

  • In June 2024, Nestlé Health Science launched www.glp-1nutrition.com, a dedicated platform providing tailored nutrition support for GLP1 users. The site offers resources and product recommendations to address key needs such as muscle maintenance, micronutrient balance, gut function, hydration, and overall weight management for individuals using GLP1 therapies.
  • In July 2025, Herbalife introduced MultiBurn™, a botanical-based weight-management supplement developed to support fat loss and improve metabolic health. Positioned for users of GLP1 medications, the product enhances Herbalife’s weight control portfolio by offering an alternative with thermogenic properties and digestive support for those seeking non-stimulant supplementation.

Research Coverage and Scope Summary

Report Attributes Details
Industry Size (2025) USD 4.1 billion
Projected Industry Size (2035) USD 13 billion
CAGR (2025 to 2035) 12.2%
Base Year for Estimation 2024
Historical Period 2020 to 2024
Projections Period 2025 to 2035
Quantitative Units USD billion for value and million units for volume
Product Types Analyzed (Segment 1) Protein & Macronutrient Blends, Fiber Supplements, Micronutrient Blends, Digestive Health Formulations, Appetite & Metabolic Support
Dosage Forms Analyzed (Segment 2) Powders (Meal Replacements, Fibers), RTD Shakes, Capsules/Tablets, Gummies/Chews, Others
Age Groups Analyzed (Segment 3) 18 - 34, 35 - 54, 55 - 74, 75+
Channels Analyzed (Segment 4) Prescription (Rx), Over-the-Counter (OTC)
Regions Covered North America, Latin America, Western Europe, Eastern Europe, East Asia, South Asia & Pacific
Countries Covered United States, Canada, Germany, United Kingdom, France, Italy, Spain, China, India, Japan, South Korea, Australia, Brazil, Mexico, Argentina, Saudi Arabia, UAE, South Africa
Key Players Nestlé Health Science, Herbalife, Unjury Protein, ProCare Health, FullWell, The Vitamin Shoppe®, SOLO TREE, Replenza, KetoZest, Keptropy, Abbott, Vital Nutrients, Natnect, Other Emerging Players
Additional Attributes Dollar sales by dosage and age group, protein-blend dominance in GLP-1 nutrition protocols, clinical demand for RTD and meal replacements, OTC adoption trends, regional insurance policy shifts

Leading Players in GLP-1 Nutritional Support Market

  • Nestlé Health Science
  • Herbalife
  • Unjury Protein
  • ProCare Health
  • FullWell
  • The Vitamin Shoppe®
  • SOLO TREE
  • Replenza
  • KetoZest
  • Keptropy
  • Abbott
  • Vital Nutrients
  • Natnect
  • Other Emerging Players

Key Segments

By Product Type:

The industry includes protein and macronutrient blends, fiber supplements, micronutrient blends, digestive health formulations, and appetite & metabolic support.

By Dosage Form:

The industry is segmented into powders (meal replacements, fibers), RTD shakes, capsules/tablets, gummies/chews, and others.

By Age Group:

The segmentation covers 18-34, 35-54, 55-74, and 75+ age brackets.

By Channel:

These products are distributed through prescription (Rx) and over-the-counter (OTC) formats.

By Region:

The industry is segmented as North America, Latin America, Western Europe, Eastern Europe, East Asia, South Asia & Pacific.

Table of Content

  1. Executive Summary
    • Global Market Outlook
    • Demand-side Trends
    • Supply-side Trends
    • Technology Roadmap Analysis
    • Analysis and Recommendations
  2. Market Overview
    • Market Coverage / Taxonomy
    • Market Definition / Scope / Limitations
  3. Market Background
    • Market Dynamics
      • Drivers
      • Restraints
      • Opportunity
      • Trends
    • Scenario Forecast
      • Demand in Optimistic Scenario
      • Demand in Likely Scenario
      • Demand in Conservative Scenario
    • Opportunity Map Analysis
    • Product Life Cycle Analysis
    • Supply Chain Analysis
      • Supply Side Participants and their Roles
        • Producers
        • Mid-Level Participants (Traders/ Agents/ Brokers)
        • Wholesalers and Distributors
      • Value Added and Value Created at Node in the Supply Chain
      • List of Raw Material Suppliers
      • List of Existing and Potential Buyer’s
    • Investment Feasibility Matrix
    • Value Chain Analysis
      • Profit Margin Analysis
      • Wholesalers and Distributors
      • Retailers
    • PESTLE and Porter’s Analysis
    • Regulatory Landscape
      • By Key Regions
      • By Key Countries
    • Regional Parent Market Outlook
    • Production and Consumption Statistics
    • Import and Export Statistics
  4. Global Market Analysis 2020 to 2024 and Forecast, 2025 to 2035
    • Historical Market Size Value (USD Billion) & Volume (Million Units) Analysis, 2020 to 2024
    • Current and Future Market Size Value (USD Billion) & Volume (Million Units) Projections, 2025 to 2035
      • Y-o-Y Growth Trend Analysis
      • Absolute $ Opportunity Analysis
  5. Global Market Pricing Analysis 2020 to 2024 and Forecast 2025 to 2035
  6. Global Market Analysis 2020 to 2024 and Forecast 2025 to 2035, By Product
    • Introduction / Key Findings
    • Historical Market Size Value (USD Billion) & Volume (Million Units) Analysis By Product, 2020 to 2024
    • Current and Future Market Size Value (USD Billion) & Volume (Million Units) Analysis and Forecast By Product, 2025 to 2035
      • Protein & Macronutrient Blends
      • Fiber Supplements
      • Micronutrient Blends
      • Digestive Health Formulations
      • Appetite & Metabolic Support
    • Y-o-Y Growth Trend Analysis By Product, 2020 to 2024
    • Absolute $ Opportunity Analysis By Product, 2025 to 2035
  7. Global Market Analysis 2020 to 2024 and Forecast 2025 to 2035, By Dosage Form
    • Introduction / Key Findings
    • Historical Market Size Value (USD Billion) & Volume (Million Units) Analysis By Dosage Form, 2020 to 2024
    • Current and Future Market Size Value (USD Billion) & Volume (Million Units) Analysis and Forecast By Dosage Form, 2025 to 2035
      • Powders
        • Meal Replacements
        • Fibre
      • RTD Shakes
      • Capsules/Tablets
      • Gummies/Chews
      • Others
    • Y-o-Y Growth Trend Analysis By Dosage Form, 2020 to 2024
    • Absolute $ Opportunity Analysis By Dosage Form, 2025 to 2035
  8. Global Market Analysis 2020 to 2024 and Forecast 2025 to 2035, By Age Group
    • Introduction / Key Findings
    • Historical Market Size Value (USD Billion) & Volume (Million Units) Analysis By Age Group, 2020 to 2024
    • Current and Future Market Size Value (USD Billion) & Volume (Million Units) Analysis and Forecast By Age Group, 2025 to 2035
      • 18-34
      • 35-54
      • 55-74
      • 75+
    • Y-o-Y Growth Trend Analysis By Age Group, 2020 to 2024
    • Absolute $ Opportunity Analysis By Age Group, 2025 to 2035
  9. Global Market Analysis 2020 to 2024 and Forecast 2025 to 2035, By Channel
    • Introduction / Key Findings
    • Historical Market Size Value (USD Billion) & Volume (Million Units) Analysis By Channel, 2020 to 2024
    • Current and Future Market Size Value (USD Billion) & Volume (Million Units) Analysis and Forecast By Channel, 2025 to 2035
      • Prescription (Rx)
      • Over-the-Counter (OTC)
    • Y-o-Y Growth Trend Analysis By Channel, 2020 to 2024
    • Absolute $ Opportunity Analysis By Channel, 2025 to 2035
  10. Global Market Analysis 2020 to 2024 and Forecast 2025 to 2035, By Region
    • Introduction
    • Historical Market Size Value (USD Billion) & Volume (Million Units) Analysis By Region, 2020 to 2024
    • Current Market Size Value (USD Billion) & Volume (Million Units) Analysis and Forecast By Region, 2025 to 2035
      • North America
      • Latin America
      • Western Europe
      • Eastern Europe
      • East Asia
      • South Asia & Pacific
      • Middle East and Africa
    • Market Attractiveness Analysis By Region
  11. North America Market Analysis 2020 to 2024 and Forecast 2025 to 2035, By Country
    • Historical Market Size Value (USD Billion) & Volume (Million Units) Trend Analysis By Market Taxonomy, 2020 to 2024
    • Market Size Value (USD Billion) & Volume (Million Units) Forecast By Market Taxonomy, 2025 to 2035
      • By Country
        • USA
        • Canada
        • Mexico
      • By Product
      • By Dosage Form
      • By Age Group
      • By Channel
    • Market Attractiveness Analysis
      • By Country
      • By Product
      • By Dosage Form
      • By Age Group
      • By Channel
    • Key Takeaways
  12. Latin America Market Analysis 2020 to 2024 and Forecast 2025 to 2035, By Country
    • Historical Market Size Value (USD Billion) & Volume (Million Units) Trend Analysis By Market Taxonomy, 2020 to 2024
    • Market Size Value (USD Billion) & Volume (Million Units) Forecast By Market Taxonomy, 2025 to 2035
      • By Country
        • Brazil
        • Argentina
        • Rest of LATAM
      • By Product
      • By Dosage Form
      • By Age Group
      • By Channel
    • Market Attractiveness Analysis
      • By Country
      • By Product
      • By Dosage Form
      • By Age Group
      • By Channel
    • Key Takeaways
  13. Western Europe Market Analysis 2020 to 2024 and Forecast 2025 to 2035, By Country
    • Historical Market Size Value (USD Billion) & Volume (Million Units) Trend Analysis By Market Taxonomy, 2020 to 2024
    • Market Size Value (USD Billion) & Volume (Million Units) Forecast By Market Taxonomy, 2025 to 2035
      • By Country
        • Germany
        • Italy
        • France
        • UK
        • Spain
        • BENELUX
        • Nordic
        • Rest of W.Europe
      • By Product
      • By Dosage Form
      • By Age Group
      • By Channel
    • Market Attractiveness Analysis
      • By Country
      • By Product
      • By Dosage Form
      • By Age Group
      • By Channel
    • Key Takeaways
  14. Eastern Europe Market Analysis 2020 to 2024 and Forecast 2025 to 2035, By Country
    • Historical Market Size Value (USD Billion) & Volume (Million Units) Trend Analysis By Market Taxonomy, 2020 to 2024
    • Market Size Value (USD Billion) & Volume (Million Units) Forecast By Market Taxonomy, 2025 to 2035
      • By Country
        • Russia
        • Hungary
        • Poland
        • Balkan & Baltics
        • Rest of E. Europe
      • By Product
      • By Dosage Form
      • By Age Group
      • By Channel
    • Market Attractiveness Analysis
      • By Country
      • By Product
      • By Dosage Form
      • By Age Group
      • By Channel
    • Key Takeaways
  15. East Asia Market Analysis 2020 to 2024 and Forecast 2025 to 2035, By Country
    • Historical Market Size Value (USD Billion) & Volume (Million Units) Trend Analysis By Market Taxonomy, 2020 to 2024
    • Market Size Value (USD Billion) & Volume (Million Units) Forecast By Market Taxonomy, 2025 to 2035
      • By Country
        • China
        • Japan
        • South Korea
      • By Product
      • By Dosage Form
      • By Age Group
      • By Channel
    • Market Attractiveness Analysis
      • By Country
      • By Product
      • By Dosage Form
      • By Age Group
      • By Channel
    • Key Takeaways
  16. South Asia & Pacific Market Analysis 2020 to 2024 and Forecast 2025 to 2035, By Country
    • Historical Market Size Value (USD Billion) & Volume (Million Units) Trend Analysis By Market Taxonomy, 2020 to 2024
    • Market Size Value (USD Billion) & Volume (Million Units) Forecast By Market Taxonomy, 2025 to 2035
      • By Country
        • India
        • Australia & New Zealand
        • ASEAN
        • Rest of SAP
      • By Product
      • By Dosage Form
      • By Age Group
      • By Channel
    • Market Attractiveness Analysis
      • By Country
      • By Product
      • By Dosage Form
      • By Age Group
      • By Channel
    • Key Takeaways
  17. Middle East and Africa Market Analysis 2020 to 2024 and Forecast 2025 to 2035, By Country
    • Historical Market Size Value (USD Billion) & Volume (Million Units) Trend Analysis By Market Taxonomy, 2020 to 2024
    • Market Size Value (USD Billion) & Volume (Million Units) Forecast By Market Taxonomy, 2025 to 2035
      • By Country
        • GCC Countries
        • Northern Africa
        • South Africa
        • Turkiye
        • Rest of MEA
      • By Product
      • By Dosage Form
      • By Age Group
      • By Channel
    • Market Attractiveness Analysis
      • By Country
      • By Product
      • By Dosage Form
      • By Age Group
      • By Channel
    • Key Takeaways
  18. Key Countries Market Analysis
    • USA
      • Pricing Analysis
      • Market Share Analysis, 2024
        • By Product
        • By Dosage Form
        • By Age Group
        • By Channel
    • Canada
      • Pricing Analysis
      • Market Share Analysis, 2024
        • By Product
        • By Dosage Form
        • By Age Group
        • By Channel
    • Brazil
      • Pricing Analysis
      • Market Share Analysis, 2024
        • By Product
        • By Dosage Form
        • By Age Group
        • By Channel
    • Mexico
      • Pricing Analysis
      • Market Share Analysis, 2024
        • By Product
        • By Dosage Form
        • By Age Group
        • By Channel
    • Argentina
      • Pricing Analysis
      • Market Share Analysis, 2024
        • By Product
        • By Dosage Form
        • By Age Group
        • By Channel
  19. Market Structure Analysis
    • Competition Dashboard
    • Competition Benchmarking
    • Market Share Analysis of Top Players
      • By Regional
      • By Product
      • By Dosage Form
      • By Age Group
      • By Channel
  20. Competition Analysis
    • Competition Deep Dive
      • Nestlé Health Science
        • Overview
        • Product Portfolio
        • Profitability by Market Segments (Product/Age /Sales Channel/Region)
        • Sales Footprint
        • Strategy Overview
          • Marketing Strategy
          • Product Strategy
          • Channel Strategy
      • Herbalife
        • Overview
        • Product Portfolio
        • Profitability by Market Segments (Product/Age /Sales Channel/Region)
        • Sales Footprint
        • Strategy Overview
          • Marketing Strategy
          • Product Strategy
          • Channel Strategy
      • Unjury Protein
        • Overview
        • Product Portfolio
        • Profitability by Market Segments (Product/Age /Sales Channel/Region)
        • Sales Footprint
        • Strategy Overview
          • Marketing Strategy
          • Product Strategy
          • Channel Strategy
      • ProCare Health
        • Overview
        • Product Portfolio
        • Profitability by Market Segments (Product/Age /Sales Channel/Region)
        • Sales Footprint
        • Strategy Overview
          • Marketing Strategy
          • Product Strategy
          • Channel Strategy
      • FullWell
        • Overview
        • Product Portfolio
        • Profitability by Market Segments (Product/Age /Sales Channel/Region)
        • Sales Footprint
        • Strategy Overview
          • Marketing Strategy
          • Product Strategy
          • Channel Strategy
      • The Vitamin Shoppe®
        • Overview
        • Product Portfolio
        • Profitability by Market Segments (Product/Age /Sales Channel/Region)
        • Sales Footprint
        • Strategy Overview
          • Marketing Strategy
          • Product Strategy
          • Channel Strategy
      • SOLO TREE
        • Overview
        • Product Portfolio
        • Profitability by Market Segments (Product/Age /Sales Channel/Region)
        • Sales Footprint
        • Strategy Overview
          • Marketing Strategy
          • Product Strategy
          • Channel Strategy
      • Replenza
        • Overview
        • Product Portfolio
        • Profitability by Market Segments (Product/Age /Sales Channel/Region)
        • Sales Footprint
        • Strategy Overview
          • Marketing Strategy
          • Product Strategy
          • Channel Strategy
      • KetoZest
        • Overview
        • Product Portfolio
        • Profitability by Market Segments (Product/Age /Sales Channel/Region)
        • Sales Footprint
        • Strategy Overview
          • Marketing Strategy
          • Product Strategy
          • Channel Strategy
      • Keptropy
        • Overview
        • Product Portfolio
        • Profitability by Market Segments (Product/Age /Sales Channel/Region)
        • Sales Footprint
        • Strategy Overview
          • Marketing Strategy
          • Product Strategy
          • Channel Strategy
      • Abbott
        • Overview
        • Product Portfolio
        • Profitability by Market Segments (Product/Age /Sales Channel/Region)
        • Sales Footprint
        • Strategy Overview
          • Marketing Strategy
          • Product Strategy
          • Channel Strategy
      • Vital Nutrients
        • Overview
        • Product Portfolio
        • Profitability by Market Segments (Product/Age /Sales Channel/Region)
        • Sales Footprint
        • Strategy Overview
          • Marketing Strategy
          • Product Strategy
          • Channel Strategy
      • Natnect
        • Overview
        • Product Portfolio
        • Profitability by Market Segments (Product/Age /Sales Channel/Region)
        • Sales Footprint
        • Strategy Overview
          • Marketing Strategy
          • Product Strategy
          • Channel Strategy
  21. Assumptions & Acronyms Used
  22. Research Methodology

List of Tables

  • Table 1: Global Market Value (USD Billion) Forecast by Region, 2020 to 2035
  • Table 2: Global Market Volume (Million Units) Forecast by Region, 2020 to 2035
  • Table 3: Global Market Value (USD Billion) Forecast by Product, 2020 to 2035
  • Table 4: Global Market Volume (Million Units) Forecast by Product, 2020 to 2035
  • Table 5: Global Market Value (USD Billion) Forecast by Dosage Form, 2020 to 2035
  • Table 6: Global Market Volume (Million Units) Forecast by Dosage Form, 2020 to 2035
  • Table 7: Global Market Value (USD Billion) Forecast by Age Group, 2020 to 2035
  • Table 8: Global Market Volume (Million Units) Forecast by Age Group, 2020 to 2035
  • Table 9: Global Market Value (USD Billion) Forecast by Channel, 2020 to 2035
  • Table 10: Global Market Volume (Million Units) Forecast by Channel, 2020 to 2035
  • Table 11: North America Market Value (USD Billion) Forecast by Country, 2020 to 2035
  • Table 12: North America Market Volume (Million Units) Forecast by Country, 2020 to 2035
  • Table 13: North America Market Value (USD Billion) Forecast by Product, 2020 to 2035
  • Table 14: North America Market Volume (Million Units) Forecast by Product, 2020 to 2035
  • Table 15: North America Market Value (USD Billion) Forecast by Dosage Form, 2020 to 2035
  • Table 16: North America Market Volume (Million Units) Forecast by Dosage Form, 2020 to 2035
  • Table 17: North America Market Value (USD Billion) Forecast by Age Group, 2020 to 2035
  • Table 18: North America Market Volume (Million Units) Forecast by Age Group, 2020 to 2035
  • Table 19: North America Market Value (USD Billion) Forecast by Channel, 2020 to 2035
  • Table 20: North America Market Volume (Million Units) Forecast by Channel, 2020 to 2035
  • Table 21: Latin America Market Value (USD Billion) Forecast by Country, 2020 to 2035
  • Table 22: Latin America Market Volume (Million Units) Forecast by Country, 2020 to 2035
  • Table 23: Latin America Market Value (USD Billion) Forecast by Product, 2020 to 2035
  • Table 24: Latin America Market Volume (Million Units) Forecast by Product, 2020 to 2035
  • Table 25: Latin America Market Value (USD Billion) Forecast by Dosage Form, 2020 to 2035
  • Table 26: Latin America Market Volume (Million Units) Forecast by Dosage Form, 2020 to 2035
  • Table 27: Latin America Market Value (USD Billion) Forecast by Age Group, 2020 to 2035
  • Table 28: Latin America Market Volume (Million Units) Forecast by Age Group, 2020 to 2035
  • Table 29: Latin America Market Value (USD Billion) Forecast by Channel, 2020 to 2035
  • Table 30: Latin America Market Volume (Million Units) Forecast by Channel, 2020 to 2035
  • Table 31: Western Europe Market Value (USD Billion) Forecast by Country, 2020 to 2035
  • Table 32: Western Europe Market Volume (Million Units) Forecast by Country, 2020 to 2035
  • Table 33: Western Europe Market Value (USD Billion) Forecast by Product, 2020 to 2035
  • Table 34: Western Europe Market Volume (Million Units) Forecast by Product, 2020 to 2035
  • Table 35: Western Europe Market Value (USD Billion) Forecast by Dosage Form, 2020 to 2035
  • Table 36: Western Europe Market Volume (Million Units) Forecast by Dosage Form, 2020 to 2035
  • Table 37: Western Europe Market Value (USD Billion) Forecast by Age Group, 2020 to 2035
  • Table 38: Western Europe Market Volume (Million Units) Forecast by Age Group, 2020 to 2035
  • Table 39: Western Europe Market Value (USD Billion) Forecast by Channel, 2020 to 2035
  • Table 40: Western Europe Market Volume (Million Units) Forecast by Channel, 2020 to 2035
  • Table 41: Eastern Europe Market Value (USD Billion) Forecast by Country, 2020 to 2035
  • Table 42: Eastern Europe Market Volume (Million Units) Forecast by Country, 2020 to 2035
  • Table 43: Eastern Europe Market Value (USD Billion) Forecast by Product, 2020 to 2035
  • Table 44: Eastern Europe Market Volume (Million Units) Forecast by Product, 2020 to 2035
  • Table 45: Eastern Europe Market Value (USD Billion) Forecast by Dosage Form, 2020 to 2035
  • Table 46: Eastern Europe Market Volume (Million Units) Forecast by Dosage Form, 2020 to 2035
  • Table 47: Eastern Europe Market Value (USD Billion) Forecast by Age Group, 2020 to 2035
  • Table 48: Eastern Europe Market Volume (Million Units) Forecast by Age Group, 2020 to 2035
  • Table 49: Eastern Europe Market Value (USD Billion) Forecast by Channel, 2020 to 2035
  • Table 50: Eastern Europe Market Volume (Million Units) Forecast by Channel, 2020 to 2035
  • Table 51: East Asia Market Value (USD Billion) Forecast by Country, 2020 to 2035
  • Table 52: East Asia Market Volume (Million Units) Forecast by Country, 2020 to 2035
  • Table 53: East Asia Market Value (USD Billion) Forecast by Product, 2020 to 2035
  • Table 54: East Asia Market Volume (Million Units) Forecast by Product, 2020 to 2035
  • Table 55: East Asia Market Value (USD Billion) Forecast by Dosage Form, 2020 to 2035
  • Table 56: East Asia Market Volume (Million Units) Forecast by Dosage Form, 2020 to 2035
  • Table 57: East Asia Market Value (USD Billion) Forecast by Age Group, 2020 to 2035
  • Table 58: East Asia Market Volume (Million Units) Forecast by Age Group, 2020 to 2035
  • Table 59: East Asia Market Value (USD Billion) Forecast by Channel, 2020 to 2035
  • Table 60: East Asia Market Volume (Million Units) Forecast by Channel, 2020 to 2035
  • Table 61: South Asia & Pacific Market Value (USD Billion) Forecast by Country, 2020 to 2035
  • Table 62: South Asia & Pacific Market Volume (Million Units) Forecast by Country, 2020 to 2035
  • Table 63: South Asia & Pacific Market Value (USD Billion) Forecast by Product, 2020 to 2035
  • Table 64: South Asia & Pacific Market Volume (Million Units) Forecast by Product, 2020 to 2035
  • Table 65: South Asia & Pacific Market Value (USD Billion) Forecast by Dosage Form, 2020 to 2035
  • Table 66: South Asia & Pacific Market Volume (Million Units) Forecast by Dosage Form, 2020 to 2035
  • Table 67: South Asia & Pacific Market Value (USD Billion) Forecast by Age Group, 2020 to 2035
  • Table 68: South Asia & Pacific Market Volume (Million Units) Forecast by Age Group, 2020 to 2035
  • Table 69: South Asia & Pacific Market Value (USD Billion) Forecast by Channel, 2020 to 2035
  • Table 70: South Asia & Pacific Market Volume (Million Units) Forecast by Channel, 2020 to 2035
  • Table 71: Middle East and Africa Market Value (USD Billion) Forecast by Country, 2020 to 2035
  • Table 72: Middle East and Africa Market Volume (Million Units) Forecast by Country, 2020 to 2035
  • Table 73: Middle East and Africa Market Value (USD Billion) Forecast by Product, 2020 to 2035
  • Table 74: Middle East and Africa Market Volume (Million Units) Forecast by Product, 2020 to 2035
  • Table 75: Middle East and Africa Market Value (USD Billion) Forecast by Dosage Form, 2020 to 2035
  • Table 76: Middle East and Africa Market Volume (Million Units) Forecast by Dosage Form, 2020 to 2035
  • Table 77: Middle East and Africa Market Value (USD Billion) Forecast by Age Group, 2020 to 2035
  • Table 78: Middle East and Africa Market Volume (Million Units) Forecast by Age Group, 2020 to 2035
  • Table 79: Middle East and Africa Market Value (USD Billion) Forecast by Channel, 2020 to 2035
  • Table 80: Middle East and Africa Market Volume (Million Units) Forecast by Channel, 2020 to 2035

List of Figures

  • Figure 1: Global Market Volume (Million Units) Forecast 2020 to 2035
  • Figure 2: Global Market Pricing Analysis
  • Figure 3: Global Market Value (USD Billion) Forecast 2020 to 2035
  • Figure 4: Global Market Value Share and BPS Analysis by Product, 2025 and 2035
  • Figure 5: Global Market Y-o-Y Growth Comparison by Product, 2025 to 2035
  • Figure 6: Global Market Attractiveness Analysis by Product
  • Figure 7: Global Market Value Share and BPS Analysis by Dosage Form, 2025 and 2035
  • Figure 8: Global Market Y-o-Y Growth Comparison by Dosage Form, 2025 to 2035
  • Figure 9: Global Market Attractiveness Analysis by Dosage Form
  • Figure 10: Global Market Value Share and BPS Analysis by Age Group, 2025 and 2035
  • Figure 11: Global Market Y-o-Y Growth Comparison by Age Group, 2025 to 2035
  • Figure 12: Global Market Attractiveness Analysis by Age Group
  • Figure 13: Global Market Value Share and BPS Analysis by Channel, 2025 and 2035
  • Figure 14: Global Market Y-o-Y Growth Comparison by Channel, 2025 to 2035
  • Figure 15: Global Market Attractiveness Analysis by Channel
  • Figure 16: Global Market Value (USD Billion) Share and BPS Analysis by Region, 2025 and 2035
  • Figure 17: Global Market Y-o-Y Growth Comparison by Region, 2025 to 2035
  • Figure 18: Global Market Attractiveness Analysis by Region
  • Figure 19: North America Market Incremental $ Opportunity, 2025 to 2035
  • Figure 20: Latin America Market Incremental $ Opportunity, 2025 to 2035
  • Figure 21: Western Europe Market Incremental $ Opportunity, 2025 to 2035
  • Figure 22: Eastern Europe Market Incremental $ Opportunity, 2025 to 2035
  • Figure 23: East Asia Market Incremental $ Opportunity, 2025 to 2035
  • Figure 24: South Asia & Pacific Market Incremental $ Opportunity, 2025 to 2035
  • Figure 25: Middle East and Africa Market Incremental $ Opportunity, 2025 to 2035
  • Figure 26: North America Market Value Share and BPS Analysis by Country, 2025 and 2035
  • Figure 27: North America Market Value Share and BPS Analysis by Product, 2025 and 2035
  • Figure 28: North America Market Y-o-Y Growth Comparison by Product, 2025 to 2035
  • Figure 29: North America Market Attractiveness Analysis by Product
  • Figure 30: North America Market Value Share and BPS Analysis by Dosage Form, 2025 and 2035
  • Figure 31: North America Market Y-o-Y Growth Comparison by Dosage Form, 2025 to 2035
  • Figure 32: North America Market Attractiveness Analysis by Dosage Form
  • Figure 33: North America Market Value Share and BPS Analysis by Age Group, 2025 and 2035
  • Figure 34: North America Market Y-o-Y Growth Comparison by Age Group, 2025 to 2035
  • Figure 35: North America Market Attractiveness Analysis by Age Group
  • Figure 36: North America Market Value Share and BPS Analysis by Channel, 2025 and 2035
  • Figure 37: North America Market Y-o-Y Growth Comparison by Channel, 2025 to 2035
  • Figure 38: North America Market Attractiveness Analysis by Channel
  • Figure 39: Latin America Market Value Share and BPS Analysis by Country, 2025 and 2035
  • Figure 40: Latin America Market Value Share and BPS Analysis by Product, 2025 and 2035
  • Figure 41: Latin America Market Y-o-Y Growth Comparison by Product, 2025 to 2035
  • Figure 42: Latin America Market Attractiveness Analysis by Product
  • Figure 43: Latin America Market Value Share and BPS Analysis by Dosage Form, 2025 and 2035
  • Figure 44: Latin America Market Y-o-Y Growth Comparison by Dosage Form, 2025 to 2035
  • Figure 45: Latin America Market Attractiveness Analysis by Dosage Form
  • Figure 46: Latin America Market Value Share and BPS Analysis by Age Group, 2025 and 2035
  • Figure 47: Latin America Market Y-o-Y Growth Comparison by Age Group, 2025 to 2035
  • Figure 48: Latin America Market Attractiveness Analysis by Age Group
  • Figure 49: Latin America Market Value Share and BPS Analysis by Channel, 2025 and 2035
  • Figure 50: Latin America Market Y-o-Y Growth Comparison by Channel, 2025 to 2035
  • Figure 51: Latin America Market Attractiveness Analysis by Channel
  • Figure 52: Western Europe Market Value Share and BPS Analysis by Country, 2025 and 2035
  • Figure 53: Western Europe Market Value Share and BPS Analysis by Product, 2025 and 2035
  • Figure 54: Western Europe Market Y-o-Y Growth Comparison by Product, 2025 to 2035
  • Figure 55: Western Europe Market Attractiveness Analysis by Product
  • Figure 56: Western Europe Market Value Share and BPS Analysis by Dosage Form, 2025 and 2035
  • Figure 57: Western Europe Market Y-o-Y Growth Comparison by Dosage Form, 2025 to 2035
  • Figure 58: Western Europe Market Attractiveness Analysis by Dosage Form
  • Figure 59: Western Europe Market Value Share and BPS Analysis by Age Group, 2025 and 2035
  • Figure 60: Western Europe Market Y-o-Y Growth Comparison by Age Group, 2025 to 2035
  • Figure 61: Western Europe Market Attractiveness Analysis by Age Group
  • Figure 62: Western Europe Market Value Share and BPS Analysis by Channel, 2025 and 2035
  • Figure 63: Western Europe Market Y-o-Y Growth Comparison by Channel, 2025 to 2035
  • Figure 64: Western Europe Market Attractiveness Analysis by Channel
  • Figure 65: Eastern Europe Market Value Share and BPS Analysis by Country, 2025 and 2035
  • Figure 66: Eastern Europe Market Value Share and BPS Analysis by Product, 2025 and 2035
  • Figure 67: Eastern Europe Market Y-o-Y Growth Comparison by Product, 2025 to 2035
  • Figure 68: Eastern Europe Market Attractiveness Analysis by Product
  • Figure 69: Eastern Europe Market Value Share and BPS Analysis by Dosage Form, 2025 and 2035
  • Figure 70: Eastern Europe Market Y-o-Y Growth Comparison by Dosage Form, 2025 to 2035
  • Figure 71: Eastern Europe Market Attractiveness Analysis by Dosage Form
  • Figure 72: Eastern Europe Market Value Share and BPS Analysis by Age Group, 2025 and 2035
  • Figure 73: Eastern Europe Market Y-o-Y Growth Comparison by Age Group, 2025 to 2035
  • Figure 74: Eastern Europe Market Attractiveness Analysis by Age Group
  • Figure 75: Eastern Europe Market Value Share and BPS Analysis by Channel, 2025 and 2035
  • Figure 76: Eastern Europe Market Y-o-Y Growth Comparison by Channel, 2025 to 2035
  • Figure 77: Eastern Europe Market Attractiveness Analysis by Channel
  • Figure 78: East Asia Market Value Share and BPS Analysis by Country, 2025 and 2035
  • Figure 79: East Asia Market Value Share and BPS Analysis by Product, 2025 and 2035
  • Figure 80: East Asia Market Y-o-Y Growth Comparison by Product, 2025 to 2035
  • Figure 81: East Asia Market Attractiveness Analysis by Product
  • Figure 82: East Asia Market Value Share and BPS Analysis by Dosage Form, 2025 and 2035
  • Figure 83: East Asia Market Y-o-Y Growth Comparison by Dosage Form, 2025 to 2035
  • Figure 84: East Asia Market Attractiveness Analysis by Dosage Form
  • Figure 85: East Asia Market Value Share and BPS Analysis by Age Group, 2025 and 2035
  • Figure 86: East Asia Market Y-o-Y Growth Comparison by Age Group, 2025 to 2035
  • Figure 87: East Asia Market Attractiveness Analysis by Age Group
  • Figure 88: East Asia Market Value Share and BPS Analysis by Channel, 2025 and 2035
  • Figure 89: East Asia Market Y-o-Y Growth Comparison by Channel, 2025 to 2035
  • Figure 90: East Asia Market Attractiveness Analysis by Channel
  • Figure 91: South Asia & Pacific Market Value Share and BPS Analysis by Country, 2025 and 2035
  • Figure 92: South Asia & Pacific Market Value Share and BPS Analysis by Product, 2025 and 2035
  • Figure 93: South Asia & Pacific Market Y-o-Y Growth Comparison by Product, 2025 to 2035
  • Figure 94: South Asia & Pacific Market Attractiveness Analysis by Product
  • Figure 95: South Asia & Pacific Market Value Share and BPS Analysis by Dosage Form, 2025 and 2035
  • Figure 96: South Asia & Pacific Market Y-o-Y Growth Comparison by Dosage Form, 2025 to 2035
  • Figure 97: South Asia & Pacific Market Attractiveness Analysis by Dosage Form
  • Figure 98: South Asia & Pacific Market Value Share and BPS Analysis by Age Group, 2025 and 2035
  • Figure 99: South Asia & Pacific Market Y-o-Y Growth Comparison by Age Group, 2025 to 2035
  • Figure 100: South Asia & Pacific Market Attractiveness Analysis by Age Group
  • Figure 101: South Asia & Pacific Market Value Share and BPS Analysis by Channel, 2025 and 2035
  • Figure 102: South Asia & Pacific Market Y-o-Y Growth Comparison by Channel, 2025 to 2035
  • Figure 103: South Asia & Pacific Market Attractiveness Analysis by Channel
  • Figure 104: Middle East and Africa Market Value Share and BPS Analysis by Country, 2025 and 2035
  • Figure 105: Middle East and Africa Market Value Share and BPS Analysis by Product, 2025 and 2035
  • Figure 106: Middle East and Africa Market Y-o-Y Growth Comparison by Product, 2025 to 2035
  • Figure 107: Middle East and Africa Market Attractiveness Analysis by Product
  • Figure 108: Middle East and Africa Market Value Share and BPS Analysis by Dosage Form, 2025 and 2035
  • Figure 109: Middle East and Africa Market Y-o-Y Growth Comparison by Dosage Form, 2025 to 2035
  • Figure 110: Middle East and Africa Market Attractiveness Analysis by Dosage Form
  • Figure 111: Middle East and Africa Market Value Share and BPS Analysis by Age Group, 2025 and 2035
  • Figure 112: Middle East and Africa Market Y-o-Y Growth Comparison by Age Group, 2025 to 2035
  • Figure 113: Middle East and Africa Market Attractiveness Analysis by Age Group
  • Figure 114: Middle East and Africa Market Value Share and BPS Analysis by Channel, 2025 and 2035
  • Figure 115: Middle East and Africa Market Y-o-Y Growth Comparison by Channel, 2025 to 2035
  • Figure 116: Middle East and Africa Market Attractiveness Analysis by Channel
  • Figure 117: Global Market - Tier Structure Analysis
  • Figure 118: Global Market - Company Share Analysis

Frequently Asked Questions

What is the projected industry size of the GLP-1 nutritional support market by 2035?

The industry is projected to reach USD 13 billion by 2035.

What is the expected CAGR of the GLP-1 nutritional support market from 2025 to 2035?

The industry is expected to grow at a CAGR of 12.2% from 2025 to 2035.

Which segment is expected to lead the GLP-1 nutritional support market in 2025?

Protein and macronutrient blends are expected to dominate with a 43% share in 2025.

What is the industry size of the GLP-1 nutritional support market in 2025?

The industry is estimated to reach USD 4.1 billion in 2025.

Which region is expected to witness the highest growth in the GLP-1 nutritional support market?

East Asia, particularly China and Japan, is expected to be the key growth region with growth rates of 15.4% and 12.0%, respectively.

Explore Similar Insights

Future Market Insights

GLP-1 Nutritional Support Market