Memory Support Supplement Market Size and Share Forecast Outlook From 2024 to 2034

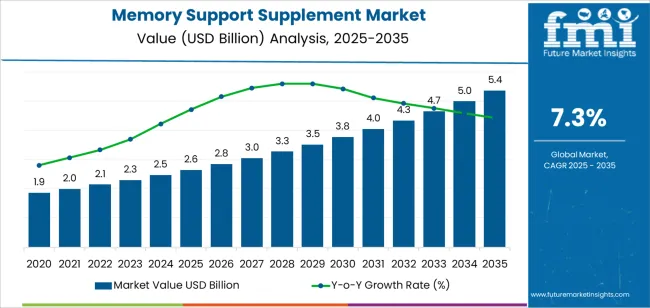
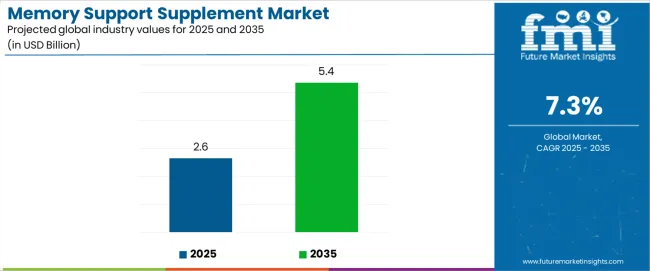
The global memory support supplement market is anticipated to be valued at USD 2,467.1 million in 2024 but by 2034 that number is forecasted to grow to USD 4,989.4 million. Demand for memory support supplements is anticipated to grow at 7.3% through the ensuing decade.

Attributes Key Insights
Estimated Global Memory Support Supplement Market Size (2024E) USD 2,467.1 million
Projected Memory Support Supplement Market Value (2034F) USD 4,989.4 million
Value-based CAGR (2024 to 2034) 7.3%

Memory Support Supplement Market Overview

  • As the world population ages at a rapid pace, there is more demand for products that help with cognitive function.
  • Sedentary lifestyles and brains affected by continuous forays into digital worlds are creating doubts about memory retention and thus memory support supplements are becoming more common.
  • It is not just people with cognitive problems who access the product, as students and gamers are also taking the recourse of the product to gain a competitive edge.
  • As consumers become more proactive about their health and well-being, preventive measures such as incorporating memory support supplements into daily routines are becoming commonplace, driving market growth.

Comparison of Historical vs Future Outlook for the Memory Support Supplement Market (2019 to 2023 vs 2024 to 2034)

Global memory support supplement sales grew at a CAGR of 6.1% from 2019 to 2023.

  • E-commerce played a pivotal role in helping grow the demand for memory support supplements during the historical period, especially with the closure of physical stores during the pandemic.
  • As with other supplements, consumers are preferring memory support supplements made from natural ingredients, increasing the demand for plant-based versions of the product.

Through 2034, the memory support supplement market is projected to grow at 7.3% CAGR.

  • Manufacturers are constantly on the lookout for ingredients that increase the effectiveness of the supplement, thus a significant amount of money is invested in research and development.
  • Novel ingredients are being complemented by advancements in manufacturing technologies.
  • Memory support supplements are poised to continue their upward trajectory as holistic approaches to improving mental health occupy people’s minds more.

Trends Shaping the Memory Support Supplement Market

  • Use of natural ingredients like ginseng and ginkgo biloba is making offering fresh, attracting more consumers.
  • Demand for product label transparency and third-party testing will positively impact sales.
  • The rising popularity of preventive healthcare is driving the demand for memory support supplements.
  • The demand for cognitive-enhancing supplements, including omega-3 fatty acids, phosphatidylserine, acetyl-L-carnitine, and vitamins and minerals like B vitamins, vitamin D, and magnesium, is increasing.
  • Advanced delivery systems like microencapsulation, nanoemulsions, and sublingual formulations give the industry a modern look.
  • Nootropics, or "smart drugs," are gaining traction in the memory support supplement market and they are one promising avenue for investors to improve demand.
  • Memory support supplements are increasingly becoming a part of personalized nutrition, being tailored to fit specific individuals.

Factors Restraining Growth in the Memory Support Supplement Market

  • As with many other holistic approaches, the product suffers from a lack of scientific evidence pointing to its effectiveness and thus science-minded people are skeptical of it.
  • False claims and pseudoscientific marketing have proven to do more harm than good, turning consumers off of the product.
  • Pharmaceutical drugs offer a strong alternative to the product, with the advantage of more availability and more backing from the scientific community.

Analysis of Top Countries Producing, Formulating, Packaging, Distributing, and Using Memory Support Supplements

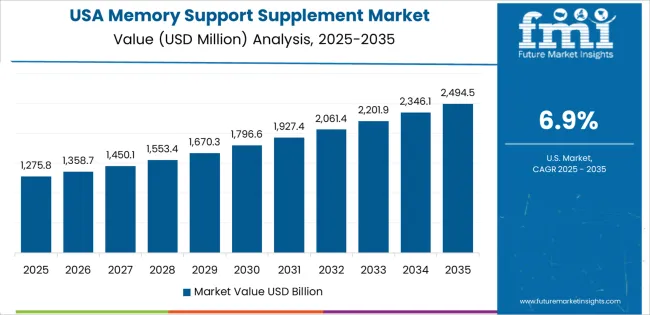
The table below shows the estimated growth rates of the top four countries. The United States, Germany, and India are set to record high CAGRs of 4.5%, 6.7%, and 7.6%, respectively, through 2034.

Countries Value-based CAGR (2024 to 2034)
United States 4.5%
China 3.7%
India 7.6%
Germany 6.7%

Growing Interest in Natural Supplements to Boost Sales in the United States

The United States memory support supplement industry is predicted to register a CAGR of 4.5% through 2034. Key factors deciding the upward trajectory are:

  • Manufacturers in the United States have to follow the Food and Drug Administration (FDA)’s guidelines when it comes to labeling, safety, and marketing claims.
  • The memory support supplement market in the United States is characterized by constant product innovation, with manufacturers constantly introducing new formulations, ingredients, and delivery formats to cater to consumer preferences.
  • Due to their perceived safety and efficacy, consumers favor natural and plant-based ingredients in memory support supplements, such as botanical extracts and herbal remedies.

China to Create Lucrative Opportunities for Manufacturers

Demand for the product in China is set to advance at a CAGR of 3.7% during the projected period, highlighting steady gains. A number of factors influence the industry in China, including:

  • Chinese manufacturers make use of local ingredients to offer unique products to consumers in the country.
  • Online sales of the product in China are booming, to go along with the overall move of the younger generation towards online means.
  • Natural brain health supplements are being fawned upon in both online sources and health campaigns, positively influencing demand.

Rising Aging Population in Germany to Uplift the Market

The market is in line to book a CAGR of 6.7% in Germany. Factors responsible for the solid growth include:

  • Vast geriatric population of Germany is necessitating the adoption of these supplements.
  • Manufacturers and industry stakeholders are making people more aware about the product through the means of educational campaigns that target everyone from children to old people.

Growing Awareness of Mental Health Propelling Demand in India

The Indian market is supposed to register a CAGR of 7.6% for the forecast period. Some of the key factors are enumerated below:

  • Consumers in India getting more aware of cognitive health is not only helping the adoption of the product post-problems but is also seeing more people in the country take the supplements as a precaution.
  • India is also witnessing a young generation continuously glued to screens and to take advantage, stakeholders are increasing their online presence.

Steady Growth Projected for the United Kingdom Memory Support Supplement Market

Demand for memory support supplements is increasing steadily in the United Kingdom. Emerging patterns in the United Kingdom market are as follows:

  • The United Kingdom memory support supplement market is influenced by health and wellness trends, with consumers seeking preventive healthcare and holistic wellness approaches to support brain health and cognitive function.
  • The United Kingdom research and clinical studies evaluate efficacy and safety of memory support supplements, informing consumers and healthcare professionals about product benefits and limitations.

Memory Support Supplement Industry Analysis by Top Investment Segments

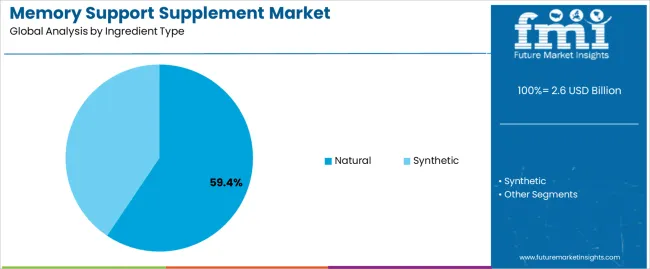
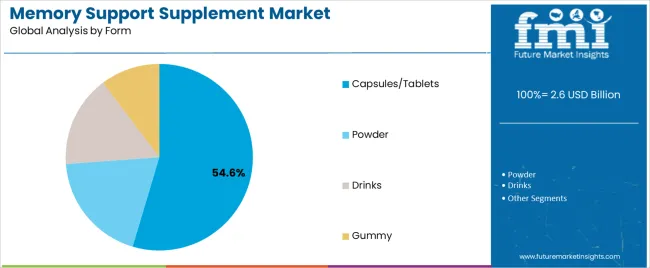
The below section shows the natural segment dominating by ingredient type. The segment is predicted to reach USD 1,537.0 million in 2024. Based on form, the capsules/tablets segment is anticipated to total USD 1,428.5 million in 2024.

Top Segments Estimated Market Value (2024)
Natural (Ingredient Type) USD 1,537.0 million
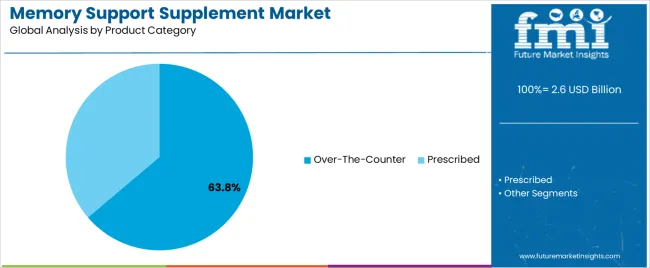
Over-the-Counter (Product category) USD 1,838.0 million
Capsules/Tablets (Form) USD 1,428.5 million
Health Food Stores (Distribution Channel) USD 750.0 million

Demand in the Market to Remain High for Natural Ingredients

  • Consumers are increasingly prioritizing health and wellness, leading to a shift away from synthetic ingredients towards natural alternatives.
  • Consumers are increasingly leaning towards the use of organic ingredients and thus natural supplements are preferred by a large contingent of customers.
  • Natural supplements are growing through the development of individual ingredients like ashwagandha and resveratrol, and the rising knowledge about their health benefits.

Convenience of Tablets/Capsules Fueling their Demand through 2034

  • Capsule rules the roost in this market too, for many of the same reasons as in other sectors, due to its portability as well as its convenience.
  • Capsule/tablets have an enhanced shelf life, are easy to transport as well as store, and thus are convenient for the elderly population.

Over-the-Counter Product Category to Gain Impetus

  • Increase in the number of physical medical stores, especially those open 24 hours is imparting growth to the over-the-counter category.
  • Over-the-counter drugs can be obtained without prescriptions, making their consumer base wide, ranging from children to the elderly.

Competitive Landscape of the Memory Support Supplement Market

Leading pharmaceutical companies dominate the cognitive health market. They are investing in research and development to introduce novel memory supplements. Innovative start-ups and niche players disrupt the market by focusing on natural and holistic approaches.

Leading memory support supplement manufacturers invest in research and development to create tailored formulations for specific needs. Partnerships and distribution agreements are a common strategy in the industry. Other organic strategies include an increase in advertising activities and celebrity endorsements.

For instance

  • In 2022, Onnit Labs, Inc. added a new clinical trial to understand the effects of its "new mood serotonin booster" medication, designed to help regulate stress and mood.
  • In June 2021, Motiva Supplements launched 'Neuro Booster', a product designed to enhance brain health and help Alzheimer's patients by providing increased absorption of six essential functional foods.
  • In 2020, Elysium Health, Inc. and the University of Oxford collaborated to launch Longevity. It is a brain health supplement with clinically verified B vitamins and a powdered omega-3 lysine compound.

Leading Companies in the Memory Support Supplement Market

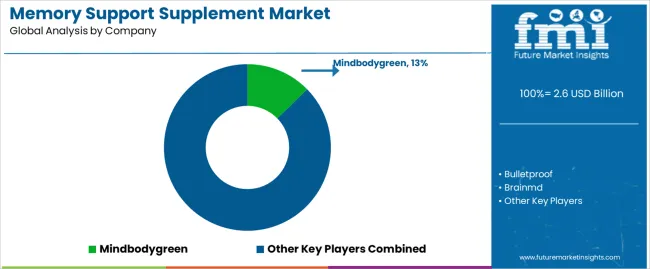
  • Mindbodygreen
  • Bulletproof
  • Brainmd
  • Qualia
  • Solgar
  • Metagenics
  • Pure Encapsulations
  • Designs for Health
  • Life Extension
  • Gaia Herbs
  • Reserveage Nutrition
  • Klaire Labs
  • Superbeets
  • Seeking Health

Key Coverage in the Memory Support Supplement Global Market Report

  • Adjacent Study on Mental Acuity supplement Market, Memory Aid Supplement Market, and Cognitive Health Supplement Market
  • Future Prospects for Memory Enhancement Supplement Market
  • Key Players in Neurological Health Supplement Market
  • Memory Improvement Supplement Market Revenue Analysis
  • Top Selling Supplements for Brain Health
  • Global Brain Health Supplement Market Size
  • Cognitive Health Supplement Market Share
  • Cognitive Health Supplement Industry Analysis
  • Market Overview of Memory Enhancement Supplements

Top Segments Studied in the Memory Support Supplement Market

By Ingredient Type:

  • Natural
    • Panax Ginseng
    • Ginkgo Biloba
    • Asiatic Pennywort
    • Ashwagandha
    • Bacopa Monnieri
    • Guarana
    • Eleuthero
    • Rhodiola Rosea
    • Schisandra Chinensis
    • Others (Maca, etc.)
  • Synthetic
    • Racetams
    • Modafinil
    • Sunifiram
    • Phosphatidylserine
    • Choline
    • DMAE
    • Unifiram
    • Hydrafinil
    • Citicoline
    • Others (Adranfinil, etc.)

By Product Category:

  • Prescribed
  • Over-the-Counter

By Form:

  • Capsules/Tablets
  • Powder
  • Drinks
  • Gummy

By Distribution Channel:

  • Health Food Stores
  • Pharmacies and Drugstores
  • Professional Healthcare Practitioners
  • Nutrition Stores
  • Healthcare Professionals
  • Online Retailers

By Region:

  • North America
  • Latin America
  • Europe
  • East Asia
  • South Asia
  • Oceania
  • Middle East and Africa

Table of Content

  • 1. Executive Summary
  • 2. Market Overview
  • 3. Market Dynamics
  • 4. Regulations
  • 5. Global Market - Pricing Analysis
  • 6. Value Chain Analysis
  • 7. Global Market Size (in Value (US$ million) and Volume (Units) Analysis 2019 to 2023 and Forecast, 2024 to 2034
  • 8. Global Market Analysis 2019 to 2023 and Forecast 2024 to 2034, By Ingredient Type
    • 8.1. Natural
      • 8.1.1. Panax Ginseng
      • 8.1.2. Ginkgo Biloba
      • 8.1.3. Asiatic Pennywort
      • 8.1.4. Ashwagandha
      • 8.1.5. Bacopa Monnieri
      • 8.1.6. Guarana
      • 8.1.7. Eleuthero
      • 8.1.8. Rhodiola Rosea
      • 8.1.9. Schisandra Chinensis
      • 8.1.10. Others (Maca, etc.)
    • 8.2. Synthetic
      • 8.2.1. Racetams
      • 8.2.2. Modafinil
      • 8.2.3. Sunifiram
      • 8.2.4. Phosphatidylserine
      • 8.2.5. Choline
      • 8.2.6. DMAE
      • 8.2.7. Unifiram
      • 8.2.8. Hydrafinil
      • 8.2.9. Citicoline
      • 8.2.10. Others (Adranfinil, etc.)
  • 9. Global Market Analysis 2019 to 2023 and Forecast 2024 to 2034, By Product Category
    • 9.1. Prescribed
    • 9.2. Over-the-Counter
  • 10. Global Market Analysis 2019 to 2023 and Forecast 2024 to 2034, By Form
    • 10.1. Capsules/Tablets
    • 10.2. Powder
    • 10.3. Drinks
    • 10.4. Gummy
  • 11. Global Market Analysis 2019 to 2023 and Forecast 2024 to 2034, By Distribution Channel
    • 11.1. Health Food Stores
    • 11.2. Pharmacies and Drugstores
    • 11.3. Professional Healthcare Practitioners
    • 11.4. Nutrition Stores
    • 11.5. Healthcare Professionals
    • 11.6. Online Retailers
  • 12. Global Market Analysis 2019 to 2023 and Forecast 2024 to 2034, By Region
    • 12.1. North America
    • 12.2. Latin America
    • 12.3. Europe
    • 12.4. East Asia
    • 12.5. South Asia
    • 12.6. Oceania
    • 12.7. Middle East & Africa
  • 13. North America Market Analysis 2019 to 2023 and Forecast 2024 to 2034
  • 14. Latin America Market Analysis 2019 to 2023 and Forecast 2024 to 2034
  • 15. Europe Market Analysis 2019 to 2023 and Forecast 2024 to 2034
  • 16. East Asia Market Analysis 2019 to 2023 and Forecast 2024 to 2034
  • 17. South Asia Market Analysis 2019 to 2023 and Forecast 2024 to 2034
  • 18. Oceania Market Analysis 2019 to 2023 and Forecast 2024 to 2034
  • 19. Middle East and Africa Market Analysis 2019 to 2023 and Forecast 2024 to 2034
  • 20. Country-level Market Analysis, 2024
  • 21. Market Structure Analysis
  • 22. Competition Analysis
    • 22.1. Onnit Labs
    • 22.2. Mental Mojo LLC
    • 22.3. NooCube
    • 22.4. Mind Lab Pro
    • 22.5. TruBrain
    • 22.6. Peak Nootropics
    • 22.7. Zhou Nutrition
    • 22.8. Kimera Koffee
    • 22.9. Neu Drink
    • 22.10. Accelerated Intelligence Inc
    • 22.11. AlternaScript LLC
    • 22.12. Cephalon Inc.
    • 22.13. SupNootropic bio co. ltd.
    • 22.14. Teva Pharmaceutical Industries Ltd
    • 22.15. Nootrobox Inc
    • 22.16. Others (On Additional Request)
  • 23. Assumptions and Acronyms Used
  • 24. Research Methodology

List of Tables

Table 1: Global Market Value (US$ million) Forecast by Region, 2019 to 2034

Table 2: Global Market Volume (Units) Forecast by Region, 2019 to 2034

Table 3: Global Market Value (US$ million) Forecast by Ingredient Type, 2019 to 2034

Table 4: Global Market Volume (Units) Forecast by Ingredient Type, 2019 to 2034

Table 5: Global Market Value (US$ million) Forecast by Product Category, 2019 to 2034

Table 6: Global Market Volume (Units) Forecast by Product Category, 2019 to 2034

Table 7: Global Market Value (US$ million) Forecast by Form, 2019 to 2034

Table 8: Global Market Volume (Units) Forecast by Form, 2019 to 2034

Table 9: Global Market Value (US$ million) Forecast by Distribution Channel, 2019 to 2034

Table 10: Global Market Volume (Units) Forecast by Distribution Channel, 2019 to 2034

Table 11: North America Market Value (US$ million) Forecast by Country, 2019 to 2034

Table 12: North America Market Volume (Units) Forecast by Country, 2019 to 2034

Table 13: North America Market Value (US$ million) Forecast by Ingredient Type, 2019 to 2034

Table 14: North America Market Volume (Units) Forecast by Ingredient Type, 2019 to 2034

Table 15: North America Market Value (US$ million) Forecast by Product Category, 2019 to 2034

Table 16: North America Market Volume (Units) Forecast by Product Category, 2019 to 2034

Table 17: North America Market Value (US$ million) Forecast by Form, 2019 to 2034

Table 18: North America Market Volume (Units) Forecast by Form, 2019 to 2034

Table 19: North America Market Value (US$ million) Forecast by Distribution Channel, 2019 to 2034

Table 20: North America Market Volume (Units) Forecast by Distribution Channel, 2019 to 2034

Table 21: Latin America Market Value (US$ million) Forecast by Country, 2019 to 2034

Table 22: Latin America Market Volume (Units) Forecast by Country, 2019 to 2034

Table 23: Latin America Market Value (US$ million) Forecast by Ingredient Type, 2019 to 2034

Table 24: Latin America Market Volume (Units) Forecast by Ingredient Type, 2019 to 2034

Table 25: Latin America Market Value (US$ million) Forecast by Product Category, 2019 to 2034

Table 26: Latin America Market Volume (Units) Forecast by Product Category, 2019 to 2034

Table 27: Latin America Market Value (US$ million) Forecast by Form, 2019 to 2034

Table 28: Latin America Market Volume (Units) Forecast by Form, 2019 to 2034

Table 29: Latin America Market Value (US$ million) Forecast by Distribution Channel, 2019 to 2034

Table 30: Latin America Market Volume (Units) Forecast by Distribution Channel, 2019 to 2034

Table 31: Europe Market Value (US$ million) Forecast by Country, 2019 to 2034

Table 32: Europe Market Volume (Units) Forecast by Country, 2019 to 2034

Table 33: Europe Market Value (US$ million) Forecast by Ingredient Type, 2019 to 2034

Table 34: Europe Market Volume (Units) Forecast by Ingredient Type, 2019 to 2034

Table 35: Europe Market Value (US$ million) Forecast by Product Category, 2019 to 2034

Table 36: Europe Market Volume (Units) Forecast by Product Category, 2019 to 2034

Table 37: Europe Market Value (US$ million) Forecast by Form, 2019 to 2034

Table 38: Europe Market Volume (Units) Forecast by Form, 2019 to 2034

Table 39: Europe Market Value (US$ million) Forecast by Distribution Channel, 2019 to 2034

Table 40: Europe Market Volume (Units) Forecast by Distribution Channel, 2019 to 2034

Table 41: East Asia Market Value (US$ million) Forecast by Country, 2019 to 2034

Table 42: East Asia Market Volume (Units) Forecast by Country, 2019 to 2034

Table 43: East Asia Market Value (US$ million) Forecast by Ingredient Type, 2019 to 2034

Table 44: East Asia Market Volume (Units) Forecast by Ingredient Type, 2019 to 2034

Table 45: East Asia Market Value (US$ million) Forecast by Product Category, 2019 to 2034

Table 46: East Asia Market Volume (Units) Forecast by Product Category, 2019 to 2034

Table 47: East Asia Market Value (US$ million) Forecast by Form, 2019 to 2034

Table 48: East Asia Market Volume (Units) Forecast by Form, 2019 to 2034

Table 49: East Asia Market Value (US$ million) Forecast by Distribution Channel, 2019 to 2034

Table 50: East Asia Market Volume (Units) Forecast by Distribution Channel, 2019 to 2034

Table 51: South Asia Market Value (US$ million) Forecast by Country, 2019 to 2034

Table 52: South Asia Market Volume (Units) Forecast by Country, 2019 to 2034

Table 53: South Asia Market Value (US$ million) Forecast by Ingredient Type, 2019 to 2034

Table 54: South Asia Market Volume (Units) Forecast by Ingredient Type, 2019 to 2034

Table 55: South Asia Market Value (US$ million) Forecast by Product Category, 2019 to 2034

Table 56: South Asia Market Volume (Units) Forecast by Product Category, 2019 to 2034

Table 57: South Asia Market Value (US$ million) Forecast by Form, 2019 to 2034

Table 58: South Asia Market Volume (Units) Forecast by Form, 2019 to 2034

Table 59: South Asia Market Value (US$ million) Forecast by Distribution Channel, 2019 to 2034

Table 60: South Asia Market Volume (Units) Forecast by Distribution Channel, 2019 to 2034

Table 61: Oceania Market Value (US$ million) Forecast by Country, 2019 to 2034

Table 62: Oceania Market Volume (Units) Forecast by Country, 2019 to 2034

Table 63: Oceania Market Value (US$ million) Forecast by Ingredient Type, 2019 to 2034

Table 64: Oceania Market Volume (Units) Forecast by Ingredient Type, 2019 to 2034

Table 65: Oceania Market Value (US$ million) Forecast by Product Category, 2019 to 2034

Table 66: Oceania Market Volume (Units) Forecast by Product Category, 2019 to 2034

Table 67: Oceania Market Value (US$ million) Forecast by Form, 2019 to 2034

Table 68: Oceania Market Volume (Units) Forecast by Form, 2019 to 2034

Table 69: Oceania Market Value (US$ million) Forecast by Distribution Channel, 2019 to 2034

Table 70: Oceania Market Volume (Units) Forecast by Distribution Channel, 2019 to 2034

Table 71: Middle East and Africa Market Value (US$ million) Forecast by Country, 2019 to 2034

Table 72: Middle East and Africa Market Volume (Units) Forecast by Country, 2019 to 2034

Table 73: Middle East and Africa Market Value (US$ million) Forecast by Ingredient Type, 2019 to 2034

Table 74: Middle East and Africa Market Volume (Units) Forecast by Ingredient Type, 2019 to 2034

Table 75: Middle East and Africa Market Value (US$ million) Forecast by Product Category, 2019 to 2034

Table 76: Middle East and Africa Market Volume (Units) Forecast by Product Category, 2019 to 2034

Table 77: Middle East and Africa Market Value (US$ million) Forecast by Form, 2019 to 2034

Table 78: Middle East and Africa Market Volume (Units) Forecast by Form, 2019 to 2034

Table 79: Middle East and Africa Market Value (US$ million) Forecast by Distribution Channel, 2019 to 2034

Table 80: Middle East and Africa Market Volume (Units) Forecast by Distribution Channel, 2019 to 2034

List of Figures

Figure 1: Global Market Value (US$ million) by Ingredient Type, 2024 to 2034

Figure 2: Global Market Value (US$ million) by Product Category, 2024 to 2034

Figure 3: Global Market Value (US$ million) by Form, 2024 to 2034

Figure 4: Global Market Value (US$ million) by Distribution Channel, 2024 to 2034

Figure 5: Global Market Value (US$ million) by Region, 2024 to 2034

Figure 6: Global Market Value (US$ million) Analysis by Region, 2019 to 2034

Figure 7: Global Market Volume (Units) Analysis by Region, 2019 to 2034

Figure 8: Global Market Value Share (%) and BPS Analysis by Region, 2024 to 2034

Figure 9: Global Market Y-o-Y Growth (%) Projections by Region, 2024 to 2034

Figure 10: Global Market Value (US$ million) Analysis by Ingredient Type, 2019 to 2034

Figure 11: Global Market Volume (Units) Analysis by Ingredient Type, 2019 to 2034

Figure 12: Global Market Value Share (%) and BPS Analysis by Ingredient Type, 2024 to 2034

Figure 13: Global Market Y-o-Y Growth (%) Projections by Ingredient Type, 2024 to 2034

Figure 14: Global Market Value (US$ million) Analysis by Product Category, 2019 to 2034

Figure 15: Global Market Volume (Units) Analysis by Product Category, 2019 to 2034

Figure 16: Global Market Value Share (%) and BPS Analysis by Product Category, 2024 to 2034

Figure 17: Global Market Y-o-Y Growth (%) Projections by Product Category, 2024 to 2034

Figure 18: Global Market Value (US$ million) Analysis by Form, 2019 to 2034

Figure 19: Global Market Volume (Units) Analysis by Form, 2019 to 2034

Figure 20: Global Market Value Share (%) and BPS Analysis by Form, 2024 to 2034

Figure 21: Global Market Y-o-Y Growth (%) Projections by Form, 2024 to 2034

Figure 22: Global Market Value (US$ million) Analysis by Distribution Channel, 2019 to 2034

Figure 23: Global Market Volume (Units) Analysis by Distribution Channel, 2019 to 2034

Figure 24: Global Market Value Share (%) and BPS Analysis by Distribution Channel, 2024 to 2034

Figure 25: Global Market Y-o-Y Growth (%) Projections by Distribution Channel, 2024 to 2034

Figure 26: Global Market Attractiveness by Ingredient Type, 2024 to 2034

Figure 27: Global Market Attractiveness by Product Category, 2024 to 2034

Figure 28: Global Market Attractiveness by Form, 2024 to 2034

Figure 29: Global Market Attractiveness by Distribution Channel, 2024 to 2034

Figure 30: Global Market Attractiveness by Region, 2024 to 2034

Figure 31: North America Market Value (US$ million) by Ingredient Type, 2024 to 2034

Figure 32: North America Market Value (US$ million) by Product Category, 2024 to 2034

Figure 33: North America Market Value (US$ million) by Form, 2024 to 2034

Figure 34: North America Market Value (US$ million) by Distribution Channel, 2024 to 2034

Figure 35: North America Market Value (US$ million) by Country, 2024 to 2034

Figure 36: North America Market Value (US$ million) Analysis by Country, 2019 to 2034

Figure 37: North America Market Volume (Units) Analysis by Country, 2019 to 2034

Figure 38: North America Market Value Share (%) and BPS Analysis by Country, 2024 to 2034

Figure 39: North America Market Y-o-Y Growth (%) Projections by Country, 2024 to 2034

Figure 40: North America Market Value (US$ million) Analysis by Ingredient Type, 2019 to 2034

Figure 41: North America Market Volume (Units) Analysis by Ingredient Type, 2019 to 2034

Figure 42: North America Market Value Share (%) and BPS Analysis by Ingredient Type, 2024 to 2034

Figure 43: North America Market Y-o-Y Growth (%) Projections by Ingredient Type, 2024 to 2034

Figure 44: North America Market Value (US$ million) Analysis by Product Category, 2019 to 2034

Figure 45: North America Market Volume (Units) Analysis by Product Category, 2019 to 2034

Figure 46: North America Market Value Share (%) and BPS Analysis by Product Category, 2024 to 2034

Figure 47: North America Market Y-o-Y Growth (%) Projections by Product Category, 2024 to 2034

Figure 48: North America Market Value (US$ million) Analysis by Form, 2019 to 2034

Figure 49: North America Market Volume (Units) Analysis by Form, 2019 to 2034

Figure 50: North America Market Value Share (%) and BPS Analysis by Form, 2024 to 2034

Figure 51: North America Market Y-o-Y Growth (%) Projections by Form, 2024 to 2034

Figure 52: North America Market Value (US$ million) Analysis by Distribution Channel, 2019 to 2034

Figure 53: North America Market Volume (Units) Analysis by Distribution Channel, 2019 to 2034

Figure 54: North America Market Value Share (%) and BPS Analysis by Distribution Channel, 2024 to 2034

Figure 55: North America Market Y-o-Y Growth (%) Projections by Distribution Channel, 2024 to 2034

Figure 56: North America Market Attractiveness by Ingredient Type, 2024 to 2034

Figure 57: North America Market Attractiveness by Product Category, 2024 to 2034

Figure 58: North America Market Attractiveness by Form, 2024 to 2034

Figure 59: North America Market Attractiveness by Distribution Channel, 2024 to 2034

Figure 60: North America Market Attractiveness by Country, 2024 to 2034

Figure 61: Latin America Market Value (US$ million) by Ingredient Type, 2024 to 2034

Figure 62: Latin America Market Value (US$ million) by Product Category, 2024 to 2034

Figure 63: Latin America Market Value (US$ million) by Form, 2024 to 2034

Figure 64: Latin America Market Value (US$ million) by Distribution Channel, 2024 to 2034

Figure 65: Latin America Market Value (US$ million) by Country, 2024 to 2034

Figure 66: Latin America Market Value (US$ million) Analysis by Country, 2019 to 2034

Figure 67: Latin America Market Volume (Units) Analysis by Country, 2019 to 2034

Figure 68: Latin America Market Value Share (%) and BPS Analysis by Country, 2024 to 2034

Figure 69: Latin America Market Y-o-Y Growth (%) Projections by Country, 2024 to 2034

Figure 70: Latin America Market Value (US$ million) Analysis by Ingredient Type, 2019 to 2034

Figure 71: Latin America Market Volume (Units) Analysis by Ingredient Type, 2019 to 2034

Figure 72: Latin America Market Value Share (%) and BPS Analysis by Ingredient Type, 2024 to 2034

Figure 73: Latin America Market Y-o-Y Growth (%) Projections by Ingredient Type, 2024 to 2034

Figure 74: Latin America Market Value (US$ million) Analysis by Product Category, 2019 to 2034

Figure 75: Latin America Market Volume (Units) Analysis by Product Category, 2019 to 2034

Figure 76: Latin America Market Value Share (%) and BPS Analysis by Product Category, 2024 to 2034

Figure 77: Latin America Market Y-o-Y Growth (%) Projections by Product Category, 2024 to 2034

Figure 78: Latin America Market Value (US$ million) Analysis by Form, 2019 to 2034

Figure 79: Latin America Market Volume (Units) Analysis by Form, 2019 to 2034

Figure 80: Latin America Market Value Share (%) and BPS Analysis by Form, 2024 to 2034

Figure 81: Latin America Market Y-o-Y Growth (%) Projections by Form, 2024 to 2034

Figure 82: Latin America Market Value (US$ million) Analysis by Distribution Channel, 2019 to 2034

Figure 83: Latin America Market Volume (Units) Analysis by Distribution Channel, 2019 to 2034

Figure 84: Latin America Market Value Share (%) and BPS Analysis by Distribution Channel, 2024 to 2034

Figure 85: Latin America Market Y-o-Y Growth (%) Projections by Distribution Channel, 2024 to 2034

Figure 86: Latin America Market Attractiveness by Ingredient Type, 2024 to 2034

Figure 87: Latin America Market Attractiveness by Product Category, 2024 to 2034

Figure 88: Latin America Market Attractiveness by Form, 2024 to 2034

Figure 89: Latin America Market Attractiveness by Distribution Channel, 2024 to 2034

Figure 90: Latin America Market Attractiveness by Country, 2024 to 2034

Figure 91: Europe Market Value (US$ million) by Ingredient Type, 2024 to 2034

Figure 92: Europe Market Value (US$ million) by Product Category, 2024 to 2034

Figure 93: Europe Market Value (US$ million) by Form, 2024 to 2034

Figure 94: Europe Market Value (US$ million) by Distribution Channel, 2024 to 2034

Figure 95: Europe Market Value (US$ million) by Country, 2024 to 2034

Figure 96: Europe Market Value (US$ million) Analysis by Country, 2019 to 2034

Figure 97: Europe Market Volume (Units) Analysis by Country, 2019 to 2034

Figure 98: Europe Market Value Share (%) and BPS Analysis by Country, 2024 to 2034

Figure 99: Europe Market Y-o-Y Growth (%) Projections by Country, 2024 to 2034

Figure 100: Europe Market Value (US$ million) Analysis by Ingredient Type, 2019 to 2034

Figure 101: Europe Market Volume (Units) Analysis by Ingredient Type, 2019 to 2034

Figure 102: Europe Market Value Share (%) and BPS Analysis by Ingredient Type, 2024 to 2034

Figure 103: Europe Market Y-o-Y Growth (%) Projections by Ingredient Type, 2024 to 2034

Figure 104: Europe Market Value (US$ million) Analysis by Product Category, 2019 to 2034

Figure 105: Europe Market Volume (Units) Analysis by Product Category, 2019 to 2034

Figure 106: Europe Market Value Share (%) and BPS Analysis by Product Category, 2024 to 2034

Figure 107: Europe Market Y-o-Y Growth (%) Projections by Product Category, 2024 to 2034

Figure 108: Europe Market Value (US$ million) Analysis by Form, 2019 to 2034

Figure 109: Europe Market Volume (Units) Analysis by Form, 2019 to 2034

Figure 110: Europe Market Value Share (%) and BPS Analysis by Form, 2024 to 2034

Figure 111: Europe Market Y-o-Y Growth (%) Projections by Form, 2024 to 2034

Figure 112: Europe Market Value (US$ million) Analysis by Distribution Channel, 2019 to 2034

Figure 113: Europe Market Volume (Units) Analysis by Distribution Channel, 2019 to 2034

Figure 114: Europe Market Value Share (%) and BPS Analysis by Distribution Channel, 2024 to 2034

Figure 115: Europe Market Y-o-Y Growth (%) Projections by Distribution Channel, 2024 to 2034

Figure 116: Europe Market Attractiveness by Ingredient Type, 2024 to 2034

Figure 117: Europe Market Attractiveness by Product Category, 2024 to 2034

Figure 118: Europe Market Attractiveness by Form, 2024 to 2034

Figure 119: Europe Market Attractiveness by Distribution Channel, 2024 to 2034

Figure 120: Europe Market Attractiveness by Country, 2024 to 2034

Figure 121: East Asia Market Value (US$ million) by Ingredient Type, 2024 to 2034

Figure 122: East Asia Market Value (US$ million) by Product Category, 2024 to 2034

Figure 123: East Asia Market Value (US$ million) by Form, 2024 to 2034

Figure 124: East Asia Market Value (US$ million) by Distribution Channel, 2024 to 2034

Figure 125: East Asia Market Value (US$ million) by Country, 2024 to 2034

Figure 126: East Asia Market Value (US$ million) Analysis by Country, 2019 to 2034

Figure 127: East Asia Market Volume (Units) Analysis by Country, 2019 to 2034

Figure 128: East Asia Market Value Share (%) and BPS Analysis by Country, 2024 to 2034

Figure 129: East Asia Market Y-o-Y Growth (%) Projections by Country, 2024 to 2034

Figure 130: East Asia Market Value (US$ million) Analysis by Ingredient Type, 2019 to 2034

Figure 131: East Asia Market Volume (Units) Analysis by Ingredient Type, 2019 to 2034

Figure 132: East Asia Market Value Share (%) and BPS Analysis by Ingredient Type, 2024 to 2034

Figure 133: East Asia Market Y-o-Y Growth (%) Projections by Ingredient Type, 2024 to 2034

Figure 134: East Asia Market Value (US$ million) Analysis by Product Category, 2019 to 2034

Figure 135: East Asia Market Volume (Units) Analysis by Product Category, 2019 to 2034

Figure 136: East Asia Market Value Share (%) and BPS Analysis by Product Category, 2024 to 2034

Figure 137: East Asia Market Y-o-Y Growth (%) Projections by Product Category, 2024 to 2034

Figure 138: East Asia Market Value (US$ million) Analysis by Form, 2019 to 2034

Figure 139: East Asia Market Volume (Units) Analysis by Form, 2019 to 2034

Figure 140: East Asia Market Value Share (%) and BPS Analysis by Form, 2024 to 2034

Figure 141: East Asia Market Y-o-Y Growth (%) Projections by Form, 2024 to 2034

Figure 142: East Asia Market Value (US$ million) Analysis by Distribution Channel, 2019 to 2034

Figure 143: East Asia Market Volume (Units) Analysis by Distribution Channel, 2019 to 2034

Figure 144: East Asia Market Value Share (%) and BPS Analysis by Distribution Channel, 2024 to 2034

Figure 145: East Asia Market Y-o-Y Growth (%) Projections by Distribution Channel, 2024 to 2034

Figure 146: East Asia Market Attractiveness by Ingredient Type, 2024 to 2034

Figure 147: East Asia Market Attractiveness by Product Category, 2024 to 2034

Figure 148: East Asia Market Attractiveness by Form, 2024 to 2034

Figure 149: East Asia Market Attractiveness by Distribution Channel, 2024 to 2034

Figure 150: East Asia Market Attractiveness by Country, 2024 to 2034

Figure 151: South Asia Market Value (US$ million) by Ingredient Type, 2024 to 2034

Figure 152: South Asia Market Value (US$ million) by Product Category, 2024 to 2034

Figure 153: South Asia Market Value (US$ million) by Form, 2024 to 2034

Figure 154: South Asia Market Value (US$ million) by Distribution Channel, 2024 to 2034

Figure 155: South Asia Market Value (US$ million) by Country, 2024 to 2034

Figure 156: South Asia Market Value (US$ million) Analysis by Country, 2019 to 2034

Figure 157: South Asia Market Volume (Units) Analysis by Country, 2019 to 2034

Figure 158: South Asia Market Value Share (%) and BPS Analysis by Country, 2024 to 2034

Figure 159: South Asia Market Y-o-Y Growth (%) Projections by Country, 2024 to 2034

Figure 160: South Asia Market Value (US$ million) Analysis by Ingredient Type, 2019 to 2034

Figure 161: South Asia Market Volume (Units) Analysis by Ingredient Type, 2019 to 2034

Figure 162: South Asia Market Value Share (%) and BPS Analysis by Ingredient Type, 2024 to 2034

Figure 163: South Asia Market Y-o-Y Growth (%) Projections by Ingredient Type, 2024 to 2034

Figure 164: South Asia Market Value (US$ million) Analysis by Product Category, 2019 to 2034

Figure 165: South Asia Market Volume (Units) Analysis by Product Category, 2019 to 2034

Figure 166: South Asia Market Value Share (%) and BPS Analysis by Product Category, 2024 to 2034

Figure 167: South Asia Market Y-o-Y Growth (%) Projections by Product Category, 2024 to 2034

Figure 168: South Asia Market Value (US$ million) Analysis by Form, 2019 to 2034

Figure 169: South Asia Market Volume (Units) Analysis by Form, 2019 to 2034

Figure 170: South Asia Market Value Share (%) and BPS Analysis by Form, 2024 to 2034

Figure 171: South Asia Market Y-o-Y Growth (%) Projections by Form, 2024 to 2034

Figure 172: South Asia Market Value (US$ million) Analysis by Distribution Channel, 2019 to 2034

Figure 173: South Asia Market Volume (Units) Analysis by Distribution Channel, 2019 to 2034

Figure 174: South Asia Market Value Share (%) and BPS Analysis by Distribution Channel, 2024 to 2034

Figure 175: South Asia Market Y-o-Y Growth (%) Projections by Distribution Channel, 2024 to 2034

Figure 176: South Asia Market Attractiveness by Ingredient Type, 2024 to 2034

Figure 177: South Asia Market Attractiveness by Product Category, 2024 to 2034

Figure 178: South Asia Market Attractiveness by Form, 2024 to 2034

Figure 179: South Asia Market Attractiveness by Distribution Channel, 2024 to 2034

Figure 180: South Asia Market Attractiveness by Country, 2024 to 2034

Figure 181: Oceania Market Value (US$ million) by Ingredient Type, 2024 to 2034

Figure 182: Oceania Market Value (US$ million) by Product Category, 2024 to 2034

Figure 183: Oceania Market Value (US$ million) by Form, 2024 to 2034

Figure 184: Oceania Market Value (US$ million) by Distribution Channel, 2024 to 2034

Figure 185: Oceania Market Value (US$ million) by Country, 2024 to 2034

Figure 186: Oceania Market Value (US$ million) Analysis by Country, 2019 to 2034

Figure 187: Oceania Market Volume (Units) Analysis by Country, 2019 to 2034

Figure 188: Oceania Market Value Share (%) and BPS Analysis by Country, 2024 to 2034

Figure 189: Oceania Market Y-o-Y Growth (%) Projections by Country, 2024 to 2034

Figure 190: Oceania Market Value (US$ million) Analysis by Ingredient Type, 2019 to 2034

Figure 191: Oceania Market Volume (Units) Analysis by Ingredient Type, 2019 to 2034

Figure 192: Oceania Market Value Share (%) and BPS Analysis by Ingredient Type, 2024 to 2034

Figure 193: Oceania Market Y-o-Y Growth (%) Projections by Ingredient Type, 2024 to 2034

Figure 194: Oceania Market Value (US$ million) Analysis by Product Category, 2019 to 2034

Figure 195: Oceania Market Volume (Units) Analysis by Product Category, 2019 to 2034

Figure 196: Oceania Market Value Share (%) and BPS Analysis by Product Category, 2024 to 2034

Figure 197: Oceania Market Y-o-Y Growth (%) Projections by Product Category, 2024 to 2034

Figure 198: Oceania Market Value (US$ million) Analysis by Form, 2019 to 2034

Figure 199: Oceania Market Volume (Units) Analysis by Form, 2019 to 2034

Figure 200: Oceania Market Value Share (%) and BPS Analysis by Form, 2024 to 2034

Figure 201: Oceania Market Y-o-Y Growth (%) Projections by Form, 2024 to 2034

Figure 202: Oceania Market Value (US$ million) Analysis by Distribution Channel, 2019 to 2034

Figure 203: Oceania Market Volume (Units) Analysis by Distribution Channel, 2019 to 2034

Figure 204: Oceania Market Value Share (%) and BPS Analysis by Distribution Channel, 2024 to 2034

Figure 205: Oceania Market Y-o-Y Growth (%) Projections by Distribution Channel, 2024 to 2034

Figure 206: Oceania Market Attractiveness by Ingredient Type, 2024 to 2034

Figure 207: Oceania Market Attractiveness by Product Category, 2024 to 2034

Figure 208: Oceania Market Attractiveness by Form, 2024 to 2034

Figure 209: Oceania Market Attractiveness by Distribution Channel, 2024 to 2034

Figure 210: Oceania Market Attractiveness by Country, 2024 to 2034

Figure 211: Middle East and Africa Market Value (US$ million) by Ingredient Type, 2024 to 2034

Figure 212: Middle East and Africa Market Value (US$ million) by Product Category, 2024 to 2034

Figure 213: Middle East and Africa Market Value (US$ million) by Form, 2024 to 2034

Figure 214: Middle East and Africa Market Value (US$ million) by Distribution Channel, 2024 to 2034

Figure 215: Middle East and Africa Market Value (US$ million) by Country, 2024 to 2034

Figure 216: Middle East and Africa Market Value (US$ million) Analysis by Country, 2019 to 2034

Figure 217: Middle East and Africa Market Volume (Units) Analysis by Country, 2019 to 2034

Figure 218: Middle East and Africa Market Value Share (%) and BPS Analysis by Country, 2024 to 2034

Figure 219: Middle East and Africa Market Y-o-Y Growth (%) Projections by Country, 2024 to 2034

Figure 220: Middle East and Africa Market Value (US$ million) Analysis by Ingredient Type, 2019 to 2034

Figure 221: Middle East and Africa Market Volume (Units) Analysis by Ingredient Type, 2019 to 2034

Figure 222: Middle East and Africa Market Value Share (%) and BPS Analysis by Ingredient Type, 2024 to 2034

Figure 223: Middle East and Africa Market Y-o-Y Growth (%) Projections by Ingredient Type, 2024 to 2034

Figure 224: Middle East and Africa Market Value (US$ million) Analysis by Product Category, 2019 to 2034

Figure 225: Middle East and Africa Market Volume (Units) Analysis by Product Category, 2019 to 2034

Figure 226: Middle East and Africa Market Value Share (%) and BPS Analysis by Product Category, 2024 to 2034

Figure 227: Middle East and Africa Market Y-o-Y Growth (%) Projections by Product Category, 2024 to 2034

Figure 228: Middle East and Africa Market Value (US$ million) Analysis by Form, 2019 to 2034

Figure 229: Middle East and Africa Market Volume (Units) Analysis by Form, 2019 to 2034

Figure 230: Middle East and Africa Market Value Share (%) and BPS Analysis by Form, 2024 to 2034

Figure 231: Middle East and Africa Market Y-o-Y Growth (%) Projections by Form, 2024 to 2034

Figure 232: Middle East and Africa Market Value (US$ million) Analysis by Distribution Channel, 2019 to 2034

Figure 233: Middle East and Africa Market Volume (Units) Analysis by Distribution Channel, 2019 to 2034

Figure 234: Middle East and Africa Market Value Share (%) and BPS Analysis by Distribution Channel, 2024 to 2034

Figure 235: Middle East and Africa Market Y-o-Y Growth (%) Projections by Distribution Channel, 2024 to 2034

Figure 236: Middle East and Africa Market Attractiveness by Ingredient Type, 2024 to 2034

Figure 237: Middle East and Africa Market Attractiveness by Product Category, 2024 to 2034

Figure 238: Middle East and Africa Market Attractiveness by Form, 2024 to 2034

Figure 239: Middle East and Africa Market Attractiveness by Distribution Channel, 2024 to 2034

Figure 240: Middle East and Africa Market Attractiveness by Country, 2024 to 2034

Frequently Asked Questions

How big is the memory support supplement market?

The market is set to reach USD 2,467.1 million in 2024.

What is the forecast for the memory support supplement market?

Demand for memory support supplements is slated to expand at a 7.3% CAGR by 2034.

What is the outlook for the memory support supplement market?

The market is set to reach USD 4,989.4 million in 2034.

Who are the key players in the memory support supplement market?

Mindbodygreen, Bulletproof, and Qualia are the key players.

Which form would lead the memory support supplement market?

Capsules/tablets segment is estimated to hold a significant market share in 2024.

Explore Similar Insights

Future Market Insights

Memory Support Supplement Market