Unsupported Single Coated Tape Market Outlook for 2023 to 2033

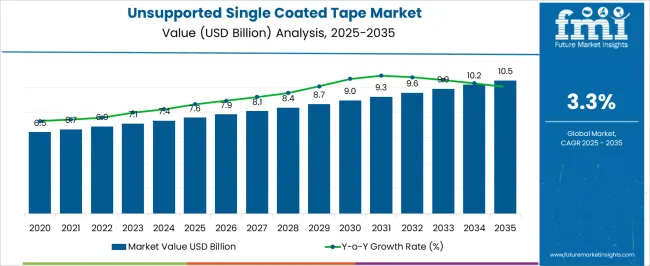
The global Unsupported Single Coated Tape Market is estimated to clock a revenue of USD 7.1 billion in 2023. The unsupported single coated tape suppliers can expect a consistent CAGR of 3.5% through 2033, with a forecast valuation of USD 10.9 billion by 2033.

Attribute Details
Unsupported Single Coated Tape Market Size, 2022 USD 5.7 billion
Unsupported Single Coated Tape Market Size, 2023 USD 7.1 billion
Unsupported Single Coated Tape Market Size, 2033 USD 10.9 billion
Value-based CAGR (2023 to 2033) 3.5%

Key Trends Spotted in the Unsupported Single Coated Tape Market

Availability of new and finer tapes! There is a running trend to bring efficiencies in tape technology. For this, manufacturers are incessantly working toward the development of tapes with more adhesive strength, durability, and temperature resistance. This opens the scope of unsupported single coated tape in demanding applications where high-level performance and long-term reliability are critical.

Surging demand for lightweight products! The demand for compact and lightweight products is supplementing the market growth of unsupported single coated tape. These tapes offer a secure and reliable bonding solution without adding considerable weight to the final product, thus making them ideal for industries concerned about optimizing space and reducing weight.

The future is sustainable! Key players are introducing eco-friendly and sustainable unsupported single-coated tapes due to rising environmental concerns. Manufacturers are concentrating on developing tapes that can be recycled and have a low impact on the environment.

Demand for a higher level of adhesion! There is a growing demand for better bonding between the substrate and tape, along with the requirement for improved abrasion resistance, to cater to several end-use industries.

Historical Growth of the Unsupported Single Coated Tape Market Vs. Forecast Outlook

Attributes Details
Unsupported Single Coated Tape Market Size (2018) USD 4.97 billion
Unsupported Single Coated Tape Market Size (2022) USD 5.7 billion

The market valuation of unsupported single-coated tapes appreciated from USD 4.97 billion in 2018 to USD 5.7 billion by 2022. Presently, it stands at a valuation of USD 7.1 billion and is projected to arrive at USD 10.9 billion by 2033, as per the latest market study. Key factors that have been propelling the product sales include:
  • Innovation in the tape formulation to drive better outcomes in demanding applications.
  • Surging efforts by key players to capture new markets by shifting their base or production capacity in their target country.
  • Government support for different industries like the medical sector and the construction sector has a ripple effect on sales of unsupported single-coated tape.

Country-wise Insights

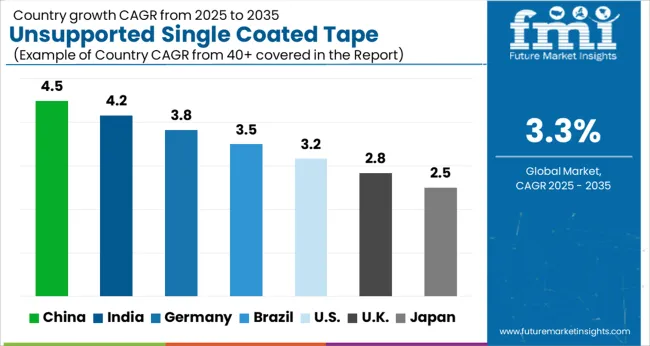
Countries CAGR (2023 to 2033)
India 6.2%
China 5.4%
United Kingdom 4.1%
Canada 3.5%
Thailand 5.4%

Surging Construction Sector in India to Propel Demand for Unsupported Single Coated Tapes

The India unsupported single coated tape market is predicted to expand at a CAGR of 6.2% through 2033. Market scope is predicted to be impacted by the following factors:

  • Availability of economical labor and low-cost raw materials in India is attracting investments by leading players. Thus, in the future, the growth scope for unsupported single coated tape remains high.
  • Demand for these tapes is predicted to witness a constant rise in applications like sealing. Robust activities related to building and construction in the economy are anticipated to maintain a continuous demand for unsupported single-coated tapes.

Robust Healthcare System in China Contributing to Market Growth

The unsupported single coated tape market in China is estimated to record a CAGR of 5.4% over the assessment period. Mentioned below are the key factors that are impelling sales of these tapes.

  • The thriving healthcare sector of China is creating an upsurge in the demand for unsupported single-coated tapes. These tapes are used in the form of medical tapes for stick-to-skin applications and to seal, secure, or hold medical equipment.
  • Soaring demand for these tapes in multiple sectors like electrical, automotive, and packaging is positively impacting the unsupported single coated tape market size. Within these sectors, the tape is used for applications like masking, bonding, insulation, etc.

Players in the United Kingdom Using Regulations as a Driver for Innovation

The sales of unsupported single coated tape in the United Kingdom are predicted to expand at a CAGR of 4.1% through 2033. Compared to other countries in Europe, the rate of product sales is expected to be higher than Germany, Italy, and France, where the CAGRs have been estimated to be 2.1%, 3.2%, and 3.5%, respectively, throughout the forecast period. New legislation related to the use of adhesive tapes is a major factor dimming the prospects for unsupported single coated tape in the region.

For a robust future of adhesive-tape-related organizations, these organizations are expected to adapt to the new legal requirements by integrating their business models with these regulatory updates. In the future, companies, whether large or small, who incorporate regulatory concerns in product development, product procurement, and sustainable development are predicted to achieve success in unsupported single coated tape business.

Key Players Eyeing Canada as a Profitable Business Venture

The unsupported single coated tape market in Canada is predicted to have higher growth prospects than in the United States. Since the market reach in the United States is already quite high for the established players, they are seeking new markets with potential for growth. The following factors are positively impacting the sales of unsupported single coated tape in Canada:

  • The increase in migration in Canada for educational, employment, or other purposes is expanding the population base in the country. This is thus providing key players with significant opportunities to capture the emerging market.
  • Expanding applications of these tapes in automotive, hygiene, medical, construction, and other sectors is propelling their demand.

Thailand Offers Significant Opportunities to Key Market Players

In Asia Pacific, Thailand is another significant market for unsupported single coated tape. The market in the country is predicted to register a CAGR of 5.4% through 2033.

  • Increasing demand for unsupported single coated tape in demanding applications where high performance and long-term reliability are critical.
  • Thailand offers significant opportunities to key players in the form of cheap labor, which can cut down on the overall costs of their offering. Therefore, market participants are strategically expanding their base in Thailand via acquisitions, partnerships, and mergers.

Category-wise Insights

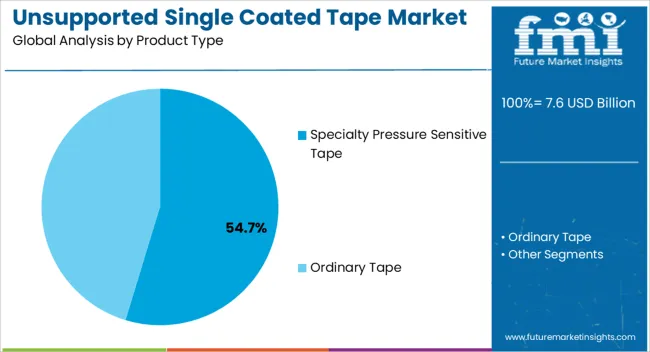
Ordinary Tape Outshines Specialty Pressure Sensitive Tape

Top Product Type Market Share (2023)
Ordinary Tape 55.6%

By product type, the ordinary tape segment accounts for 55.6% of the market share. These tapes are used for their versatility and effectiveness and find extensive applications in sectors like construction, medical, automotive, white goods, etc. Since these sectors exhibit healthy growth, the rate at which unsupported single-coated tape is purchased is predicted to be steady.

These tapes are found to be utilized in both industrial as well as consumer use, and their utilization goes beyond the regular uses like securing wires, masking areas while painting, sealing packages, etc.

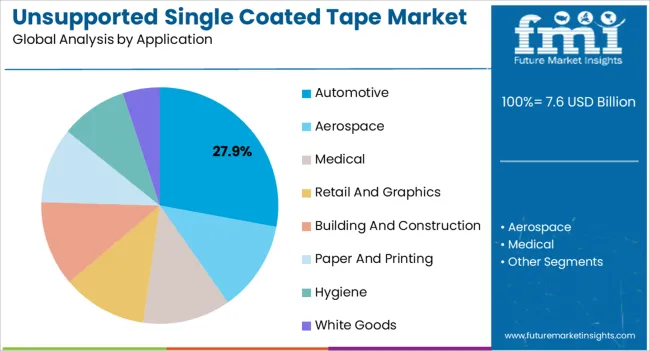
Building and Construction Sector Extensively Deploys Unsupported Single Coated Tapes

Top Application Market Share (2023)
Building and Construction 31.1%

Unsupported single-coated tape is an essential tool for many contractors working in the construction and building sector. Due to its versatility, cost-effectiveness, and convenience, the product finds extensive application in the construction sector. The building and construction sector is predicted to account for a 31.1% share of the global market

Healthy growth of the building and construction sector is projected to spur demand for unsupported single-coated tape to seal and bond multiple building materials like plywood, drywall, roofing materials, and insulation. The demand for these tapes to mask off areas during wall painting and various finishing processes is also projected to upsurge.

Key Strategies Adopted by Unsupported Single Coated Tape Market Players

Key players are strategizing to expand their businesses in emerging markets where the construction and packaging sectors are thriving. Market participants are also striving to develop high-performing tapes that can beat harsh weather conditions and maintain their adhesiveness for longer periods.

A key focus while moving forward is product sustainability. For instance, Nitto Denko Corporation, one of the leading players in the unsupported single coated tape market, offers an eco-friendly single-sided tape, HF-105E, which is hand-cuttable, flexible, and capable of adhering to the surface of the substrate. It is effective in fixing harnesses for automobile roof materials.
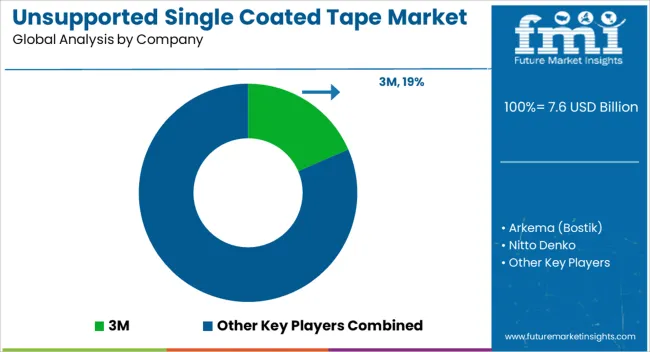
Profiling of Leading Companies Providing Unsupported Single Coated Tapes

Company Name Details
Arkema (Bostik) The firm is headquartered in France, and it produces an extensive range of products like sealants, adhesives, and coatings. The Bostik division is a key producer of unsupported single coated tape, thus serving industries like packaging, construction, and automotive.
3M The company is headquartered in the United States. It develops a broad range of products like tapes, adhesives, medical devices, and abrasives. The Industrial Adhesives and Tapes Division is a key producer of unsupported single coated tape.
Nitto Denko The company is headquartered in Osaka. It develops a range of products like tapes, adhesives, and optical films.
Scapa The conglomerate is based in Blackburn. It manufactures multiple products like release liners, labels, and adhesive tapes. The Industrial Division of the company produces unsupported single coated tape.

Scope of Report

Report Attribute Details
Growth Rate CAGR of 3.5% from 2023 to 2033
Base Year for Estimation 2022
Historical Data 2018 to 2022
Forecast Period 2023 to 2033
Quantitative Units Revenue in USD million and CAGR from 2023 to 2033
Report Coverage Revenue Forecast, Volume Forecast, Company Ranking, Competitive Landscape, Growth Factors, Trends and Pricing Analysis
Segments Covered Product Type, Application, Region
Regions Covered North America; Latin America; Western Europe; Easter Europe; Asia Pacific; Middle East and Africa
Key Countries Profiled The United States, Canada, Brazil, Argentina, Germany, The United Kingdom, France, Spain, Italy, Nordics, BENELUX, Australia and New Zealand, China, India, ASEAN, GCC, South Africa
Key Companies Profiled Arkema (Bostik); 3M; Nitto Denko; Scapa; Avery Dennison; Syntac Coated Products; Intertape Polymer, Adhesives Research; Berry Plastics; Cantech; American Biltrite; Shurtape Technologies; Essentra; Adhesive Applications; Mactac; Main Tape; tesa SE; DYNAREX; DeWAL Industries, Medline Medical; Lamart Corp.; McKesson; Johnson & Johnson; Cardinal Health; Worthen Industries; Coroplast Tape Corporation; CCT Tapes
Customization Available Upon Request

Key Companies Providing Unsupported Single Coated Tape

  • Arkema (Bostik)
  • 3M
  • Nitto Denko
  • Scapa
  • Avery Dennison
  • Syntac Coated Products
  • Intertape Polymer, Adhesives Research
  • Berry Plastics
  • Cantech
  • American Biltrite
  • Shurtape Technologies
  • Essentra
  • Adhesive Applications
  • Mactac
  • Main Tape
  • tesa SE
  • DYNAREX
  • DeWAL Industries, Medline Medical
  • Lamart Corp.
  • McKesson
  • Johnson & Johnson
  • Cardinal Health
  • Worthen Industries
  • Coroplast Tape Corporation
  • CCT Tapes

Key Segments Profiled in the Unsupported Single Coated Tape Market Survey

By Product Type:

  • Ordinary Tape
  • Specialty Pressure Sensitive Tape

By Application:

  • Aerospace
  • Medical
  • Retail and Graphics
  • Building and Construction
  • Paper and Printing
  • Hygiene
  • White Goods
  • Automotive

By Region:

  • North America
  • Latin America
  • Western Europe
  • Easter Europe
  • Asia Pacific Excluding Japan
  • Japan
  • Middle East and Africa

Table of Content

  • 1. Executive Summary
  • 2. Market Overview
  • 3. Market Background
  • 4. Global Market Analysis 2018 to 2022 and Forecast, 2023 to 2033
  • 5. Global Market Analysis 2018 to 2022 and Forecast 2023 to 2033, By Product Type
    • 5.1. Ordinary Tape
    • 5.2. Specialty Pressure Sensitive Tape
  • 6. Global Market Analysis 2018 to 2022 and Forecast 2023 to 2033, By Application
    • 6.1. Aerospace
    • 6.2. Medical
    • 6.3. Retail/Graphics
    • 6.4. Building/Construction
    • 6.5. Paper/Printing
    • 6.6. Hygiene
    • 6.7. White Goods
    • 6.8. Automotive
  • 7. Global Market Analysis 2018 to 2022 and Forecast 2023 to 2033, By Region
    • 7.1. North America
    • 7.2. Latin America
    • 7.3. Western Europe
    • 7.4. Eastern Europe
    • 7.5. South Asia and Pacific
    • 7.6. East Asia
    • 7.7. Middle East and Africa
  • 8. North America Market Analysis 2018 to 2022 and Forecast 2023 to 2033, By Country
  • 9. Latin America Market Analysis 2018 to 2022 and Forecast 2023 to 2033, By Country
  • 10. Western Europe Market Analysis 2018 to 2022 and Forecast 2023 to 2033, By Country
  • 11. Eastern Europe Market Analysis 2018 to 2022 and Forecast 2023 to 2033, By Country
  • 12. South Asia and Pacific Market Analysis 2018 to 2022 and Forecast 2023 to 2033, By Country
  • 13. East Asia Market Analysis 2018 to 2022 and Forecast 2023 to 2033, By Country
  • 14. Middle East and Africa Market Analysis 2018 to 2022 and Forecast 2023 to 2033, By Country
  • 15. Key Countries Market Analysis
  • 16. Market Structure Analysis
  • 17. Competition Analysis
    • 17.1. Arkema (Bostik)
    • 17.2. 3M
    • 17.3. Nitto Denko
    • 17.4. Scapa
    • 17.5. Avery Dennison
    • 17.6. Syntac Coated Products
    • 17.7. Intertape Polymer, Adhesives Research
    • 17.8. Berry Plastics
    • 17.9. Cantech
    • 17.10. American Biltrite
    • 17.11. Shurtape Technologies
    • 17.12. Essentra
    • 17.13. Adhesive Applications
  • 18. Assumptions & Acronyms Used
  • 19. Research Methodology

List of Tables

Table 1: Global Market Value (US$ Million) Forecast by Region, 2018 to 2023

Table 2: Global Market Volume (Sq.Mtr) Forecast by Region, 2018 to 2023

Table 3: Global Market Value (US$ Million) Forecast by Product Type, 2018 to 2023

Table 4: Global Market Volume (Sq.Mtr) Forecast by Product Type, 2018 to 2023

Table 5: Global Market Value (US$ Million) Forecast by Application, 2018 to 2023

Table 6: Global Market Volume (Sq.Mtr) Forecast by Application, 2018 to 2023

Table 7: North America Market Value (US$ Million) Forecast by Country, 2018 to 2023

Table 8: North America Market Volume (Sq.Mtr) Forecast by Country, 2018 to 2023

Table 9: North America Market Value (US$ Million) Forecast by Product Type, 2018 to 2023

Table 10: North America Market Volume (Sq.Mtr) Forecast by Product Type, 2018 to 2023

Table 11: North America Market Value (US$ Million) Forecast by Application, 2018 to 2023

Table 12: North America Market Volume (Sq.Mtr) Forecast by Application, 2018 to 2023

Table 13: Latin America Market Value (US$ Million) Forecast by Country, 2018 to 2023

Table 14: Latin America Market Volume (Sq.Mtr) Forecast by Country, 2018 to 2023

Table 15: Latin America Market Value (US$ Million) Forecast by Product Type, 2018 to 2023

Table 16: Latin America Market Volume (Sq.Mtr) Forecast by Product Type, 2018 to 2023

Table 17: Latin America Market Value (US$ Million) Forecast by Application, 2018 to 2023

Table 18: Latin America Market Volume (Sq.Mtr) Forecast by Application, 2018 to 2023

Table 19: Western Europe Market Value (US$ Million) Forecast by Country, 2018 to 2023

Table 20: Western Europe Market Volume (Sq.Mtr) Forecast by Country, 2018 to 2023

Table 21: Western Europe Market Value (US$ Million) Forecast by Product Type, 2018 to 2023

Table 22: Western Europe Market Volume (Sq.Mtr) Forecast by Product Type, 2018 to 2023

Table 23: Western Europe Market Value (US$ Million) Forecast by Application, 2018 to 2023

Table 24: Western Europe Market Volume (Sq.Mtr) Forecast by Application, 2018 to 2023

Table 25: Eastern Europe Market Value (US$ Million) Forecast by Country, 2018 to 2023

Table 26: Eastern Europe Market Volume (Sq.Mtr) Forecast by Country, 2018 to 2023

Table 27: Eastern Europe Market Value (US$ Million) Forecast by Product Type, 2018 to 2023

Table 28: Eastern Europe Market Volume (Sq.Mtr) Forecast by Product Type, 2018 to 2023

Table 29: Eastern Europe Market Value (US$ Million) Forecast by Application, 2018 to 2023

Table 30: Eastern Europe Market Volume (Sq.Mtr) Forecast by Application, 2018 to 2023

Table 31: South Asia and Pacific Market Value (US$ Million) Forecast by Country, 2018 to 2023

Table 32: South Asia and Pacific Market Volume (Sq.Mtr) Forecast by Country, 2018 to 2023

Table 33: South Asia and Pacific Market Value (US$ Million) Forecast by Product Type, 2018 to 2023

Table 34: South Asia and Pacific Market Volume (Sq.Mtr) Forecast by Product Type, 2018 to 2023

Table 35: South Asia and Pacific Market Value (US$ Million) Forecast by Application, 2018 to 2023

Table 36: South Asia and Pacific Market Volume (Sq.Mtr) Forecast by Application, 2018 to 2023

Table 37: East Asia Market Value (US$ Million) Forecast by Country, 2018 to 2023

Table 38: East Asia Market Volume (Sq.Mtr) Forecast by Country, 2018 to 2023

Table 39: East Asia Market Value (US$ Million) Forecast by Product Type, 2018 to 2023

Table 40: East Asia Market Volume (Sq.Mtr) Forecast by Product Type, 2018 to 2023

Table 41: East Asia Market Value (US$ Million) Forecast by Application, 2018 to 2023

Table 42: East Asia Market Volume (Sq.Mtr) Forecast by Application, 2018 to 2023

Table 43: Middle East and Africa Market Value (US$ Million) Forecast by Country, 2018 to 2023

Table 44: Middle East and Africa Market Volume (Sq.Mtr) Forecast by Country, 2018 to 2023

Table 45: Middle East and Africa Market Value (US$ Million) Forecast by Product Type, 2018 to 2023

Table 46: Middle East and Africa Market Volume (Sq.Mtr) Forecast by Product Type, 2018 to 2023

Table 47: Middle East and Africa Market Value (US$ Million) Forecast by Application, 2018 to 2023

Table 48: Middle East and Africa Market Volume (Sq.Mtr) Forecast by Application, 2018 to 2023

List of Figures

Figure 1: Global Market Value (US$ Million) by Product Type, 2023 to 2033

Figure 2: Global Market Value (US$ Million) by Application, 2023 to 2033

Figure 3: Global Market Value (US$ Million) by Region, 2023 to 2033

Figure 4: Global Market Value (US$ Million) Analysis by Region, 2018 to 2023

Figure 5: Global Market Volume (Sq.Mtr) Analysis by Region, 2018 to 2023

Figure 6: Global Market Value Share (%) and BPS Analysis by Region, 2023 to 2033

Figure 7: Global Market Y-o-Y Growth (%) Projections by Region, 2023 to 2033

Figure 8: Global Market Value (US$ Million) Analysis by Product Type, 2018 to 2023

Figure 9: Global Market Volume (Sq.Mtr) Analysis by Product Type, 2018 to 2023

Figure 10: Global Market Value Share (%) and BPS Analysis by Product Type, 2023 to 2033

Figure 11: Global Market Y-o-Y Growth (%) Projections by Product Type, 2023 to 2033

Figure 12: Global Market Value (US$ Million) Analysis by Application, 2018 to 2023

Figure 13: Global Market Volume (Sq.Mtr) Analysis by Application, 2018 to 2023

Figure 14: Global Market Value Share (%) and BPS Analysis by Application, 2023 to 2033

Figure 15: Global Market Y-o-Y Growth (%) Projections by Application, 2023 to 2033

Figure 16: Global Market Attractiveness by Product Type, 2023 to 2033

Figure 17: Global Market Attractiveness by Application, 2023 to 2033

Figure 18: Global Market Attractiveness by Region, 2023 to 2033

Figure 19: North America Market Value (US$ Million) by Product Type, 2023 to 2033

Figure 20: North America Market Value (US$ Million) by Application, 2023 to 2033

Figure 21: North America Market Value (US$ Million) by Country, 2023 to 2033

Figure 22: North America Market Value (US$ Million) Analysis by Country, 2018 to 2023

Figure 23: North America Market Volume (Sq.Mtr) Analysis by Country, 2018 to 2023

Figure 24: North America Market Value Share (%) and BPS Analysis by Country, 2023 to 2033

Figure 25: North America Market Y-o-Y Growth (%) Projections by Country, 2023 to 2033

Figure 26: North America Market Value (US$ Million) Analysis by Product Type, 2018 to 2023

Figure 27: North America Market Volume (Sq.Mtr) Analysis by Product Type, 2018 to 2023

Figure 28: North America Market Value Share (%) and BPS Analysis by Product Type, 2023 to 2033

Figure 29: North America Market Y-o-Y Growth (%) Projections by Product Type, 2023 to 2033

Figure 30: North America Market Value (US$ Million) Analysis by Application, 2018 to 2023

Figure 31: North America Market Volume (Sq.Mtr) Analysis by Application, 2018 to 2023

Figure 32: North America Market Value Share (%) and BPS Analysis by Application, 2023 to 2033

Figure 33: North America Market Y-o-Y Growth (%) Projections by Application, 2023 to 2033

Figure 34: North America Market Attractiveness by Product Type, 2023 to 2033

Figure 35: North America Market Attractiveness by Application, 2023 to 2033

Figure 36: North America Market Attractiveness by Country, 2023 to 2033

Figure 37: Latin America Market Value (US$ Million) by Product Type, 2023 to 2033

Figure 38: Latin America Market Value (US$ Million) by Application, 2023 to 2033

Figure 39: Latin America Market Value (US$ Million) by Country, 2023 to 2033

Figure 40: Latin America Market Value (US$ Million) Analysis by Country, 2018 to 2023

Figure 41: Latin America Market Volume (Sq.Mtr) Analysis by Country, 2018 to 2023

Figure 42: Latin America Market Value Share (%) and BPS Analysis by Country, 2023 to 2033

Figure 43: Latin America Market Y-o-Y Growth (%) Projections by Country, 2023 to 2033

Figure 44: Latin America Market Value (US$ Million) Analysis by Product Type, 2018 to 2023

Figure 45: Latin America Market Volume (Sq.Mtr) Analysis by Product Type, 2018 to 2023

Figure 46: Latin America Market Value Share (%) and BPS Analysis by Product Type, 2023 to 2033

Figure 47: Latin America Market Y-o-Y Growth (%) Projections by Product Type, 2023 to 2033

Figure 48: Latin America Market Value (US$ Million) Analysis by Application, 2018 to 2023

Figure 49: Latin America Market Volume (Sq.Mtr) Analysis by Application, 2018 to 2023

Figure 50: Latin America Market Value Share (%) and BPS Analysis by Application, 2023 to 2033

Figure 51: Latin America Market Y-o-Y Growth (%) Projections by Application, 2023 to 2033

Figure 52: Latin America Market Attractiveness by Product Type, 2023 to 2033

Figure 53: Latin America Market Attractiveness by Application, 2023 to 2033

Figure 54: Latin America Market Attractiveness by Country, 2023 to 2033

Figure 55: Western Europe Market Value (US$ Million) by Product Type, 2023 to 2033

Figure 56: Western Europe Market Value (US$ Million) by Application, 2023 to 2033

Figure 57: Western Europe Market Value (US$ Million) by Country, 2023 to 2033

Figure 58: Western Europe Market Value (US$ Million) Analysis by Country, 2018 to 2023

Figure 59: Western Europe Market Volume (Sq.Mtr) Analysis by Country, 2018 to 2023

Figure 60: Western Europe Market Value Share (%) and BPS Analysis by Country, 2023 to 2033

Figure 61: Western Europe Market Y-o-Y Growth (%) Projections by Country, 2023 to 2033

Figure 62: Western Europe Market Value (US$ Million) Analysis by Product Type, 2018 to 2023

Figure 63: Western Europe Market Volume (Sq.Mtr) Analysis by Product Type, 2018 to 2023

Figure 64: Western Europe Market Value Share (%) and BPS Analysis by Product Type, 2023 to 2033

Figure 65: Western Europe Market Y-o-Y Growth (%) Projections by Product Type, 2023 to 2033

Figure 66: Western Europe Market Value (US$ Million) Analysis by Application, 2018 to 2023

Figure 67: Western Europe Market Volume (Sq.Mtr) Analysis by Application, 2018 to 2023

Figure 68: Western Europe Market Value Share (%) and BPS Analysis by Application, 2023 to 2033

Figure 69: Western Europe Market Y-o-Y Growth (%) Projections by Application, 2023 to 2033

Figure 70: Western Europe Market Attractiveness by Product Type, 2023 to 2033

Figure 71: Western Europe Market Attractiveness by Application, 2023 to 2033

Figure 72: Western Europe Market Attractiveness by Country, 2023 to 2033

Figure 73: Eastern Europe Market Value (US$ Million) by Product Type, 2023 to 2033

Figure 74: Eastern Europe Market Value (US$ Million) by Application, 2023 to 2033

Figure 75: Eastern Europe Market Value (US$ Million) by Country, 2023 to 2033

Figure 76: Eastern Europe Market Value (US$ Million) Analysis by Country, 2018 to 2023

Figure 77: Eastern Europe Market Volume (Sq.Mtr) Analysis by Country, 2018 to 2023

Figure 78: Eastern Europe Market Value Share (%) and BPS Analysis by Country, 2023 to 2033

Figure 79: Eastern Europe Market Y-o-Y Growth (%) Projections by Country, 2023 to 2033

Figure 80: Eastern Europe Market Value (US$ Million) Analysis by Product Type, 2018 to 2023

Figure 81: Eastern Europe Market Volume (Sq.Mtr) Analysis by Product Type, 2018 to 2023

Figure 82: Eastern Europe Market Value Share (%) and BPS Analysis by Product Type, 2023 to 2033

Figure 83: Eastern Europe Market Y-o-Y Growth (%) Projections by Product Type, 2023 to 2033

Figure 84: Eastern Europe Market Value (US$ Million) Analysis by Application, 2018 to 2023

Figure 85: Eastern Europe Market Volume (Sq.Mtr) Analysis by Application, 2018 to 2023

Figure 86: Eastern Europe Market Value Share (%) and BPS Analysis by Application, 2023 to 2033

Figure 87: Eastern Europe Market Y-o-Y Growth (%) Projections by Application, 2023 to 2033

Figure 88: Eastern Europe Market Attractiveness by Product Type, 2023 to 2033

Figure 89: Eastern Europe Market Attractiveness by Application, 2023 to 2033

Figure 90: Eastern Europe Market Attractiveness by Country, 2023 to 2033

Figure 91: South Asia and Pacific Market Value (US$ Million) by Product Type, 2023 to 2033

Figure 92: South Asia and Pacific Market Value (US$ Million) by Application, 2023 to 2033

Figure 93: South Asia and Pacific Market Value (US$ Million) by Country, 2023 to 2033

Figure 94: South Asia and Pacific Market Value (US$ Million) Analysis by Country, 2018 to 2023

Figure 95: South Asia and Pacific Market Volume (Sq.Mtr) Analysis by Country, 2018 to 2023

Figure 96: South Asia and Pacific Market Value Share (%) and BPS Analysis by Country, 2023 to 2033

Figure 97: South Asia and Pacific Market Y-o-Y Growth (%) Projections by Country, 2023 to 2033

Figure 98: South Asia and Pacific Market Value (US$ Million) Analysis by Product Type, 2018 to 2023

Figure 99: South Asia and Pacific Market Volume (Sq.Mtr) Analysis by Product Type, 2018 to 2023

Figure 100: South Asia and Pacific Market Value Share (%) and BPS Analysis by Product Type, 2023 to 2033

Figure 101: South Asia and Pacific Market Y-o-Y Growth (%) Projections by Product Type, 2023 to 2033

Figure 102: South Asia and Pacific Market Value (US$ Million) Analysis by Application, 2018 to 2023

Figure 103: South Asia and Pacific Market Volume (Sq.Mtr) Analysis by Application, 2018 to 2023

Figure 104: South Asia and Pacific Market Value Share (%) and BPS Analysis by Application, 2023 to 2033

Figure 105: South Asia and Pacific Market Y-o-Y Growth (%) Projections by Application, 2023 to 2033

Figure 106: South Asia and Pacific Market Attractiveness by Product Type, 2023 to 2033

Figure 107: South Asia and Pacific Market Attractiveness by Application, 2023 to 2033

Figure 108: South Asia and Pacific Market Attractiveness by Country, 2023 to 2033

Figure 109: East Asia Market Value (US$ Million) by Product Type, 2023 to 2033

Figure 110: East Asia Market Value (US$ Million) by Application, 2023 to 2033

Figure 111: East Asia Market Value (US$ Million) by Country, 2023 to 2033

Figure 112: East Asia Market Value (US$ Million) Analysis by Country, 2018 to 2023

Figure 113: East Asia Market Volume (Sq.Mtr) Analysis by Country, 2018 to 2023

Figure 114: East Asia Market Value Share (%) and BPS Analysis by Country, 2023 to 2033

Figure 115: East Asia Market Y-o-Y Growth (%) Projections by Country, 2023 to 2033

Figure 116: East Asia Market Value (US$ Million) Analysis by Product Type, 2018 to 2023

Figure 117: East Asia Market Volume (Sq.Mtr) Analysis by Product Type, 2018 to 2023

Figure 118: East Asia Market Value Share (%) and BPS Analysis by Product Type, 2023 to 2033

Figure 119: East Asia Market Y-o-Y Growth (%) Projections by Product Type, 2023 to 2033

Figure 120: East Asia Market Value (US$ Million) Analysis by Application, 2018 to 2023

Figure 121: East Asia Market Volume (Sq.Mtr) Analysis by Application, 2018 to 2023

Figure 122: East Asia Market Value Share (%) and BPS Analysis by Application, 2023 to 2033

Figure 123: East Asia Market Y-o-Y Growth (%) Projections by Application, 2023 to 2033

Figure 124: East Asia Market Attractiveness by Product Type, 2023 to 2033

Figure 125: East Asia Market Attractiveness by Application, 2023 to 2033

Figure 126: East Asia Market Attractiveness by Country, 2023 to 2033

Figure 127: Middle East and Africa Market Value (US$ Million) by Product Type, 2023 to 2033

Figure 128: Middle East and Africa Market Value (US$ Million) by Application, 2023 to 2033

Figure 129: Middle East and Africa Market Value (US$ Million) by Country, 2023 to 2033

Figure 130: Middle East and Africa Market Value (US$ Million) Analysis by Country, 2018 to 2023

Figure 131: Middle East and Africa Market Volume (Sq.Mtr) Analysis by Country, 2018 to 2023

Figure 132: Middle East and Africa Market Value Share (%) and BPS Analysis by Country, 2023 to 2033

Figure 133: Middle East and Africa Market Y-o-Y Growth (%) Projections by Country, 2023 to 2033

Figure 134: Middle East and Africa Market Value (US$ Million) Analysis by Product Type, 2018 to 2023

Figure 135: Middle East and Africa Market Volume (Sq.Mtr) Analysis by Product Type, 2018 to 2023

Figure 136: Middle East and Africa Market Value Share (%) and BPS Analysis by Product Type, 2023 to 2033

Figure 137: Middle East and Africa Market Y-o-Y Growth (%) Projections by Product Type, 2023 to 2033

Figure 138: Middle East and Africa Market Value (US$ Million) Analysis by Application, 2018 to 2023

Figure 139: Middle East and Africa Market Volume (Sq.Mtr) Analysis by Application, 2018 to 2023

Figure 140: Middle East and Africa Market Value Share (%) and BPS Analysis by Application, 2023 to 2033

Figure 141: Middle East and Africa Market Y-o-Y Growth (%) Projections by Application, 2023 to 2033

Figure 142: Middle East and Africa Market Attractiveness by Product Type, 2023 to 2033

Figure 143: Middle East and Africa Market Attractiveness by Application, 2023 to 2033

Figure 144: Middle East and Africa Market Attractiveness by Country, 2023 to 2033

Frequently Asked Questions

How Big is the Unsupported Single Coated Tape Market?

The unsupported single coated tape market is worth USD 7.1 billion in 2023.

What is the Growth Potential of the Unsupported Single Coated Tape Market?

The market is expected to expand at a CAGR of 3.5% through 2033.

What is the Revenue Potential of the Unsupported Single Coated Tape Market?

The market is anticipated to account for USD 10.9 billion by 2033.

Which Country Offers High Growth Prospects for Unsupported Single Coated Tape?

India is predicted to provide high growth opportunities to market players.

Which Product Type is in High Demand?

Ordinary tape finds high preferability among application sectors.

Explore Similar Insights

Future Market Insights

Unsupported Single Coated Tape Market