Single Wall Jars Market Size and Share Forecast Outlook 2025 to 2035

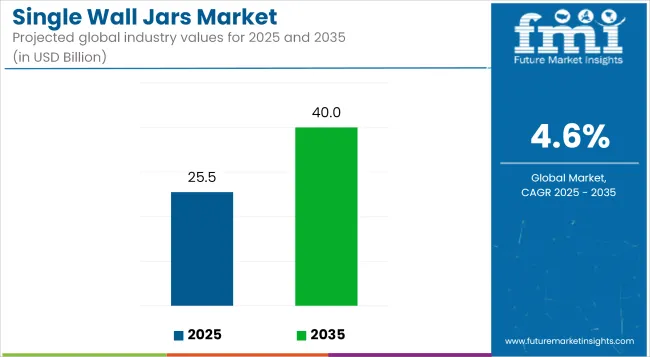
The single wall jars market is projected to grow from USD 25.5 billion in 2025 to USD 40.0 billion by 2035, registering a CAGR of 4.6% during the forecast period. Sales in 2024 reached USD 24.3 billion, driven by demand from the cosmetics, personal care, and nutraceutical industries.
Quick Stats of Single Wall Jars Market

  • Market Value (2025): USD 25.5 billion
  • Forecast Value (2035): USD 40.0 billion
  • Forecast CAGR: 4.6%
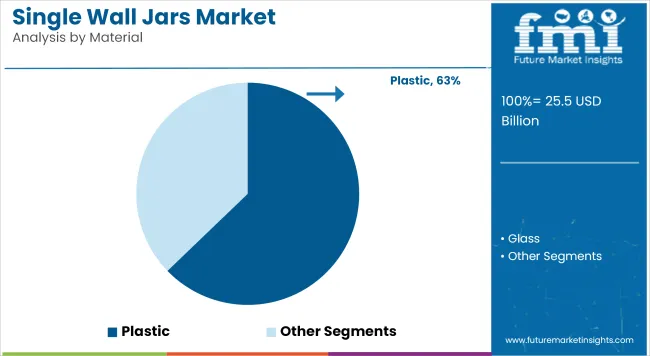
  • Material Leader in 2025: Plastic (62.8% market share)
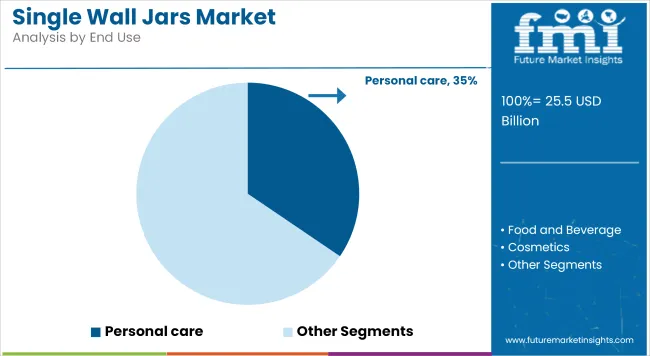
  • Top End Use: Personal care (34.5% share)
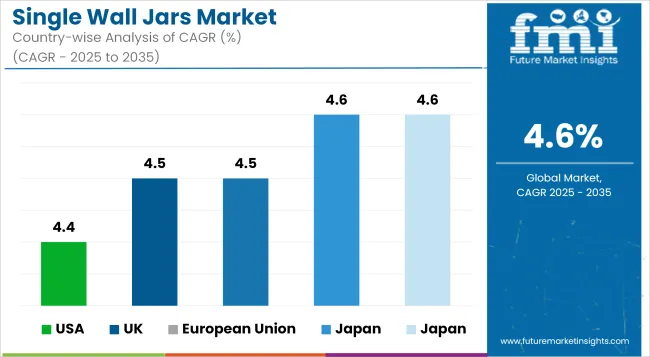
  • Key Growth Country: South Kores (South Korea is the fastest-growing market with 4.6% CAGR)

Single Wall Jars Market Industry Value Analysis

Metric Value
Industry Size (2025E) USD 25.5 billion
Industry Value (2035F) USD 40.0 billion
CAGR (2025 to 2035) 4.6%

Growth has been attributed to cost-effective production, increased shelf appeal, and rising adoption by direct-to-consumer skincare brands. The lightweight profile and reduced resin use of single wall jars have contributed to sustainability goals while maintaining visual aesthetics and functionality.

Packaging preferences across wellness and beauty sectors have favored jars that offer design flexibility and branding compatibility. Expansion in e-commerce distribution has also influenced demand for compact and protective packaging types.

Product development has been influenced by the growing prioritization of circular design and mono-material use in rigid containers. Key suppliers have advanced extrusion blow molding capabilities to produce PET and PP jars with seamless walls and minimized resin inputs.

Emerging R&D initiatives have emphasized reduced environmental impact through renewable materials and refillable formats. Integration of laser-etched labeling and direct printing has also gained traction for brand customization while limiting label waste.

Packaging assessments have focused on improving end-of-life recovery processes without compromising protective performance. Lifecycle audits are being conducted to verify carbon reductions and identify areas for further optimization. Consumer brands have begun to shift procurement policies toward verified sustainable containers, reinforcing the move toward lighter, recyclable single wall jar options.

The outlook for the single wall jars market remains optimistic, with global brands accelerating transitions toward recyclable primary packaging solutions. Market players are expected to focus on material standardization, product differentiation, and reduced logistics footprints.

Growth opportunities will be driven by the rise of indie brands, D2C models, and travel-compliant formats. The market is likely to benefit from regional regulatory shifts favoring minimal packaging and clear sustainability labeling.

Competitive positioning will depend on technological partnerships, fast prototyping abilities, and compliance with extended producer responsibility guidelines. Future expansion into medical-grade and nutraceutical packaging segments is anticipated, broadening the applications of single wall jars. Key players are also integrating automation and digital inspection systems to ensure efficiency and high throughput across operations.

Analyzing Single Wall Jars Market by Top Investment Segment

The market is segmented based on material, capacity, end use, distribution channel, and region. By material, the market includes metal, glass, and plastic. In terms of capacity, the market is categorized into less than 10 oz, 11-30 oz, 31-100 oz, and above 100 oz.

By end use, the market comprises personal care, food and beverage, cosmetics, pharmaceutical, and others including chemicals. Based on distribution channel, the market is segmented into B2B (direct sales and distributors) and B2C (online retail and offline retail). Regionally, the market is analyzed across North America, Latin America, East Asia, South Asia & Pacific, Eastern Europe, Western Europe, Oceania, and the Middle East & Africa.

Plastic Preferred for Lightweight Strength and Cost Efficiency

Plastic has been estimated to hold the largest share of the single wall jars market in 2025 at 62.8%, driven by its cost efficiency, mold ability, and resistance to breakage. Polypropylene (PP), PET, and HDPE have been used extensively due to their chemical resistance and clarity.

Lightweight construction has reduced transportation costs and made plastic jars ideal for e-commerce and retail packaging. Plastic jars have also been preferred for their compatibility with tamper-evident and child-resistant closures.

High customization potential has been enabled through blow molding and injection molding techniques. Transparent plastic jars have facilitated product visibility in cosmetics and food packaging. UV-resistant and airtight variants have been used for light- or air-sensitive products such as supplements and creams. Printability and label adhesion have enhanced their utility in branded applications.

Plastic jars have supported fast production cycles, contributing to rapid supply chain turnaround. Shatterproof characteristics have made them safer alternatives to glass in personal care and pharmaceuticals.

Barrier coatings and multilayer structures have been integrated to improve performance against moisture and oxygen ingress. Recycling-friendly mono-material designs have increasingly been adopted to meet sustainability targets. Demand for BPA-free and FDA-compliant plastics has been addressed through regulatory-compliant formulations.

Recycled plastic (rPET, rHDPE) usage has increased to align with circular economy standards. Global brands have invested in recycled-content plastic jar lines to meet ESG commitments. Plastic’s strength-to-weight ratio and shelf-ready design flexibility are expected to secure its leading position.
Single Wall Jars Market Analysis By Material

Personal Care Industry Drives Demand for Aesthetic and Functional Packaging

The personal care sector has been projected to account for 34.5% of the global demand for single wall jars in 2025, due to its need for hygienic, appealing, and portable packaging. Jars have been used to package creams, balms, scrubs, gels, and lotions requiring wide-mouth formats for easy application. Material selection has focused on sensory appeal, durability, and leak resistance.

Plastic and glass variants have both found preference across premium and mass-market product lines. Customization for brand identity has been prioritized through embossing, matte finishes, and specialty closures. Compact and travel-friendly jars have supported on-the-go product usage and sampler kits. Transparent and tinted jars have allowed consumers to visually assess product texture and quantity. Tamper-proof and resalable designs have enhanced product security and longevity.

Refillable and reusable jar options have gained popularity in clean beauty and sustainability-conscious consumers. Demand has also grown for mono-material jars that facilitate curbside recycling. Brands have leveraged personal care jars for value-added packaging through integrated applicators or dual-compartment formats.

Lightweight plastic jars have improved shipping efficiency for online personal care sales. Growth in skin care routines and product layering trends has expanded the range of jar-packed SKUs. Specialty product lines targeting niche concerns like anti-aging, hydration, and sensitive skin have further propelled demand.

Regulatory compliance with cosmetic packaging standards has remained critical for multinational product distribution. Personal care is expected to remain the core market for single wall jars with continued product diversification.
Single Wall Jars Market Analysis By End Use

Challenges and Opportunities

Challenge

Limited Barrier Protection and Structural Fragility

The single wall jars market can be hindered by their inferior barrier properties and poor structural strength for applications requiring long shelf life or product protection. Unlike double-wall or multilayer jars, single wall jars provide limited insulation and are not expected to protect against exposure to moisture, UV light, or oxygen making them unsuitable for high-end skin care, pharmaceuticals, or perishable goods. '

Furthermore, such jars that are commonly produced from light-weight plastic or glass might not also be impact resistant and may break, warp, or deform during transport or while stacked. This limits their application in heavy duty packaging environments and lowers brand preference on premium positioning.

Opportunity

Demand for Lightweight, Cost-Effective, and Customizable Packaging

Single wall jars can offer an excellent opportunity in markets that are driven by cost-efficient storage, functional aesthetics, and earthy packaging formed from eco-friendly materials. These types of packaging are used for cosmetics, personal care, food storage, supplements and do-it-yourself products where product visibility and light weight packaging are major selling points.

Minimalist packaging, small-batch production and e-commerce brands are bolstering the popularity of these clear, stackable, label-friendly single wall jars. New recyclable plastics, UV-resistant additives, and post-consumer resins (PCR) give some plastics an added environmentally friendly appeal. Also, many manufacturers are now offering custom mold designs, colour variations, and matte finishes to allow brands to achieve unique aesthetics without additional complexity or cost.
Country-Wise Outlook

Single Wall Jars Market Cagr Analysis By Country

United States

Growing demand from personal care, food, and wellness industries in the United States single wall jars market is fuelling this growth. Perfect as packaging for creams, lotions, balms, powders, and condiments, these jars are a cost-effective and versatile packaging solution for big and small brands alike.

The growth of shelf small-batch beauty brands and natural skincare products represents an area of demand for PET and polypropylene single wall jars, particularly those customized for custom labelling, tamper-evident seals, and sustainability packaging initiatives. Recyclability, visibility and to drive further adoption across e-commerce and retail shelves in the USA.

Country CAGR (2025 to 2035)
USA 4.4%

United Kingdom

The UK singles wall jars market is growing at a stable rate due to the increasing trends of artisanal cosmetics, green food packaging, and do-it-yourself product manufacturing. Simple, recyclable jar formats that provide flexibility for branding and minimalistic aesthetics are in favour with consumers and businesses.

The UK is taking a harder stance on plastic waste and encouraging refillable beauty packaging, leading brands to choose mono-material jars from clear or frosted plastics. Producers of skincare, haircare, and organic food products find themselves favouring cost-efficient, ultra-lightweight single wall containers with easy-to-use closures.

Country CAGR (2025 to 2035)
UK 4.5%

European Union

The European Union single wall jars market is experiencing steady growth, primarily due to stringent sustainable packaging regulations, growing applications spanning the nutraceutical and personal care industries, and a growing preference for minimalist packaging formats. Countries at the forefront of adopting single wall jars for creams, scrubs, dietary supplements, and condiments include Germany, France, and Spain.

At least a third of EU consumers want recyclable containers, free from BPA and harmful chemicals, as well as capable of being used in bulk and refill programs, as part of the bloc’s circular economy ambitions. To address the environmental concerns and compliance, manufacturers are also launching UV- resistant, biodegradable, and post-consumer recycled (PCR) jars.

Country CAGR (2025 to 2035)
European Union 4.5%

Japan

The Japan single wall jars market is moderately expanding due to the emphasis on packaging accuracy, optimizing storage solutions, and exciting consumer interests in design and functionality. You are equipped to cater to single wall jars that find applications in cosmetic samplers, health supplements, herbal creams, and specialty condiments where portability and aesthetic appeal is of paramount importance.

The Japanese manufacturers are exploring thin, transparent jars with excellent sealing property in small packaging formats. All these factors are conducive to the acceptance of polymer-based single wall jars in Japan as well, particularly the urban retail and personal care sectors emerging demand for refillable and recyclable containers.

Country CAGR (2025 to 2035)
Japan 4.6%

South Korea

The South Korea single wall jars market is projected to grow at a steady rate, propelled by increasing K-beauty product exports, rising health and wellness packaging, and a shift toward minimalist, sustainable packaging designs. Skincare and cosmetic manufacturers prefer lightweight, stackable jars that improve shelf appeal with less material.

The local market trend is towards combination packs including kindred products, leading to greater use of mono layer jars out of recyclable plastic, and clear packaging solutions. These jars are also extensively used for herbal formulations, ointments, gels, and small-scale food things, and this emphasizes their versatility across the sectors.

Country CAGR (2025 to 2035)
South Korea 4.6%

Competitive Outlook

Single wall jars are a large segment in the global packaging market driven by low-cost, durable, lightweight, and long-lasting containers used in personal care, cosmetics, pharmaceuticals, food packaging, etc which drives functionally led single wall jars market. Plastic screw jars are used for creams, powders, gels and dry foods, made mainly from PET, HDPE, PP and glass and offer reliable containment with easy screw or snap on lids.

Key players are working on sustainable resins, customizable formats, tamper-evident designs, and compatibility with automated filling lines. The market encompasses packaging specialists, plastic melding companies, and original container manufacturers, and supplies both original equipment manufacturers (OEMs) and private-label brands.

Other Key Players

  • APG Europe
  • MJS Packaging
  • CL Smith Company
  • Alpha Packaging
  • Comar, LLC
  • Qosmedix
  • Plastipak Holdings, Inc.

Key Segmentation

By Material:

  • Metal
  • Glass
  • Plastic

By Capacity:

  • Less than 10 oz
  • 11 - 30 oz
  • 31 - 100 oz
  • Above 100 oz

By End Use:

  • Personal Care
  • Food and Beverage
  • Cosmetics
  • Pharmaceutical
  • Others (Chemicals)

By Region:

  • North America
  • Latin America
  • Western Europe
  • Eastern Europe
  • East Asia
  • South Asia Pacific
  • Middle East and Africa

Table of Content

  1. Executive Summary
    • Global Market Outlook
    • Demand-side Trends
    • Supply-side Trends
    • Technology Roadmap Analysis
    • Analysis and Recommendations
  2. Market Overview
    • Market Coverage / Taxonomy
    • Market Definition / Scope / Limitations
  3. Market Background
    • Market Dynamics
      • Drivers
      • Restraints
      • Opportunity
      • Trends
    • Scenario Forecast
      • Demand in Optimistic Scenario
      • Demand in Likely Scenario
      • Demand in Conservative Scenario
    • Opportunity Map Analysis
    • Product Life Cycle Analysis
    • Supply Chain Analysis
      • Supply Side Participants and their Roles
        • Producers
        • Mid-Level Participants (Traders/ Agents/ Brokers)
        • Wholesalers and Distributors
      • Value Added and Value Created at Node in the Supply Chain
      • List of Raw Material Suppliers
      • List of Existing and Potential Buyer’s
    • Investment Feasibility Matrix
    • Value Chain Analysis
      • Profit Margin Analysis
      • Wholesalers and Distributors
      • Retailers
    • PESTLE and Porter’s Analysis
    • Regulatory Landscape
      • By Key Regions
      • By Key Countries
    • Regional Parent Market Outlook
    • Production and Consumption Statistics
    • Import and Export Statistics
  4. Global Market Analysis 2020-2024 and Forecast, 2025-2035
    • Historical Market Size Value (USD Million) & Volume (Units) Analysis, 2020-2024
    • Current and Future Market Size Value (USD Million) & Volume (Units) Projections, 2025-2035
      • Y-o-Y Growth Trend Analysis
      • Absolute $ Opportunity Analysis
  5. Global Market Analysis 2020-2024 and Forecast 2025-2035, By Material
    • Introduction / Key Findings
    • Historical Market Size Value (USD Million) & Volume (Units) Analysis By Material, 2020-2024
    • Current and Future Market Size Value (USD Million) & Volume (Units) Analysis and Forecast By Material, 2025-2035
      • Metal
      • Glass
      • Plastic
    • Y-o-Y Growth Trend Analysis By Material, 2020-2024
    • Absolute $ Opportunity Analysis By Material, 2025-2035
  6. Global Market Analysis 2020-2024 and Forecast 2025-2035, By Capacity
    • Introduction / Key Findings
    • Historical Market Size Value (USD Million) & Volume (Units) Analysis By Capacity, 2020-2024
    • Current and Future Market Size Value (USD Million) & Volume (Units) Analysis and Forecast By Capacity, 2025-2035
      • Less than 10 oz
      • 11 - 30 oz
      • 31 - 100 oz
      • Above 100 oz
    • Y-o-Y Growth Trend Analysis By Capacity, 2020-2024
    • Absolute $ Opportunity Analysis By Capacity, 2025-2035
  7. Global Market Analysis 2020-2024 and Forecast 2025-2035, By End Use
    • Introduction / Key Findings
    • Historical Market Size Value (USD Million) & Volume (Units) Analysis By End Use, 2020-2024
    • Current and Future Market Size Value (USD Million) & Volume (Units) Analysis and Forecast By End Use, 2025-2035
      • Personal Care
      • Food and Beverage
      • Cosmetics
      • Pharmaceutical
      • Others
    • Y-o-Y Growth Trend Analysis By End Use, 2020-2024
    • Absolute $ Opportunity Analysis By End Use, 2025-2035
  8. Global Market Analysis 2020-2024 and Forecast 2025-2035, By Distribution Channel
    • Introduction / Key Findings
    • Historical Market Size Value (USD Million) & Volume (Units) Analysis By Distribution Channel, 2020-2024
    • Current and Future Market Size Value (USD Million) & Volume (Units) Analysis and Forecast By Distribution Channel, 2025-2035
      • B2B (Direct Sales, Distributors)
      • B2C (Online Retail, Offline Retail)
    • Y-o-Y Growth Trend Analysis By Distribution Channel, 2020-2024
    • Absolute $ Opportunity Analysis By Distribution Channel, 2025-2035
  9. Global Market Analysis 2020-2024 and Forecast 2025-2035, By Region
    • Introduction
    • Historical Market Size Value (USD Million) & Volume (Units) Analysis By Region, 2020-2024
    • Current Market Size Value (USD Million) & Volume (Units) Analysis and Forecast By Region, 2025-2035
      • North America
      • Latin America
      • Europe
      • East Asia
      • South Asia
      • Oceania
      • MEA
    • Market Attractiveness Analysis By Region
  10. North America Market Analysis 2020-2024 and Forecast 2025-2035, By Country
    • Historical Market Size Value (USD Million) & Volume (Units) Trend Analysis By Market Taxonomy, 2020-2024
    • Market Size Value (USD Million) & Volume (Units) Forecast By Market Taxonomy, 2025-2035
      • By Country
        • USA
        • Canada
      • By Material
      • By Capacity
      • By End Use
      • By Distribution Channel
    • Market Attractiveness Analysis
      • By Country
      • By Material
      • By Capacity
      • By End Use
      • By Distribution Channel
    • Key Takeaways
  11. Latin America Market Analysis 2020-2024 and Forecast 2025-2035, By Country
    • Historical Market Size Value (USD Million) & Volume (Units) Trend Analysis By Market Taxonomy, 2020-2024
    • Market Size Value (USD Million) & Volume (Units) Forecast By Market Taxonomy, 2025-2035
      • By Country
        • Brazil
        • Mexico
        • Argentina
        • Chile
        • Peru
        • Rest of Latin America
      • By Material
      • By Capacity
      • By End Use
      • By Distribution Channel
    • Market Attractiveness Analysis
      • By Country
      • By Material
      • By Capacity
      • By End Use
      • By Distribution Channel
    • Key Takeaways
  12. Europe Market Analysis 2020-2024 and Forecast 2025-2035, By Country
    • Historical Market Size Value (USD Million) & Volume (Units) Trend Analysis By Market Taxonomy, 2020-2024
    • Market Size Value (USD Million) & Volume (Units) Forecast By Market Taxonomy, 2025-2035
      • By Country
        • Germany
        • Italy
        • France
        • UK
        • Spain
        • Russia
        • BENELUX
        • Rest of Europe
      • By Material
      • By Capacity
      • By End Use
      • By Distribution Channel
    • Market Attractiveness Analysis
      • By Country
      • By Material
      • By Capacity
      • By End Use
      • By Distribution Channel
    • Key Takeaways
  13. East Asia Market Analysis 2020-2024 and Forecast 2025-2035, By Country
    • Historical Market Size Value (USD Million) & Volume (Units) Trend Analysis By Market Taxonomy, 2020-2024
    • Market Size Value (USD Million) & Volume (Units) Forecast By Market Taxonomy, 2025-2035
      • By Country
        • China
        • Japan
        • South Korea
      • By Material
      • By Capacity
      • By End Use
      • By Distribution Channel
    • Market Attractiveness Analysis
      • By Country
      • By Material
      • By Capacity
      • By End Use
      • By Distribution Channel
    • Key Takeaways
  14. South Asia Market Analysis 2020-2024 and Forecast 2025-2035, By Country
    • Historical Market Size Value (USD Million) & Volume (Units) Trend Analysis By Market Taxonomy, 2020-2024
    • Market Size Value (USD Million) & Volume (Units) Forecast By Market Taxonomy, 2025-2035
      • By Country
        • India
        • Thailand
        • Malaysia
        • Indonesia
        • Rest of South Asia
      • By Material
      • By Capacity
      • By End Use
      • By Distribution Channel
    • Market Attractiveness Analysis
      • By Country
      • By Material
      • By Capacity
      • By End Use
      • By Distribution Channel
    • Key Takeaways
  15. Oceania Market Analysis 2020-2024 and Forecast 2025-2035, By Country
    • Historical Market Size Value (USD Million) & Volume (Units) Trend Analysis By Market Taxonomy, 2020-2024
    • Market Size Value (USD Million) & Volume (Units) Forecast By Market Taxonomy, 2025-2035
      • By Country
        • Australia
        • New Zealand
      • By Material
      • By Capacity
      • By End Use
      • By Distribution Channel
    • Market Attractiveness Analysis
      • By Country
      • By Material
      • By Capacity
      • By End Use
      • By Distribution Channel
    • Key Takeaways
  16. MEA Market Analysis 2020-2024 and Forecast 2025-2035, By Country
    • Historical Market Size Value (USD Million) & Volume (Units) Trend Analysis By Market Taxonomy, 2020-2024
    • Market Size Value (USD Million) & Volume (Units) Forecast By Market Taxonomy, 2025-2035
      • By Country
        • GCC
        • Rest of MEA
      • By Material
      • By Capacity
      • By End Use
      • By Distribution Channel
    • Market Attractiveness Analysis
      • By Country
      • By Material
      • By Capacity
      • By End Use
      • By Distribution Channel
    • Key Takeaways
  17. Key Countries Market Analysis
    • USA
      • Pricing Analysis
      • Market Share Analysis, 2024
        • By Material
        • By Capacity
        • By End Use
        • By Distribution Channel
    • Canada
      • Pricing Analysis
      • Market Share Analysis, 2024
        • By Material
        • By Capacity
        • By End Use
        • By Distribution Channel
    • Brazil
      • Pricing Analysis
      • Market Share Analysis, 2024
        • By Material
        • By Capacity
        • By End Use
        • By Distribution Channel
    • Mexico
      • Pricing Analysis
      • Market Share Analysis, 2024
        • By Material
        • By Capacity
        • By End Use
        • By Distribution Channel
    • Argentina
      • Pricing Analysis
      • Market Share Analysis, 2024
        • By Material
        • By Capacity
        • By End Use
        • By Distribution Channel
  18. Market Structure Analysis
    • Competition Dashboard
    • Competition Benchmarking
    • Market Share Analysis of Top Players
      • By Regional
      • By Material
      • By Capacity
      • By End Use
      • By Distribution Channel
  19. Competition Analysis
    • Competition Deep Dive
      • Berry Global Inc.
        • Overview
        • Product Portfolio
        • Profitability by Market Segments (Product/Age /Sales Channel/Region)
        • Sales Footprint
        • Strategy Overview
          • Marketing Strategy
          • Product Strategy
          • Channel Strategy
      • O.Berk Company, LLC
        • Overview
        • Product Portfolio
        • Profitability by Market Segments (Product/Age /Sales Channel/Region)
        • Sales Footprint
        • Strategy Overview
          • Marketing Strategy
          • Product Strategy
          • Channel Strategy
      • Raepak Limited
        • Overview
        • Product Portfolio
        • Profitability by Market Segments (Product/Age /Sales Channel/Region)
        • Sales Footprint
        • Strategy Overview
          • Marketing Strategy
          • Product Strategy
          • Channel Strategy
      • Parkway Plastics Inc.
        • Overview
        • Product Portfolio
        • Profitability by Market Segments (Product/Age /Sales Channel/Region)
        • Sales Footprint
        • Strategy Overview
          • Marketing Strategy
          • Product Strategy
          • Channel Strategy
      • InduPlast s.p.a.
        • Overview
        • Product Portfolio
        • Profitability by Market Segments (Product/Age /Sales Channel/Region)
        • Sales Footprint
        • Strategy Overview
          • Marketing Strategy
          • Product Strategy
          • Channel Strategy
      • Ampak Group
        • Overview
        • Product Portfolio
        • Profitability by Market Segments (Product/Age /Sales Channel/Region)
        • Sales Footprint
        • Strategy Overview
          • Marketing Strategy
          • Product Strategy
          • Channel Strategy
      • Amcor Ltd
        • Overview
        • Product Portfolio
        • Profitability by Market Segments (Product/Age /Sales Channel/Region)
        • Sales Footprint
        • Strategy Overview
          • Marketing Strategy
          • Product Strategy
          • Channel Strategy
      • Alpha Packaging, Inc.
        • Overview
        • Product Portfolio
        • Profitability by Market Segments (Product/Age /Sales Channel/Region)
        • Sales Footprint
        • Strategy Overview
          • Marketing Strategy
          • Product Strategy
          • Channel Strategy
      • Olcott Plastics
        • Overview
        • Product Portfolio
        • Profitability by Market Segments (Product/Age /Sales Channel/Region)
        • Sales Footprint
        • Strategy Overview
          • Marketing Strategy
          • Product Strategy
          • Channel Strategy
      • Parkway Plastics Inc.
        • Overview
        • Product Portfolio
        • Profitability by Market Segments (Product/Age /Sales Channel/Region)
        • Sales Footprint
        • Strategy Overview
          • Marketing Strategy
          • Product Strategy
          • Channel Strategy
  20. Assumptions & Acronyms Used
  21. Research Methodology

List of Tables

  • Table 1: Global hMarket Value (USD Million) Forecast by Region, 2020-2035
  • Table 2: Global Market Volume (Units) Forecast by Region, 2020-2035
  • Table 3: Global Market Value (USD Million) Forecast by Material, 2020-2035
  • Table 4: Global Market Volume (Units) Forecast by Material, 2020-2035
  • Table 5: Global Market Value (USD Million) Forecast by Capacity, 2020-2035
  • Table 6: Global Market Volume (Units) Forecast by Capacity, 2020-2035
  • Table 7: Global Market Value (USD Million) Forecast by End Use, 2020-2035
  • Table 8: Global Market Volume (Units) Forecast by End Use, 2020-2035
  • Table 9: Global Market Value (USD Million) Forecast by Distribution Channel, 2020-2035
  • Table 10: Global Market Volume (Units) Forecast by Distribution Channel, 2020-2035
  • Table 11: North America Market Value (USD Million) Forecast by Country, 2020-2035
  • Table 12: North America Market Volume (Units) Forecast by Country, 2020-2035
  • Table 13: North America Market Value (USD Million) Forecast by Material, 2020-2035
  • Table 14: North America Market Volume (Units) Forecast by Material, 2020-2035
  • Table 15: North America Market Value (USD Million) Forecast by Capacity, 2020-2035
  • Table 16: North America Market Volume (Units) Forecast by Capacity, 2020-2035
  • Table 17: North America Market Value (USD Million) Forecast by End Use, 2020-2035
  • Table 18: North America Market Volume (Units) Forecast by End Use, 2020-2035
  • Table 19: North America Market Value (USD Million) Forecast by Distribution Channel, 2020-2035
  • Table 20: North America Market Volume (Units) Forecast by Distribution Channel, 2020-2035
  • Table 21: Latin America Market Value (USD Million) Forecast by Country, 2020-2035
  • Table 22: Latin America Market Volume (Units) Forecast by Country, 2020-2035
  • Table 23: Latin America Market Value (USD Million) Forecast by Material, 2020-2035
  • Table 24: Latin America Market Volume (Units) Forecast by Material, 2020-2035
  • Table 25: Latin America Market Value (USD Million) Forecast by Capacity, 2020-2035
  • Table 26: Latin America Market Volume (Units) Forecast by Capacity, 2020-2035
  • Table 27: Latin America Market Value (USD Million) Forecast by End Use, 2020-2035
  • Table 28: Latin America Market Volume (Units) Forecast by End Use, 2020-2035
  • Table 29: Latin America Market Value (USD Million) Forecast by Distribution Channel, 2020-2035
  • Table 30: Latin America Market Volume (Units) Forecast by Distribution Channel, 2020-2035
  • Table 31: Europe Market Value (USD Million) Forecast by Country, 2020-2035
  • Table 32: Europe Market Volume (Units) Forecast by Country, 2020-2035
  • Table 33: Europe Market Value (USD Million) Forecast by Material, 2020-2035
  • Table 34: Europe Market Volume (Units) Forecast by Material, 2020-2035
  • Table 35: Europe Market Value (USD Million) Forecast by Capacity, 2020-2035
  • Table 36: Europe Market Volume (Units) Forecast by Capacity, 2020-2035
  • Table 37: Europe Market Value (USD Million) Forecast by End Use, 2020-2035
  • Table 38: Europe Market Volume (Units) Forecast by End Use, 2020-2035
  • Table 39: Europe Market Value (USD Million) Forecast by Distribution Channel, 2020-2035
  • Table 40: Europe Market Volume (Units) Forecast by Distribution Channel, 2020-2035
  • Table 41: East Asia Market Value (USD Million) Forecast by Country, 2020-2035
  • Table 42: East Asia Market Volume (Units) Forecast by Country, 2020-2035
  • Table 43: East Asia Market Value (USD Million) Forecast by Material, 2020-2035
  • Table 44: East Asia Market Volume (Units) Forecast by Material, 2020-2035
  • Table 45: East Asia Market Value (USD Million) Forecast by Capacity, 2020-2035
  • Table 46: East Asia Market Volume (Units) Forecast by Capacity, 2020-2035
  • Table 47: East Asia Market Value (USD Million) Forecast by End Use, 2020-2035
  • Table 48: East Asia Market Volume (Units) Forecast by End Use, 2020-2035
  • Table 49: East Asia Market Value (USD Million) Forecast by Distribution Channel, 2020-2035
  • Table 50: East Asia Market Volume (Units) Forecast by Distribution Channel, 2020-2035
  • Table 51: South Asia Market Value (USD Million) Forecast by Country, 2020-2035
  • Table 52: South Asia Market Volume (Units) Forecast by Country, 2020-2035
  • Table 53: South Asia Market Value (USD Million) Forecast by Material, 2020-2035
  • Table 54: South Asia Market Volume (Units) Forecast by Material, 2020-2035
  • Table 55: South Asia Market Value (USD Million) Forecast by Capacity, 2020-2035
  • Table 56: South Asia Market Volume (Units) Forecast by Capacity, 2020-2035
  • Table 57: South Asia Market Value (USD Million) Forecast by End Use, 2020-2035
  • Table 58: South Asia Market Volume (Units) Forecast by End Use, 2020-2035
  • Table 59: South Asia Market Value (USD Million) Forecast by Distribution Channel, 2020-2035
  • Table 60: South Asia Market Volume (Units) Forecast by Distribution Channel, 2020-2035
  • Table 61: Oceania Market Value (USD Million) Forecast by Country, 2020-2035
  • Table 62: Oceania Market Volume (Units) Forecast by Country, 2020-2035
  • Table 63: Oceania Market Value (USD Million) Forecast by Material, 2020-2035
  • Table 64: Oceania Market Volume (Units) Forecast by Material, 2020-2035
  • Table 65: Oceania Market Value (USD Million) Forecast by Capacity, 2020-2035
  • Table 66: Oceania Market Volume (Units) Forecast by Capacity, 2020-2035
  • Table 67: Oceania Market Value (USD Million) Forecast by End Use, 2020-2035
  • Table 68: Oceania Market Volume (Units) Forecast by End Use, 2020-2035
  • Table 69: Oceania Market Value (USD Million) Forecast by Distribution Channel, 2020-2035
  • Table 70: Oceania Market Volume (Units) Forecast by Distribution Channel, 2020-2035
  • Table 71: MEA Market Value (USD Million) Forecast by Country, 2020-2035
  • Table 72: MEA Market Volume (Units) Forecast by Country, 2020-2035
  • Table 73: MEA Market Value (USD Million) Forecast by Material, 2020-2035
  • Table 74: MEA Market Volume (Units) Forecast by Material, 2020-2035
  • Table 75: MEA Market Value (USD Million) Forecast by Capacity, 2020-2035
  • Table 76: MEA Market Volume (Units) Forecast by Capacity, 2020-2035
  • Table 77: MEA Market Value (USD Million) Forecast by End Use, 2020-2035
  • Table 78: MEA Market Volume (Units) Forecast by End Use, 2020-2035
  • Table 79: MEA Market Value (USD Million) Forecast by Distribution Channel, 2020-2035
  • Table 80: MEA Market Volume (Units) Forecast by Distribution Channel, 2020-2035

List of Figures

  • Figure 1: Global Market Value (USD Million) by Material, 2025-2035
  • Figure 2: Global Market Value (USD Million) by Capacity, 2025-2035
  • Figure 3: Global Market Value (USD Million) by End Use, 2025-2035
  • Figure 4: Global Market Value (USD Million) by Distribution Channel, 2025-2035
  • Figure 5: Global Market Value (USD Million) by Region, 2025-2035
  • Figure 6: Global Market Value (USD Million) Analysis by Region, 2020-2035
  • Figure 7: Global Market Volume (Units) Analysis by Region, 2020-2035
  • Figure 8: Global Market Value Share (%) and BPS Analysis by Region, 2025-2035
  • Figure 9: Global Market Y-o-Y Growth (%) Projections by Region, 2025-2035
  • Figure 10: Global Market Value (USD Million) Analysis by Material, 2020-2035
  • Figure 11: Global Market Volume (Units) Analysis by Material, 2020-2035
  • Figure 12: Global Market Value Share (%) and BPS Analysis by Material, 2025-2035
  • Figure 13: Global Market Y-o-Y Growth (%) Projections by Material, 2025-2035
  • Figure 14: Global Market Value (USD Million) Analysis by Capacity, 2020-2035
  • Figure 15: Global Market Volume (Units) Analysis by Capacity, 2020-2035
  • Figure 16: Global Market Value Share (%) and BPS Analysis by Capacity, 2025-2035
  • Figure 17: Global Market Y-o-Y Growth (%) Projections by Capacity, 2025-2035
  • Figure 18: Global Market Value (USD Million) Analysis by End Use, 2020-2035
  • Figure 19: Global Market Volume (Units) Analysis by End Use, 2020-2035
  • Figure 20: Global Market Value Share (%) and BPS Analysis by End Use, 2025-2035
  • Figure 21: Global Market Y-o-Y Growth (%) Projections by End Use, 2025-2035
  • Figure 22: Global Market Value (USD Million) Analysis by Distribution Channel, 2020-2035
  • Figure 23: Global Market Volume (Units) Analysis by Distribution Channel, 2020-2035
  • Figure 24: Global Market Value Share (%) and BPS Analysis by Distribution Channel, 2025-2035
  • Figure 25: Global Market Y-o-Y Growth (%) Projections by Distribution Channel, 2025-2035
  • Figure 26: Global Market Attractiveness by Material, 2025-2035
  • Figure 27: Global Market Attractiveness by Capacity, 2025-2035
  • Figure 28: Global Market Attractiveness by End Use, 2025-2035
  • Figure 29: Global Market Attractiveness by Distribution Channel, 2025-2035
  • Figure 30: Global Market Attractiveness by Region, 2025-2035
  • Figure 31: North America Market Value (USD Million) by Material, 2025-2035
  • Figure 32: North America Market Value (USD Million) by Capacity, 2025-2035
  • Figure 33: North America Market Value (USD Million) by End Use, 2025-2035
  • Figure 34: North America Market Value (USD Million) by Distribution Channel, 2025-2035
  • Figure 35: North America Market Value (USD Million) by Country, 2025-2035
  • Figure 36: North America Market Value (USD Million) Analysis by Country, 2020-2035
  • Figure 37: North America Market Volume (Units) Analysis by Country, 2020-2035
  • Figure 38: North America Market Value Share (%) and BPS Analysis by Country, 2025-2035
  • Figure 39: North America Market Y-o-Y Growth (%) Projections by Country, 2025-2035
  • Figure 40: North America Market Value (USD Million) Analysis by Material, 2020-2035
  • Figure 41: North America Market Volume (Units) Analysis by Material, 2020-2035
  • Figure 42: North America Market Value Share (%) and BPS Analysis by Material, 2025-2035
  • Figure 43: North America Market Y-o-Y Growth (%) Projections by Material, 2025-2035
  • Figure 44: North America Market Value (USD Million) Analysis by Capacity, 2020-2035
  • Figure 45: North America Market Volume (Units) Analysis by Capacity, 2020-2035
  • Figure 46: North America Market Value Share (%) and BPS Analysis by Capacity, 2025-2035
  • Figure 47: North America Market Y-o-Y Growth (%) Projections by Capacity, 2025-2035
  • Figure 48: North America Market Value (USD Million) Analysis by End Use, 2020-2035
  • Figure 49: North America Market Volume (Units) Analysis by End Use, 2020-2035
  • Figure 50: North America Market Value Share (%) and BPS Analysis by End Use, 2025-2035
  • Figure 51: North America Market Y-o-Y Growth (%) Projections by End Use, 2025-2035
  • Figure 52: North America Market Value (USD Million) Analysis by Distribution Channel, 2020-2035
  • Figure 53: North America Market Volume (Units) Analysis by Distribution Channel, 2020-2035
  • Figure 54: North America Market Value Share (%) and BPS Analysis by Distribution Channel, 2025-2035
  • Figure 55: North America Market Y-o-Y Growth (%) Projections by Distribution Channel, 2025-2035
  • Figure 56: North America Market Attractiveness by Material, 2025-2035
  • Figure 57: North America Market Attractiveness by Capacity, 2025-2035
  • Figure 58: North America Market Attractiveness by End Use, 2025-2035
  • Figure 59: North America Market Attractiveness by Distribution Channel, 2025-2035
  • Figure 60: North America Market Attractiveness by Country, 2025-2035
  • Figure 61: Latin America Market Value (USD Million) by Material, 2025-2035
  • Figure 62: Latin America Market Value (USD Million) by Capacity, 2025-2035
  • Figure 63: Latin America Market Value (USD Million) by End Use, 2025-2035
  • Figure 64: Latin America Market Value (USD Million) by Distribution Channel, 2025-2035
  • Figure 65: Latin America Market Value (USD Million) by Country, 2025-2035
  • Figure 66: Latin America Market Value (USD Million) Analysis by Country, 2020-2035
  • Figure 67: Latin America Market Volume (Units) Analysis by Country, 2020-2035
  • Figure 68: Latin America Market Value Share (%) and BPS Analysis by Country, 2025-2035
  • Figure 69: Latin America Market Y-o-Y Growth (%) Projections by Country, 2025-2035
  • Figure 70: Latin America Market Value (USD Million) Analysis by Material, 2020-2035
  • Figure 71: Latin America Market Volume (Units) Analysis by Material, 2020-2035
  • Figure 72: Latin America Market Value Share (%) and BPS Analysis by Material, 2025-2035
  • Figure 73: Latin America Market Y-o-Y Growth (%) Projections by Material, 2025-2035
  • Figure 74: Latin America Market Value (USD Million) Analysis by Capacity, 2020-2035
  • Figure 75: Latin America Market Volume (Units) Analysis by Capacity, 2020-2035
  • Figure 76: Latin America Market Value Share (%) and BPS Analysis by Capacity, 2025-2035
  • Figure 77: Latin America Market Y-o-Y Growth (%) Projections by Capacity, 2025-2035
  • Figure 78: Latin America Market Value (USD Million) Analysis by End Use, 2020-2035
  • Figure 79: Latin America Market Volume (Units) Analysis by End Use, 2020-2035
  • Figure 80: Latin America Market Value Share (%) and BPS Analysis by End Use, 2025-2035
  • Figure 81: Latin America Market Y-o-Y Growth (%) Projections by End Use, 2025-2035
  • Figure 82: Latin America Market Value (USD Million) Analysis by Distribution Channel, 2020-2035
  • Figure 83: Latin America Market Volume (Units) Analysis by Distribution Channel, 2020-2035
  • Figure 84: Latin America Market Value Share (%) and BPS Analysis by Distribution Channel, 2025-2035
  • Figure 85: Latin America Market Y-o-Y Growth (%) Projections by Distribution Channel, 2025-2035
  • Figure 86: Latin America Market Attractiveness by Material, 2025-2035
  • Figure 87: Latin America Market Attractiveness by Capacity, 2025-2035
  • Figure 88: Latin America Market Attractiveness by End Use, 2025-2035
  • Figure 89: Latin America Market Attractiveness by Distribution Channel, 2025-2035
  • Figure 90: Latin America Market Attractiveness by Country, 2025-2035
  • Figure 91: Europe Market Value (USD Million) by Material, 2025-2035
  • Figure 92: Europe Market Value (USD Million) by Capacity, 2025-2035
  • Figure 93: Europe Market Value (USD Million) by End Use, 2025-2035
  • Figure 94: Europe Market Value (USD Million) by Distribution Channel, 2025-2035
  • Figure 95: Europe Market Value (USD Million) by Country, 2025-2035
  • Figure 96: Europe Market Value (USD Million) Analysis by Country, 2020-2035
  • Figure 97: Europe Market Volume (Units) Analysis by Country, 2020-2035
  • Figure 98: Europe Market Value Share (%) and BPS Analysis by Country, 2025-2035
  • Figure 99: Europe Market Y-o-Y Growth (%) Projections by Country, 2025-2035
  • Figure 100: Europe Market Value (USD Million) Analysis by Material, 2020-2035
  • Figure 101: Europe Market Volume (Units) Analysis by Material, 2020-2035
  • Figure 102: Europe Market Value Share (%) and BPS Analysis by Material, 2025-2035
  • Figure 103: Europe Market Y-o-Y Growth (%) Projections by Material, 2025-2035
  • Figure 104: Europe Market Value (USD Million) Analysis by Capacity, 2020-2035
  • Figure 105: Europe Market Volume (Units) Analysis by Capacity, 2020-2035
  • Figure 106: Europe Market Value Share (%) and BPS Analysis by Capacity, 2025-2035
  • Figure 107: Europe Market Y-o-Y Growth (%) Projections by Capacity, 2025-2035
  • Figure 108: Europe Market Value (USD Million) Analysis by End Use, 2020-2035
  • Figure 109: Europe Market Volume (Units) Analysis by End Use, 2020-2035
  • Figure 110: Europe Market Value Share (%) and BPS Analysis by End Use, 2025-2035
  • Figure 111: Europe Market Y-o-Y Growth (%) Projections by End Use, 2025-2035
  • Figure 112: Europe Market Value (USD Million) Analysis by Distribution Channel, 2020-2035
  • Figure 113: Europe Market Volume (Units) Analysis by Distribution Channel, 2020-2035
  • Figure 114: Europe Market Value Share (%) and BPS Analysis by Distribution Channel, 2025-2035
  • Figure 115: Europe Market Y-o-Y Growth (%) Projections by Distribution Channel, 2025-2035
  • Figure 116: Europe Market Attractiveness by Material, 2025-2035
  • Figure 117: Europe Market Attractiveness by Capacity, 2025-2035
  • Figure 118: Europe Market Attractiveness by End Use, 2025-2035
  • Figure 119: Europe Market Attractiveness by Distribution Channel, 2025-2035
  • Figure 120: Europe Market Attractiveness by Country, 2025-2035
  • Figure 121: East Asia Market Value (USD Million) by Material, 2025-2035
  • Figure 122: East Asia Market Value (USD Million) by Capacity, 2025-2035
  • Figure 123: East Asia Market Value (USD Million) by End Use, 2025-2035
  • Figure 124: East Asia Market Value (USD Million) by Distribution Channel, 2025-2035
  • Figure 125: East Asia Market Value (USD Million) by Country, 2025-2035
  • Figure 126: East Asia Market Value (USD Million) Analysis by Country, 2020-2035
  • Figure 127: East Asia Market Volume (Units) Analysis by Country, 2020-2035
  • Figure 128: East Asia Market Value Share (%) and BPS Analysis by Country, 2025-2035
  • Figure 129: East Asia Market Y-o-Y Growth (%) Projections by Country, 2025-2035
  • Figure 130: East Asia Market Value (USD Million) Analysis by Material, 2020-2035
  • Figure 131: East Asia Market Volume (Units) Analysis by Material, 2020-2035
  • Figure 132: East Asia Market Value Share (%) and BPS Analysis by Material, 2025-2035
  • Figure 133: East Asia Market Y-o-Y Growth (%) Projections by Material, 2025-2035
  • Figure 134: East Asia Market Value (USD Million) Analysis by Capacity, 2020-2035
  • Figure 135: East Asia Market Volume (Units) Analysis by Capacity, 2020-2035
  • Figure 136: East Asia Market Value Share (%) and BPS Analysis by Capacity, 2025-2035
  • Figure 137: East Asia Market Y-o-Y Growth (%) Projections by Capacity, 2025-2035
  • Figure 138: East Asia Market Value (USD Million) Analysis by End Use, 2020-2035
  • Figure 139: East Asia Market Volume (Units) Analysis by End Use, 2020-2035
  • Figure 140: East Asia Market Value Share (%) and BPS Analysis by End Use, 2025-2035
  • Figure 141: East Asia Market Y-o-Y Growth (%) Projections by End Use, 2025-2035
  • Figure 142: East Asia Market Value (USD Million) Analysis by Distribution Channel, 2020-2035
  • Figure 143: East Asia Market Volume (Units) Analysis by Distribution Channel, 2020-2035
  • Figure 144: East Asia Market Value Share (%) and BPS Analysis by Distribution Channel, 2025-2035
  • Figure 145: East Asia Market Y-o-Y Growth (%) Projections by Distribution Channel, 2025-2035
  • Figure 146: East Asia Market Attractiveness by Material, 2025-2035
  • Figure 147: East Asia Market Attractiveness by Capacity, 2025-2035
  • Figure 148: East Asia Market Attractiveness by End Use, 2025-2035
  • Figure 149: East Asia Market Attractiveness by Distribution Channel, 2025-2035
  • Figure 150: East Asia Market Attractiveness by Country, 2025-2035
  • Figure 151: South Asia Market Value (USD Million) by Material, 2025-2035
  • Figure 152: South Asia Market Value (USD Million) by Capacity, 2025-2035
  • Figure 153: South Asia Market Value (USD Million) by End Use, 2025-2035
  • Figure 154: South Asia Market Value (USD Million) by Distribution Channel, 2025-2035
  • Figure 155: South Asia Market Value (USD Million) by Country, 2025-2035
  • Figure 156: South Asia Market Value (USD Million) Analysis by Country, 2020-2035
  • Figure 157: South Asia Market Volume (Units) Analysis by Country, 2020-2035
  • Figure 158: South Asia Market Value Share (%) and BPS Analysis by Country, 2025-2035
  • Figure 159: South Asia Market Y-o-Y Growth (%) Projections by Country, 2025-2035
  • Figure 160: South Asia Market Value (USD Million) Analysis by Material, 2020-2035
  • Figure 161: South Asia Market Volume (Units) Analysis by Material, 2020-2035
  • Figure 162: South Asia Market Value Share (%) and BPS Analysis by Material, 2025-2035
  • Figure 163: South Asia Market Y-o-Y Growth (%) Projections by Material, 2025-2035
  • Figure 164: South Asia Market Value (USD Million) Analysis by Capacity, 2020-2035
  • Figure 165: South Asia Market Volume (Units) Analysis by Capacity, 2020-2035
  • Figure 166: South Asia Market Value Share (%) and BPS Analysis by Capacity, 2025-2035
  • Figure 167: South Asia Market Y-o-Y Growth (%) Projections by Capacity, 2025-2035
  • Figure 168: South Asia Market Value (USD Million) Analysis by End Use, 2020-2035
  • Figure 169: South Asia Market Volume (Units) Analysis by End Use, 2020-2035
  • Figure 170: South Asia Market Value Share (%) and BPS Analysis by End Use, 2025-2035
  • Figure 171: South Asia Market Y-o-Y Growth (%) Projections by End Use, 2025-2035
  • Figure 172: South Asia Market Value (USD Million) Analysis by Distribution Channel, 2020-2035
  • Figure 173: South Asia Market Volume (Units) Analysis by Distribution Channel, 2020-2035
  • Figure 174: South Asia Market Value Share (%) and BPS Analysis by Distribution Channel, 2025-2035
  • Figure 175: South Asia Market Y-o-Y Growth (%) Projections by Distribution Channel, 2025-2035
  • Figure 176: South Asia Market Attractiveness by Material, 2025-2035
  • Figure 177: South Asia Market Attractiveness by Capacity, 2025-2035
  • Figure 178: South Asia Market Attractiveness by End Use, 2025-2035
  • Figure 179: South Asia Market Attractiveness by Distribution Channel, 2025-2035
  • Figure 180: South Asia Market Attractiveness by Country, 2025-2035
  • Figure 181: Oceania Market Value (USD Million) by Material, 2025-2035
  • Figure 182: Oceania Market Value (USD Million) by Capacity, 2025-2035
  • Figure 183: Oceania Market Value (USD Million) by End Use, 2025-2035
  • Figure 184: Oceania Market Value (USD Million) by Distribution Channel, 2025-2035
  • Figure 185: Oceania Market Value (USD Million) by Country, 2025-2035
  • Figure 186: Oceania Market Value (USD Million) Analysis by Country, 2020-2035
  • Figure 187: Oceania Market Volume (Units) Analysis by Country, 2020-2035
  • Figure 188: Oceania Market Value Share (%) and BPS Analysis by Country, 2025-2035
  • Figure 189: Oceania Market Y-o-Y Growth (%) Projections by Country, 2025-2035
  • Figure 190: Oceania Market Value (USD Million) Analysis by Material, 2020-2035
  • Figure 191: Oceania Market Volume (Units) Analysis by Material, 2020-2035
  • Figure 192: Oceania Market Value Share (%) and BPS Analysis by Material, 2025-2035
  • Figure 193: Oceania Market Y-o-Y Growth (%) Projections by Material, 2025-2035
  • Figure 194: Oceania Market Value (USD Million) Analysis by Capacity, 2020-2035
  • Figure 195: Oceania Market Volume (Units) Analysis by Capacity, 2020-2035
  • Figure 196: Oceania Market Value Share (%) and BPS Analysis by Capacity, 2025-2035
  • Figure 197: Oceania Market Y-o-Y Growth (%) Projections by Capacity, 2025-2035
  • Figure 198: Oceania Market Value (USD Million) Analysis by End Use, 2020-2035
  • Figure 199: Oceania Market Volume (Units) Analysis by End Use, 2020-2035
  • Figure 200: Oceania Market Value Share (%) and BPS Analysis by End Use, 2025-2035
  • Figure 201: Oceania Market Y-o-Y Growth (%) Projections by End Use, 2025-2035
  • Figure 202: Oceania Market Value (USD Million) Analysis by Distribution Channel, 2020-2035
  • Figure 203: Oceania Market Volume (Units) Analysis by Distribution Channel, 2020-2035
  • Figure 204: Oceania Market Value Share (%) and BPS Analysis by Distribution Channel, 2025-2035
  • Figure 205: Oceania Market Y-o-Y Growth (%) Projections by Distribution Channel, 2025-2035
  • Figure 206: Oceania Market Attractiveness by Material, 2025-2035
  • Figure 207: Oceania Market Attractiveness by Capacity, 2025-2035
  • Figure 208: Oceania Market Attractiveness by End Use, 2025-2035
  • Figure 209: Oceania Market Attractiveness by Distribution Channel, 2025-2035
  • Figure 210: Oceania Market Attractiveness by Country, 2025-2035
  • Figure 211: MEA Market Value (USD Million) by Material, 2025-2035
  • Figure 212: MEA Market Value (USD Million) by Capacity, 2025-2035
  • Figure 213: MEA Market Value (USD Million) by End Use, 2025-2035
  • Figure 214: MEA Market Value (USD Million) by Distribution Channel, 2025-2035
  • Figure 215: MEA Market Value (USD Million) by Country, 2025-2035
  • Figure 216: MEA Market Value (USD Million) Analysis by Country, 2020-2035
  • Figure 217: MEA Market Volume (Units) Analysis by Country, 2020-2035
  • Figure 218: MEA Market Value Share (%) and BPS Analysis by Country, 2025-2035
  • Figure 219: MEA Market Y-o-Y Growth (%) Projections by Country, 2025-2035
  • Figure 220: MEA Market Value (USD Million) Analysis by Material, 2020-2035
  • Figure 221: MEA Market Volume (Units) Analysis by Material, 2020-2035
  • Figure 222: MEA Market Value Share (%) and BPS Analysis by Material, 2025-2035
  • Figure 223: MEA Market Y-o-Y Growth (%) Projections by Material, 2025-2035
  • Figure 224: MEA Market Value (USD Million) Analysis by Capacity, 2020-2035
  • Figure 225: MEA Market Volume (Units) Analysis by Capacity, 2020-2035
  • Figure 226: MEA Market Value Share (%) and BPS Analysis by Capacity, 2025-2035
  • Figure 227: MEA Market Y-o-Y Growth (%) Projections by Capacity, 2025-2035
  • Figure 228: MEA Market Value (USD Million) Analysis by End Use, 2020-2035
  • Figure 229: MEA Market Volume (Units) Analysis by End Use, 2020-2035
  • Figure 230: MEA Market Value Share (%) and BPS Analysis by End Use, 2025-2035
  • Figure 231: MEA Market Y-o-Y Growth (%) Projections by End Use, 2025-2035
  • Figure 232: MEA Market Value (USD Million) Analysis by Distribution Channel, 2020-2035
  • Figure 233: MEA Market Volume (Units) Analysis by Distribution Channel, 2020-2035
  • Figure 234: MEA Market Value Share (%) and BPS Analysis by Distribution Channel, 2025-2035
  • Figure 235: MEA Market Y-o-Y Growth (%) Projections by Distribution Channel, 2025-2035
  • Figure 236: MEA Market Attractiveness by Material, 2025-2035
  • Figure 237: MEA Market Attractiveness by Capacity, 2025-2035
  • Figure 238: MEA Market Attractiveness by End Use, 2025-2035
  • Figure 239: MEA Market Attractiveness by Distribution Channel, 2025-2035
  • Figure 240: MEA Market Attractiveness by Country, 2025-2035

Frequently Asked Questions

What was the overall size of the single wall jars market in 2025?

The overall market size for the single wall jars market was USD 25.5 billion in 2025.

How big is the single wall jars market expected to be in 2035?

The single wall jars market is expected to reach USD 40.0 billion in 2035.

What will drive the demand for the single wall jars market during the forecast period?

The increasing demand for lightweight and cost-effective packaging, rising use in personal care and cosmetic products, and growing preference for recyclable plastic containers fuel the single wall jars market during the forecast period.

List the top 5 countries contributing to the single wall jars market.

The top 5 countries driving the development of the single wall jars market are the USA, UK, European Union, Japan, and South Korea.

Which segment in type is expected to lead in the single wall jars market?

Plastic-based single wall jars and cosmetics application lead market growth to command a significant share over the assessment period.

Explore Similar Insights

Future Market Insights

Single Wall Jars Market