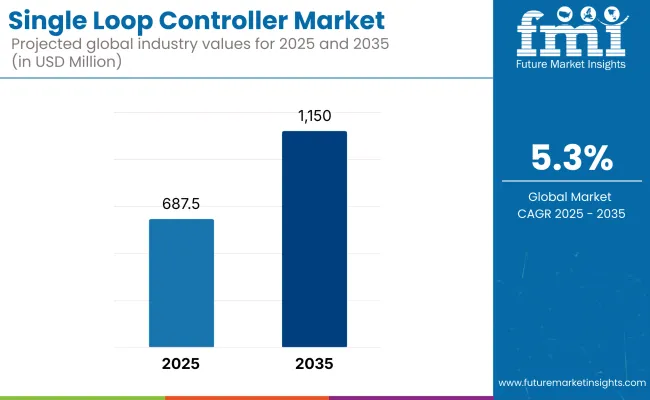
The global single loop controller market is poised to grow from USD 687.5 million in 2025 to approximately USD 1.15 billion by 2035, registering a healthy CAGR of 5.3% over the forecast period. Growth is propelled by rising demand from industries such as oil & gas, pharmaceuticals, food processing, and chemicals, where precision control of variables like temperature, pressure, and flow is critical.
| Metric | Value |
|---|---|
| Estimated Size (2025E) | USD 687.5 million |
| Projected Value (2035F) | USD 1.15 billion |
| CAGR (2025 to 2035) | 5.3% |
The integration of IoT, AI-based fault detection, and predictive maintenance systems into single loop controllers has transformed them from basic control units into intelligent, networked assets. Particularly in North America and Western Europe, industrial operators are investing in digital controllers with touchscreen interfaces, remote diagnostics, and advanced data logging features.
In contrast, Asia-Pacific, led by China, India, and South Korea, is seeing rapid adoption of cost-effective, space-efficient models to support growing manufacturing capacity and smart factory initiatives. Compact DIN-sized controllers are gaining traction in sectors such as semiconductors, power plants, and specialty chemicals.
Looking ahead, evolving energy efficiency regulations, Industry 4.0 standards, and decentralized automation architectures are expected to fuel sustained demand. Temperature controllers remain the dominant product type, owing to their widespread use in thermal-sensitive processes, but growth is also accelerating in oil & gas, power, and petrochemical applications.
Companies are increasingly seeking modular, multi-loop systems and AI-augmented monitoring capabilities to reduce downtime and improve process yield. Regional regulations-such as OSHA in the US, CE in Europe, and PSE in Japan-continue to shape certification standards and drive innovation. Firms that offer compact, IoT-integrated, and compliance-ready controllers are best positioned to capitalize on the next wave of industrial automation.
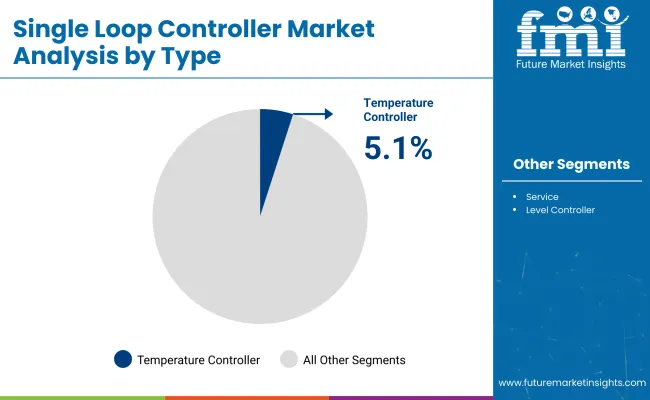
Temperature controllers will continue to dominate the single loop controller market due to their extensive application in industries like pharmaceuticals, food processing, chemicals, and semiconductors, where even minor thermal fluctuations can impact product quality or safety. Their role in maintaining optimal process efficiency and reducing energy waste ensures widespread adoption.
The rising focus on energy savings and process optimization-especially in heating, cooling, and thermal-based chemical reactions-will continue to support their lead. As industries increasingly adopt AI-integrated temperature regulation for predictive control, the demand for digital temperature controllers will accelerate.
| Type | CAGR (2025 to 2035) |
|---|---|
| Temperature Controllers | 5.1% |
| Display Type | CAGR (2025 to 2035) |
|---|---|
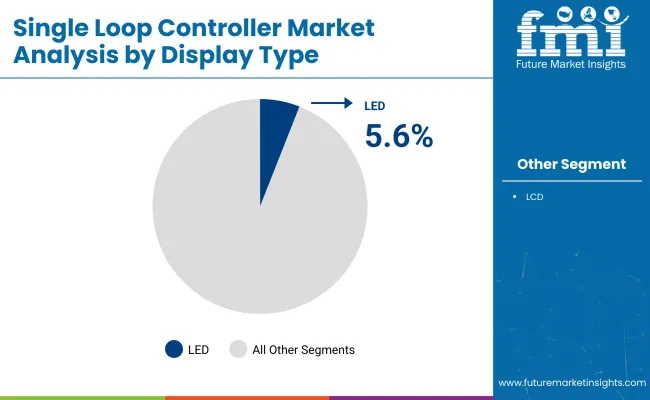
| LED | 5.6% |
LCD controllers currently dominate the industry due to their cost-effectiveness, clarity, and wide compatibility with existing systems. They are the preferred choice in sectors with frequent manual monitoring. However, LED controllers are expected to grow faster owing to their superior brightness, rugged durability, and performance in low-visibility or outdoor industrial settings. As industries in marine, mining, and power demand longer-lasting, high-brightness solutions with minimal maintenance, LED display panels will increasingly replace older technologies.
1/4 DIN controllers maintain the largest share due to their use in large-scale industrial units like power plants and refineries, where space isn’t a constraint. However, the fastest-growing category will be 1/32 DIN due to the rising demand in compact equipment used in semiconductor manufacturing, medical devices, and lab automation. These microcontrollers are increasingly favored where precision meets space constraint, especially in smart factories and portable industrial systems.
| Panel Cutout Size | CAGR (2025 to 2035) |
|---|---|
| 1/32 DIN | 6.1% |
Among all application sectors, oil & gas plants are expected to grow the fastest due to their need for precise control over pressure, flow, and temperature in hazardous environments. The transition to automation in drilling, pipeline monitoring, and refinery operations-combined with stringent regulatory demands-makes single loop controllers indispensable.
The integration of IoT and real-time alerts for safety and performance monitoring is driving replacement of legacy systems. While chemical and power plants also show strong adoption, oil & gas remains the most regulation-sensitive and automation-focused sector.
| Application | CAGR (2025 to 2035) |
|---|---|
| Oil & Gas Plants | 4.9% |
Surveyed Q4 2024, n=450 stakeholder participants evenly distributed across manufacturers, distributors, industrial operators, and regulators in the US, Western Europe, Japan, and South Korea
Regional Variance
High Variance
Convergent and Divergent Perspectives on ROI
Consensus
Stainless Steel Enclosures: Selected by 65% globally for its durability, corrosion resistance, and suitability for harsh industrial environments.
Variance
Shared Challenges
84% of stakeholders cited rising costs of raw materials, especially metals and semiconductors, as a primary concern for manufacturers.
Regional Differences
Manufacturers
Distributors
End-Users (Industrial Operators)
Alignment
70% of global manufacturers plan to invest in IoT-enabled and AI-powered controllers for predictive maintenance and real-time monitoring.
Divergence
Regulatory Impact
High Consensus
Safety, reliability, and cost-effectiveness remain key global concerns in the industry.
Key Variances
| Countries | Regulatory Impact and Mandatory Certifications |
|---|---|
| USA | OSHA Regulations: Compliance with Occupational Safety and Health Administration (OSHA) standards is critical for industrial automation and safety. |
| UK | BS EN Standards: Compliance with British Standard EN 61131-2 for programmable controllers and systems is required |
| France | NF C 15-100: This French standard governs electrical installations and safety regulations for automation systems including single loop controllers. |
| Germany | CE Marking: These controllers must adhere to EU CE marking regulations for conformity to health, safety, and environmental standards. |
| Italy | CE Marking: Mandatory for products to be marketed in the European Union, ensuring that they meet safety, environmental, and health standards. |
| South Korea | KC Certification: These controllers must meet Korea Certification (KC) standards for electrical safety and electromagnetic compatibility. |
| Japan | PSE (Product Safety Electrical Appliance and Material): Products must adhere to PSE safety certification for electrical products. |
| China | CCC (China Compulsory Certification): Mandatory for electrical and automation products to ensure safety standards. |
| India | BIS Certification: The Bureau of Indian Standards (BIS) requires certain industrial control products, including single loop controllers, to meet Indian safety and performance standards. |
| 2020 to 2024 | 2025 to 2035 |
|---|---|
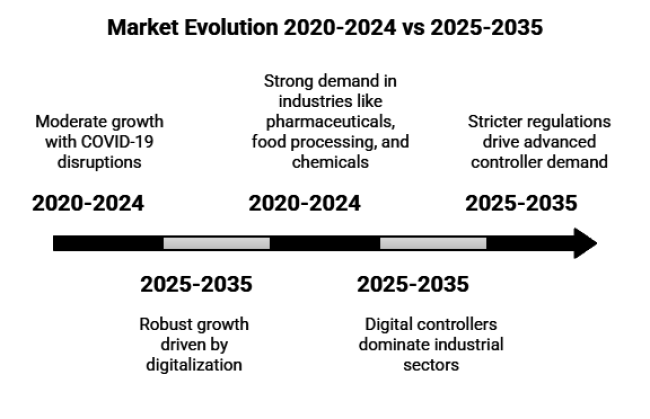
| Moderate growth with some disruptions due to the COVID-19 pandemic and semiconductor shortages. Demand for automation increased slowly. | Expected to see robust growth driven by digitalization, Industry 4.0, and greater automation across industries. Strong growth in IoT adoption. |
| Gradual increase in adoption of digital controllers and IoT integration. Limited adoption of advanced technologies. | Significant growth in advanced technologies such as AI, real-time monitoring, cloud integration, and IoT-enabled controllers. |
| Strong demand in industries like pharmaceuticals, food processing, and chemicals for temperature and pressure control. | Continued strong demand in pharmaceuticals, food processing, oil and gas, water treatment, and emerging sectors like renewable energy. |
| Analog controllers still dominated, but digital controllers began gaining traction in industrial sectors. | Digital controllers will dominate, especially in industries requiring precision and real-time data analysis. Touchscreen and LCD displays will rise in popularity. |
| Regulations in sectors like pharmaceuticals and chemicals drove steady demand. However, some regulatory hurdles due to supply chain disruptions. | More stringent regulations in sectors like pharma, chemicals, and oil and gas will drive demand for more advanced controllers to ensure compliance. |
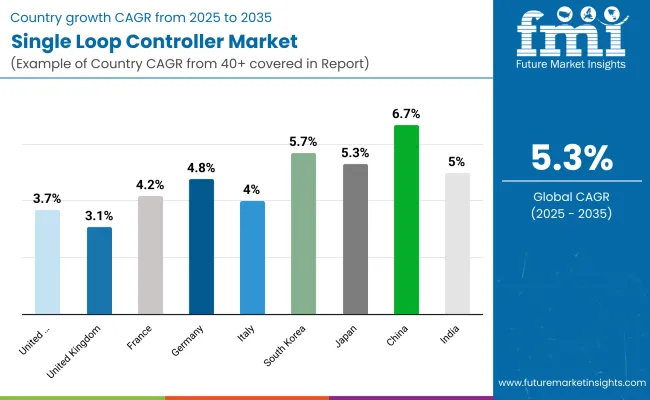
The industry in the United States is projected to grow at a CAGR of 3.7% from 2025 to 2035. As one of the largest industrial sectors in the world, the USA has a highly diversified demand for automation technologies, including single loop controllers.
Key sectors such as pharmaceuticals, oil and gas, and chemicals are major drivers for the industry, particularly due to stringent regulatory requirements and the need for precise control in critical applications. Furthermore, the growth of Industry 4.0 and the increasing adoption of IoT technologies are expected to significantly contribute to the demand for smarter, connected controllers.
The industry in the United Kingdom is expected to grow at a CAGR of 3.1% from 2025 to 2035. The UK's industrial base, though mature, continues to adopt advanced automation technologies, especially in sectors like energy, pharmaceuticals, and automotive manufacturing. The government's strong focus on sustainability and energy efficiency is encouraging the shift toward eco-friendly automation solutions, including single loop controllers that offer energy savings and operational reliability.
However, economic uncertainties and the post-Brexit environment may present challenges in terms of industry expansion. Despite these hurdles, the UK’s commitment to safety standards and regulatory compliance will continue to drive steady demand for high-quality, reliable control systems.
The industry in France is forecasted to grow at a CAGR of 4.2% from 2025 to 2035. France is a significant industrial player in Europe, with key sectors such as nuclear energy, automotive manufacturing, and chemicals driving the need for precise automation systems. The country’s emphasis on green energy and energy-efficient solutions will play a major role in the adoption of advanced control systems that reduce energy consumption and improve operational efficiency.
The government's focus on energy transitions and reducing carbon emissions will drive the adoption of sustainable automation solutions. Moreover, the push toward Industry 4.0 and digital transformation across industries will create significant opportunities for growth in the automation industry.
The industry in Germany is projected to grow at a CAGR of 4.8% from 2025 to 2035. Germany remains one of the world’s industrial powerhouses, especially in sectors such as automotive, chemicals, and machine manufacturing. The country’s focus on precision engineering and Industry 4.0 initiatives is expected to drive demand for more sophisticated and interconnected automation systems, including these controllers.
As industries adopt smart factory technologies and advanced control systems to enhance productivity, the demand for high-performance, reliable automation products like these controllers will continue to rise.
The industry in Italy is expected to grow at a CAGR of 4.0% from 2025 to 2035. Italy’s industrial base, particularly in the sectors of automotive manufacturing, food processing, and chemicals, is expected to continue expanding, driving demand for more sophisticated automation solutions. The need for precision, energy efficiency, and regulatory compliance in these industries will be key drivers for the adoption of these controllers.
There will be increased demand for controllers that optimize operations and meet stringent industry standards. The adoption of smart manufacturing and energy-efficient technologies in key sectors will help drive steady growth over the forecast period.
South Korea industry is projected to grow at a CAGR of 5.7% over the next 10 years. There is high demand for these controllers in South Korea due to the country’s extensive industrial sectors, notably the electronics, automotive manufacturing, and semiconductors industries that are embracing automation technologies at an accelerated pace. There will be a massive focus on smart factories and associated IoT technologies, which will fuel future demand for automation solutions that offer real-time data and greater control.
The industry in South Korea is poised for rapid growth owing to the early adoption of next-generation automation systems, making it a more promising industry in the Asia-Pacific region.
The industry in Japan is expected to grow at a CAGR of 5.3%. Japan still plays a significant role in industrial automation, especially in manufacturing electronics, automotive, and consumer goods. The country's emphasis on precise, efficient, and sustainable manufacturing processes is a major factor motivating demand.
Japan’s ageing infrastructure and the increasing need for advanced automation systems to boost productivity are expected to drive industry growth. The country also focuses on energy efficiency and environmental sustainability, making it one of the most lucrative industries for innovative control technology providers.
China Single Loop Controller industry is forecast to grow at a CAGR of 6.7% between 2025 and 2035. Need for these controllers is primarily propelled by the exponential advancements in industries such as electronics, automotive, chemicals, and pharmaceuticals, accompanied by the penetration and acceptance of automation in these industries in China. The smart factories and green manufacturing processes in the country are aimed at increasing the levels of automation in manufacturing.
Increasingly, the country’s investment in digitalization and Industry 4.0 will also drive demand for advanced automation systems, including, for example, production-optimizing controllers. With China’s industries scaling up to meet Internet of Things (IoT) and miniaturisation goals, the need for both sophisticated and cost-efficient control systems that enable this will prevail across the entire forecast period.
The industry in India is projected to grow at a CAGR of 5.0% from 2025 to 2035. India’s industrial landscape is evolving rapidly, with significant investments in manufacturing, automotive, and pharmaceuticals sectors.
The country’s focus on smart manufacturing and digital transformation is expected to drive the adoption of advanced automation solutions, including these controllers. The country’s industrial base is expanding rapidly, with a focus on energy efficiency and process optimization, which will create opportunities for growth in the industry over the next decade.
The industry features key players providing process control solutions across various sectors. Yokogawa Electric Corporation is known for precision and reliability, offering solutions for oil and gas, chemicals, power, and pharmaceuticals. Honeywell International integrates IoT and predictive maintenance in its controllers, serving industries like pharmaceuticals and food & beverage. Emerson Electric Co. specializes in oil and gas and chemical manufacturing, emphasizing safety and efficiency.
Siemens AG incorporates AI and IoT for automation in power generation and chemicals. Schneider Electric focuses on sustainability and digital integration, catering to manufacturing, automotive, and energy industries for precise control.
The industry is divided into temperature controller, service, level controllers.
The landscape is bifurcated into LCD and LED.
The industry is segmented into ¼ Din, 1/8 Din, 1/16 Din, and 1/32 Din.
It is divided into oil and gas plants, petrochemical plants, power plants, chemical plants, iron and steel plants, and others.
The industry is studied across into North America, Latin America, Europe, Asia Pacific, and MEA.
Single loop controllers are used to regulate and monitor specific process variables like temperature, pressure, flow, and level in industries such as chemicals, pharmaceuticals, and food processing.
They provide precise control over critical parameters, ensuring efficiency, reducing errors, improving safety, and meeting regulatory standards.
Industries like oil and gas, chemicals, pharmaceuticals, food processing, power generation, and water treatment commonly use these controllers for precise process control.
Analog controllers are simpler and cost-effective, suitable for basic applications, while digital controllers offer advanced features like IoT integration, real-time monitoring, and high precision for complex operations.
The need for precise control, automation, integration with IoT systems, and regulatory compliance in industrial operations are major drivers for the adoption of single loop controllers.


Full Research Suite comprises of:
Market outlook & trends analysis
Interviews & case studies
Strategic recommendations
Vendor profiles & capabilities analysis
5-year forecasts
8 regions and 60+ country-level data splits
Market segment data splits
12 months of continuous data updates
DELIVERED AS:
PDF EXCEL ONLINE
Single Air Chamber Hydro-pneumatic Suspension Market Forecast and Outlook 2025 to 2035
Single-channel Frequency Synthesizer Market Size and Share Forecast Outlook 2025 to 2035
Single-axis Drives Market Size and Share Forecast Outlook 2025 to 2035
Single Roller Cone Bits Market Size and Share Forecast Outlook 2025 to 2035
Single Phase Spot Welder Machine Market Size and Share Forecast Outlook 2025 to 2035
Single Phase Spot Welder Market Size and Share Forecast Outlook 2025 to 2035
Single-use Bioreactors Market Size and Share Forecast Outlook 2025 to 2035
Single Board Computer Market Size and Share Forecast Outlook 2025 to 2035
Single-Serve Packaging Market Size and Share Forecast Outlook 2025 to 2035
Single Phase Recloser Market Size and Share Forecast Outlook 2025 to 2035
Single Phase Portable Conventional Gensets Market Size and Share Forecast Outlook 2025 to 2035
Single Phase Residential Voltage Regulator Market Size and Share Forecast Outlook 2025 to 2035
Single Phase Shunt Reactor Market Size and Share Forecast Outlook 2025 to 2035
Single Phase Air Cooled Home Standby Gensets Market Size and Share Forecast Outlook 2025 to 2035
Single Screw Extruder Market Size and Share Forecast Outlook 2025 to 2035
Single Phase Residential Power Conditioner Market Size and Share Forecast Outlook 2025 to 2035
Single Phase PV Inverter Market Size and Share Forecast Outlook 2025 to 2035
Single Phase Portable Generators Market Size and Share Forecast Outlook 2025 to 2035
Single Core Armored Cable Market Size and Share Forecast Outlook 2025 to 2035
Single Axis Solar Tracker Market Size and Share Forecast Outlook 2025 to 2035

Thank you!
You will receive an email from our Business Development Manager. Please be sure to check your SPAM/JUNK folder too.
Chat With
MaRIA