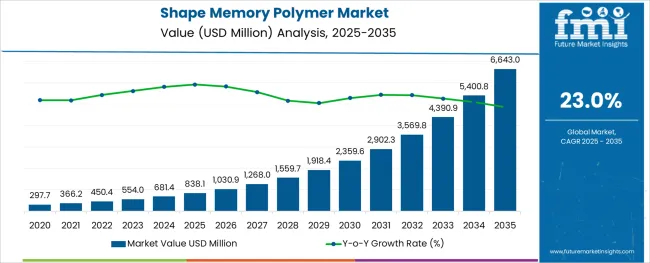
The Shape Memory Polymer Market is estimated to be valued at USD 838.1 million in 2025 and is projected to reach USD 6643.0 million by 2035, registering a compound annual growth rate (CAGR) of 23.0% over the forecast period.
The stainless steel valve tag market is expanding steadily as industrial sectors prioritize asset management, safety compliance, and equipment traceability. Increasing investments in infrastructure and process automation have heightened demand for robust and clear identification solutions capable of withstanding harsh environments.
The shift toward digital transformation in industries such as oil and gas, manufacturing, and utilities is encouraging the adoption of advanced tagging systems that support maintenance and audit operations. Growing awareness around regulatory compliance for equipment labeling and enhanced safety protocols is also influencing market expansion.
The rise of e-commerce platforms has facilitated easier procurement of valve tags, increasing accessibility for small to medium enterprises and broadening geographic reach. Material innovations and customization options continue to enhance product longevity and visibility, creating opportunities for market penetration across diverse industrial applications.
The market is segmented by Material Type, Application Type, and End Use Type and region. By Material Type, the market is divided into Polyurethane (PU) Shape Memory Polymer, Polyvinyl Chloride (PVC) Shape Memory Polymer, Acrylic Shape Memory Polymer, Epoxy Shape Memory Polymer, and Other Shape Memory Polymer Material. In terms of Application Type, the market is classified into Shape Memory Polymer for Commercial Applications and Shape Memory Polymer for Research & Development. Based on End Use Type, the market is segmented into Shape Memory Polymer for Biomedical Use, Shape Memory Polymer for Automotive, Shape Memory Polymer for Aerospace, Shape Memory Polymer for Textile, and Shape Memory Polymer for Other End Uses. Regionally, the market is classified into North America, Latin America, Western Europe, Eastern Europe, Balkan & Baltic Countries, Russia & Belarus, Central Asia, East Asia, South Asia & Pacific, and the Middle East & Africa.
The market is segmented by Material Type, Application Type, and End Use Type and region. By Material Type, the market is divided into Polyurethane (PU) Shape Memory Polymer, Polyvinyl Chloride (PVC) Shape Memory Polymer, Acrylic Shape Memory Polymer, Epoxy Shape Memory Polymer, and Other Shape Memory Polymer Material. In terms of Application Type, the market is classified into Shape Memory Polymer for Commercial Applications and Shape Memory Polymer for Research & Development. Based on End Use Type, the market is segmented into Shape Memory Polymer for Biomedical Use, Shape Memory Polymer for Automotive, Shape Memory Polymer for Aerospace, Shape Memory Polymer for Textile, and Shape Memory Polymer for Other End Uses. Regionally, the market is classified into North America, Latin America, Western Europe, Eastern Europe, Balkan & Baltic Countries, Russia & Belarus, Central Asia, East Asia, South Asia & Pacific, and the Middle East & Africa.
The less than 30 mm thickness segment is expected to hold 41.3% of the revenue share in 2025 within the thickness category. This segment’s leadership is supported by its suitability for a wide range of valve sizes and equipment types, providing sufficient durability while minimizing material costs.
The thinner tags offer flexibility in installation, especially in tight spaces and complex piping systems, making them preferable for industries where compactness is critical. Their compatibility with standard mounting hardware and ability to endure corrosion and wear have reinforced demand in sectors emphasizing both performance and cost efficiency.
This balance between robustness and adaptability has contributed to the segment’s dominant position.
Within the product type category, engraved valve tags are projected to command 57.8% of the market revenue share in 2025, marking them as the leading product form. The prominence of engraved tags is due to their superior legibility, permanence, and resistance to environmental degradation such as fading, scratching, and chemical exposure.
Engraving allows precise and customizable marking, meeting stringent industry standards for traceability and safety. The technique supports complex information including serial numbers, barcodes, and QR codes, enhancing integration with digital asset management systems.
Manufacturers’ emphasis on delivering long-lasting, tamper-proof tags that reduce maintenance costs has reinforced the adoption of engraved tags in heavy industries.
The online distribution channel is expected to generate 63.7% of market revenue in 2025, making it the most dominant sales route. The growth of e-commerce platforms has revolutionized procurement by offering convenience, broader product selections, and competitive pricing to end-users across industries.
Online channels enable buyers to access detailed product specifications, customization options, and customer reviews, simplifying purchase decisions. This has particularly benefited small and medium-sized enterprises lacking traditional supply chain networks.
Additionally, digital platforms have streamlined order fulfillment and reduced lead times, fostering faster adoption. Vendors are increasingly investing in online marketplaces and direct-to-customer websites to expand reach and improve customer engagement, reinforcing the online channel’s leadership in the stainless steel valve tag market.
North America holds the largest share of the shape memory polymer market, which is attributed to the presence of several product manufacturers and key end-users. Furthermore, the USA houses a proliferating healthcare industry which is accompanied by growing research in the biomedical field. These factors are estimated to bolster the global shape memory polymer market growth.
In addition, the development of various verticals in the region is attributed to the introduction of several regulations and programs, such as NAFTA and USMCA. Furthermore, the presence of aircraft manufacturers in the USA, as well as the growth of the aerospace and defense sectors, are further likely to propel the market growth.
The Asia Pacific is a growing shape memory polymer market owing to the increasing demand for this product from countries such as China, India and Japan, especially from the expanding construction industry. Likewise, the biomedical device manufacturing industry in China and South Korea is also gradually adopting shape memory polymers.
The shape memory polymer market share is likely to spearhead growth, especially in the biomedical industry owing to aspects such as flame retardation, favorable chemical and mechanical properties, and high dielectric strength together coupled with excellent insulation. Key providers in the shape memory polymer market are aiming to reshape the end user’s view of clinical success through the science of smart polymer.
Manufacturers are further concentrating on generating new healing possibilities. For instance, the regenerative smart polymer is growing in popularity within the biomedical industry since it stimulates the immune response and healing process to promote healthy new cellular growth as the material slowly “bioabsorbs” without chronic inflammation. Moreover, the dynamic smart polymer conforms to the anatomy and yields to the patient’s anatomy, providing stable occlusion and fill without unnecessary force. It further returns clarity as radiolucent material restores unprecedented visibility during and after the procedure.
These polymers deliver unmatched volume, which is essentially unparalleled volumes of porous material that promotes rapid clot formation, stable occlusion and durable seal. Certain brands are offering shape memory polymers that can be stabilized in a different form and then restored to their original shape on command. It is already improving its countless applications, as the secret to this smart material lies in its network structure. Researchers have recently tuned shape memory polymer formulations and pore sizes to create materials with differing cross-link densities, glass transition temperatures, and moisture plasticization and expansion rates.
The SMP was chemically created in its primary expanded shape, and then small holes were made in the pore membranes to maximize blood flow through the structure, and promote clotting and subsequent connective tissue deposition, in order to test a promising formulation. These factors are involved in the future prospects of the global shape memory polymer market growth.
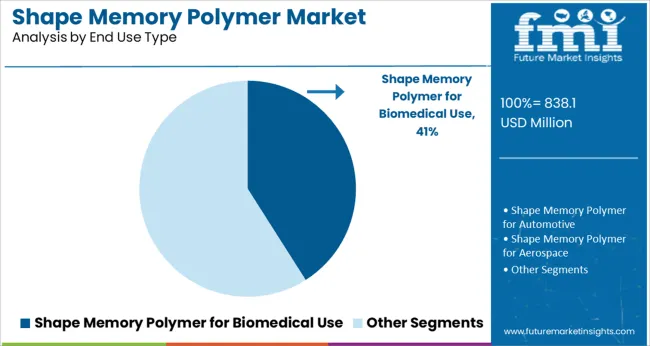
Shape memory polymers are smart materials that can change their shape in response to external stimuli. The materials find extensive use in automotive, biomedical and aerospace industry. Biomedical industry is a key end-user of SMPs as they are employed in producing a plethora of diagnostic and surgical devices such as catheters, sutures, stents, braces, splints, prosthetics and grafts. Thus shape memory polymers (SMPs), as stimuli-responsive materials, have garnered worldwide fame.
Shape memory polymers are also intensively utilized in the construction industry and find use as self-healing materials in sensors or actuators or structural health monitors and vibration control systems. Their use in kinetic buildings will also hold significance to the industry. This, more so when the government is promoting an eco-friendly zone and green buildings to lower the carbon footprint and protect the environment.
Shape memory polymers adoption in kinetic buildings as an envelope is of paramount significance with it responding to external stimuli to make do with minute structural changes in the buildings. This will optimize the building indoors, lowering energy roll-backs. From 2020 to 2024, sales of shape memory polymers inclined at a CAGR of 18.5%.
Shape memory polymer materials include PEEK, polyethylene, 1,3-propanediol, and many more. These items are widely used for various purposes. They are designed for use in the healthcare, aerospace, textiles, and automotive manufacturing industries. With the growth in R&D investments by manufacturers to acquire SMP novels, these resources will be increasingly marketed and used by consumer industries.
The biomedical end-user from shape memory polymer market will generate substantial market revenue over the period of assessment. The major applications of shape memory polymers in biomedical are surgery and diagnosis.
Moreover, extensive research is conducted by market participants to identify new applications of SMPs in the biomedical industry. This has led to the development of many SMP-based medical devices such as stents, catheters, cannulas, and sutures as well as parts for pacemakers and artificial hearts.
Shape Memory Polymer Alloys replacing Traditional Materials in Healthcare Applications
Ongoing research related to the use of SMPs as dental foundations, splinters, and other bone structures will enhance the industry during the forecast period. With shape memory alloys replacing traditional materials in healthcare applications, this will increment the shape memory polymer market growth over the forecast period.
By material, polyurethane (PU) is the material of choice in shape memory polymer market and it has 40% revenue in shape polymer market by 2035 owing to its supreme properties. Polyurethane is home to several robust features which include good electrical properties. PU based SMPs are ideally deployed in aerospace & biomedical industries and in sensor systems. Furthermore, the R&D efforts in the end-user industries coupled with the beneficial properties of the product will be impactful in driving the industry to high growth.
The global healthcare sector is flourishing rapidly with increasing investments in evolving medical facilities in developing & low-income economies. This will automatically stake rising claim in shape memory polymer market.
Shape Memory Polymer Market spearheading growth in Biomedical Industry
Catheters manufactured with the help of SMPs remain stiff externally, which benefits the physician in plenty, by providing the accuracy to manipulate the tubes, hence its growth is well tabulated.
The global catheter market is also expected to grow gradually, supporting product demand. Further, these are used to fabricate surgical sutures that are used to join tissues or close a wound due to injury or surgery. Economic growth in the poor & middle-income countries coupled with improving healthcare facilities will drive the surgical sutures demand, in turn driving growth in shape memory polymer market.
The properties supporting growth of shape memory polymer market includes favourable mechanical and chemical properties, flame retardation, excellent insulation together coupled with high dielectric strength.
Research & Development to widen Growth Opportunities in the Long-Run
By application, shape memory polymers for research & development applications is expected to emerge as the dominant category, likely gather over USD 6643 Billion by 6643036643. Some research & development applications include exploring various aspects of the shape memory effect, improving SMP material properties, and generating new product ideas and discovering applications.
Manufacturers, research laboratories, and universities are at the forefront of shape memory polymer R&D programs. Many shape memory polymer R&D activities are related to biomedical applications.
Shape Memory Polymers uptake to be significant in the Automotive Industry
According to Future Market Insights, the automotive industry is expected to generate major revenue streams for shape memory polymer manufacturers. The segment is expected to witness a growth rate exceeding 66431% CAGR over the forecast period.
Shape memory polymers are used for manufacturing actuators, sensors, seat assemblies, energy absorbing assemblies, reconfigurable storage bins, tunable vehicle structures, releasable fastener systems, hood assemblies, adaptive lens assemblies, airflow control devices, and morphable automotive body molding. Furthermore, shape memory polymers are effective substitutes for other metallic and polymer components, owing to its lightweight characteristics and low cost.
Polyurethane Shape Memory Polymers to see Maximum Light of the Day
Based on material, polyurethane shape memory polymers are anticipated to experience maximum sales, clocking a value CAGR worth 66434% from 6643066436643 to 6643036643. As of 6643066436643, the segment is forecast to accumulate 38% market revenue. Polyurethane has a high load-bearing capacity, extensive hardness, good abrasion, flexibility, tear resistance, and impact resistance.
Furthermore, it offers high resistance to oil, water, grease, and harsh environments. It also has good electrical properties. Furthermore,polyurethane can be manufactured economically with shorter production & lead time. PU-based SMPs are used in structures that are deployable in the aerospace & biomedical industries and also used in building sensor systems.
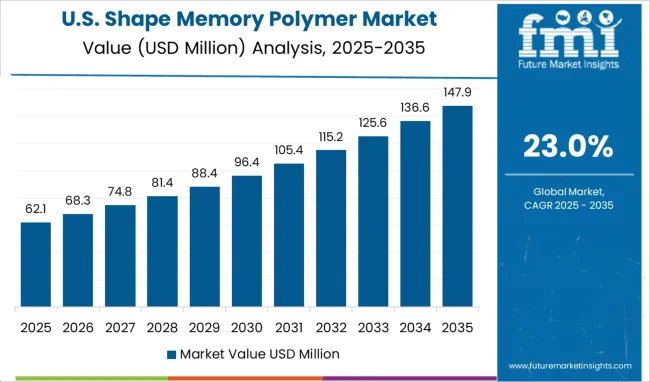
Expansion of Healthcare Infrastructure and Biomedical Research increasing SMP adoption across North America
North America is expected to emerge as a major shape memory polymer industry hub, characterized by the presence of several key end-users and product manufacturers. Besides, presence of a proliferating healthcare industry in the USA, accompanied by growing research in the biomedical field will enhance demand during the forecast period. The introduction of various regulations and programs, such as NAFTA and USMCA, have also contributed to the development of various industries in the region.
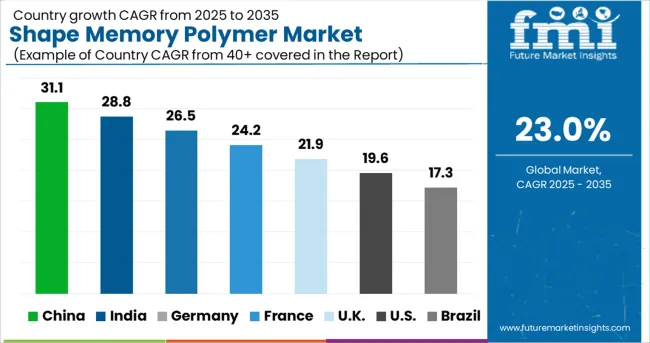
Growth in the USA aerospace & defense sector will further propel the shape memory polymer market growth during the forecast period. The presence of aircraft manufacturers including Lockheed Martin and Boeing in the USA will drive the need for SMPs. NASA's spacecraft exploratory quests are also expected to improve SMP's need for aerospace during the forecast period. According to Future Market Insights, the North American shape memory polymer market is expected to surge at a 26% value CAGR from 2025 to 2035.
Multiple End Use Applications opening frontiers for Investments
The Latin America shape memory polymer market will observe over 10% CAGR through 2035 driven by a steadfast rise in the automotive production rates of Brazil and Mexico. Mexico is turning into a nerve centre for contract manufacturing activities for the premier automotive manufacturers across the globe.
Brazil has also witnessed stable production growth in the automotive industry for the last couple of years. The biomedical industry development in the Latin American region is also likely to increase the SMP market. Increase of commercialization prices of SMP products by the end of the forecast period will have a positive effect on the Latin American market.
As per Future Market Insights, the Asia Pacific shape memory polymer industry is poised to attract a valuation of about USD 6643 Million by the end of 2035. On account of soaring income levels of consumers and rapid economic growth, automotive ownership is on the incline. Hence, shape memory polymers for manufacturing various automotive parts and components is rising significantly across the region.
Furthermore, due to the strong presence of automotive giants attributed to soaring consumer passion for fast cars in the Asia Pacific, the SMP industry is projected to exhibit considerable progress. Furthermore, increased funding in Southeast Asian countries, including India, China, Indonesia, Thailand, South Korea, Japan, and Malaysia, is foreseen to drive market growth in the aerospace industry.
Given their high degree of flexibility, shape memory polymers are finding extensive applications across a wide range of industries. From healthcare to automotive, numerous shape memory polymer start-ups are taking root across multiple regions. Some of these players are as follows:
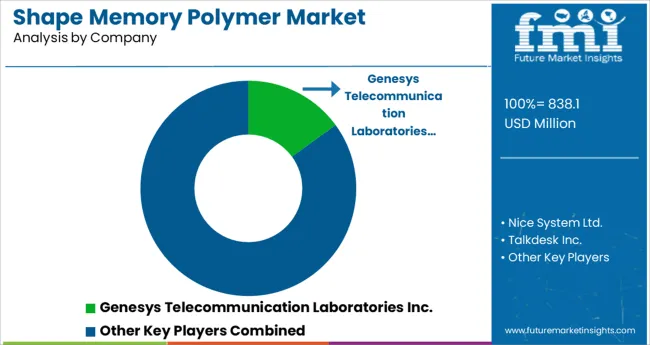
Who are the leading players in the Shape Memory Polymer Market?
The shape memory polymer industry players include Nanoshel LLC, Asahi Kasei Corporation, The Lubrizol Corporation, Cornerstone Research Group (CRG), MedShape, Inc., and Covestro AG, among others.
| Report Attribute | Details |
|---|---|
| Growth Rate | CAGR of 23% from 2025-2035 |
| Market Value in 2025 | USD 838.1 million |
| Market Value in 2035 | USD 6643.0 million |
| Base Year for Estimation | 2024 |
| Historical Data | 2020 to 2024 |
| Forecast Period | 2025 to 2035 |
| Quantitative Units | Revenue in million and CAGR from 2025-2035 |
| Report Coverage | Revenue Forecast, Company Ranking, Competitive Landscape, Growth Factors, Trends and Pricing Analysis |
| Segments Covered | Material, Application, Region |
| Regions Covered | North America; Latin America; Europe; Asia Pacific; Middle East and Africa |
| Key Countries Profiled | USA, Canada, Brazil, Mexico, Germany, UK, France, Spain, Italy, China, Japan, South Korea, Malaysia, Singapore, Australia, New Zealand, GCC, South Africa, Israel |
| Key Companies Profiled | Nanoshell LLC; Asahi Kasei Corporation; Lubrizol Corporation; Cornerstone Research Group; MedShape Inc.; Covestro AG |
The global shape memory polymer market is estimated to be valued at USD 838.1 million in 2025.
It is projected to reach USD 6,643.0 million by 2035.
The market is expected to grow at a 23.0% CAGR between 2025 and 2035.
The key product types are polyurethane (pu) shape memory polymer, polyvinyl chloride (pvc) shape memory polymer, acrylic shape memory polymer, epoxy shape memory polymer and other shape memory polymer material.
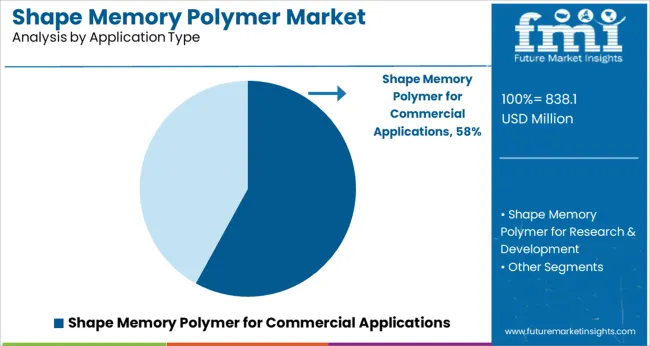
shape memory polymer for commercial applications segment is expected to dominate with a 58.0% industry share in 2025.


Full Research Suite comprises of:
Market outlook & trends analysis
Interviews & case studies
Strategic recommendations
Vendor profiles & capabilities analysis
5-year forecasts
8 regions and 60+ country-level data splits
Market segment data splits
12 months of continuous data updates
DELIVERED AS:
PDF EXCEL ONLINE
Shaped Corrugated Packaging Market Size and Share Forecast Outlook 2025 to 2035
Leading Providers & Market Share in Shaped Corrugated Packaging
Shape Memory Alloy Market Size and Share Forecast Outlook 2025 to 2035
India Shape Memory Alloy Market Analysis by Material Type, Component Type, Application, End Use Industry, and Region Forecast Through 2025 to 2035
Adaptive Shapewear Market Size and Share Forecast Outlook 2025 to 2035
Direct-to-Shape Inkjet Printer Market Size, Growth, and Forecast 2025 to 2035
Assessing Direct-to-shape Inkjet Printer Market Share & Industry Trends
Stainless Steel Bars and Bar Size Shapes Market Size and Share Forecast Outlook 2025 to 2035
Cold Finished Iron and Steel Bars and Bar Size Shapes Market Size and Share Forecast Outlook 2025 to 2035
Memory Protection System Market Size and Share Forecast Outlook 2025 to 2035
Memory Support Supplement Market Size and Share Forecast Outlook 2025 to 2035
Memory-Enhancing Drugs Market Size and Share Forecast Outlook 2025 to 2035
Memory Integrated Circuits (IC) Market Growth - Trends & Forecast 2025 to 2035
In-Memory Database Market Size and Share Forecast Outlook 2025 to 2035
In-Memory Analytics Tools Market Growth - Trends & Forecast through 2034
Hybrid Memory Cube Market Size and Share Forecast Outlook 2025 to 2035
Polymer Memory Market Size and Share Forecast Outlook 2025 to 2035
3D NAND Flash Memory Market Size and Share Forecast Outlook 2025 to 2035
Semiconductor Memory Market Size and Share Forecast Outlook 2025 to 2035
Static Random Access Memory (SRAM) Market Size and Share Forecast Outlook 2025 to 2035

Thank you!
You will receive an email from our Business Development Manager. Please be sure to check your SPAM/JUNK folder too.
Chat With
MaRIA