Micro Guide Catheter Market Size and Share Forecast Outlook 2025 to 2035

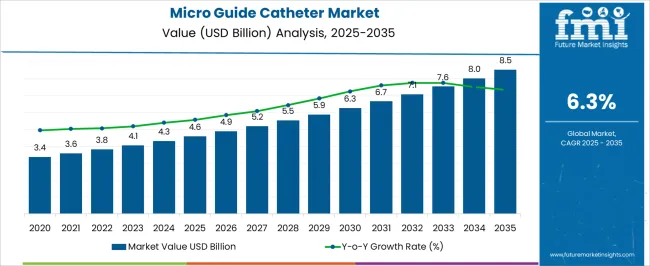
The Micro Guide Catheter Market is estimated to be valued at USD 4.6 billion in 2025 and is projected to reach USD 8.5 billion by 2035, registering a compound annual growth rate (CAGR) of 6.3% over the forecast period.
Quick Stats for Micro Guide Catheter Market

  • Micro Guide Catheter Market Industry Value (2025): USD 4.6 billion
  • Micro Guide Catheter Market Forecast Value (2035): USD 8.5 billion
  • Micro Guide Catheter Market Forecast CAGR: 6.3%
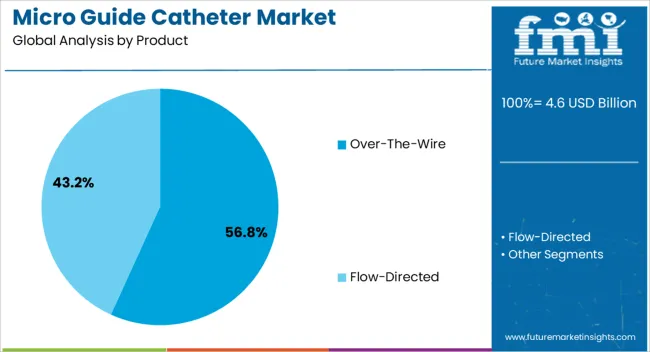
  • Leading Segment in Micro Guide Catheter Market in 2025: Over-The-Wire (56.8%)
  • Key Growth Region in Micro Guide Catheter Market: North America, Asia-Pacific, Europe
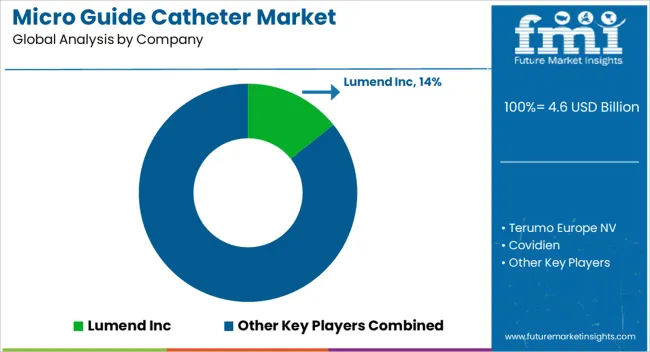
  • Top Key Players in Micro Guide Catheter Market: Lumend Inc, Terumo Europe NV, Covidien, Asahi Intecc Co Ltd, Lake Region Manufacturing Inc., Boston Scientific Corporation, Volcano Corporation, Micro Therapeutics Inc.

Micro Guide Catheter Market Market Value Analysis

Metric Value
Micro Guide Catheter Market Estimated Value in (2025 E) USD 4.6 billion
Micro Guide Catheter Market Forecast Value in (2035 F) USD 8.5 billion
Forecast CAGR (2025 to 2035) 6.3%

Rationale for Segmental Growth in the Micro Guide Catheter Market

The micro guide catheter market is advancing steadily, supported by the rising prevalence of cardiovascular and neurovascular disorders and the increasing adoption of minimally invasive procedures. Clinical studies and hospital reports have emphasized the importance of micro guide catheters in complex interventions, particularly where precision navigation through tortuous vessels is required.

Continuous product innovations, including enhanced torque response, hydrophilic coatings, and smaller profile designs, have improved procedural efficiency and broadened the scope of catheter-based interventions. Hospitals and specialty clinics are expanding their interventional cardiology and neurology capabilities, driving higher utilization of advanced catheter technologies.

Furthermore, favorable reimbursement policies and rising healthcare expenditure in emerging economies are accelerating access to these procedures. Strategic partnerships between medical device manufacturers and healthcare providers are also expanding training and adoption rates. Looking forward, the market is expected to benefit from the growing integration of digital imaging technologies with catheter navigation, alongside increasing demand for interventional procedures that minimize patient recovery time and reduce surgical risks.
Segmental Analysis

Insights into the Product Segment: Over-The-Wire

Micro Guide Catheter Market Analysis By Product

The Over-The-Wire segment is projected to account for 56.8% of the micro guide catheter market revenue in 2025, sustaining its leadership within product categories. This dominance has been shaped by the segment’s ability to provide superior control and trackability in challenging vascular anatomies.

Clinicians have preferred over-the-wire designs for their precision during device delivery, particularly in long or tortuous lesions. Continuous improvements in catheter shaft construction and coating technologies have enhanced performance by reducing friction and improving pushability.

Hospitals and interventional centers have documented high procedural success rates with over-the-wire systems, reinforcing their preference in both cardiovascular and neurovascular procedures. With consistent demand in high-volume interventions, the Over-The-Wire segment is expected to maintain its position as the most utilized product type.
Insights into the Application Segment: Cardiovascular

Micro Guide Catheter Market Analysis By Application

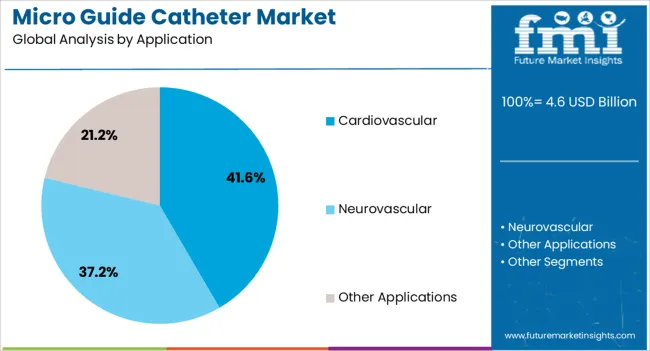
The Cardiovascular segment is projected to contribute 41.6% of the micro guide catheter market revenue in 2025, reflecting its critical role in coronary and peripheral interventions. Growth in this segment has been supported by the increasing global burden of coronary artery disease and the widespread use of catheter-based revascularization techniques.

Clinical practice has favored micro guide catheters in cardiovascular procedures due to their role in crossing complex lesions, facilitating balloon angioplasty, and supporting stent delivery. Advances in catheter design have enabled smoother navigation in smaller vessels, improving procedural safety and reducing complications.

Additionally, the rising adoption of percutaneous coronary interventions and structural heart procedures has strengthened demand for micro guide catheters in cardiovascular applications. With cardiovascular disease remaining the leading cause of mortality worldwide, this segment is expected to anchor long-term market growth.
Insights into the End User Segment: Hospitals/Clinics

Micro Guide Catheter Market Analysis By End User

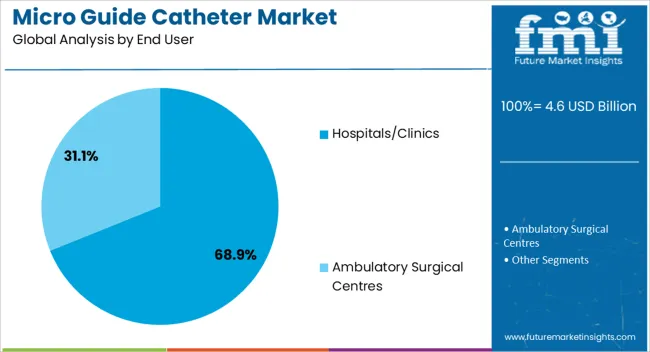
The Hospitals/Clinics segment is projected to hold 68.9% of the micro guide catheter market revenue in 2025, establishing itself as the dominant end-user category. This growth has been driven by the concentration of interventional procedures in hospital and clinical settings, where advanced infrastructure and specialized personnel are available.

Hospitals have been primary adopters due to their access to high-end imaging systems and hybrid operating suites that support complex catheter-based interventions. Annual reports and institutional disclosures have highlighted ongoing investments in cardiovascular and neurovascular departments, expanding procedural volumes.

Furthermore, hospitals and clinics have been central to clinical trials and early adoption of novel catheter technologies, reinforcing their leadership in end-user adoption. As patient demand for minimally invasive procedures continues to rise, coupled with healthcare systems strengthening interventional capabilities, the Hospitals/Clinics segment is expected to remain the principal setting for micro guide catheter utilization.

Micro Guide Catheter Trends

  • Leading micro guide catheter companies benefit from the rising fields of cardiology and radiology. This emergence of interventional techniques helps medical professionals enhance the use of micro guide catheters. The industry trend supports the micro guide catheter market growth.
  • The healthcare sector trend suggests that ambulatory surgical centers are gaining traction. The demand for medical instruments rises, which inflates the micro guide catheter market size.
  • Precautionary and preventive measures are gaining attention due to the rising consumer awareness regarding cardiovascular diseases. Also, the increasing number of cases worldwide drives the industrial demand for micro-guide catheters, fueling its progress.
  • Technological developments prevail a robust infrastructure to leading micro guide catheter companies. High-precision catheters, along with enhanced monitoring systems, are gaining traction.

Less Invasive Treatments to Push the Micro Guide Catheter Market Growth

The growing prevalence of chronic cardiovascular diseases boosted the demand for heart-related surgeries during the historical period. The pandemic outbreak played a vital role in spurring cardiovascular disorders, promoting immediate diagnosis and treatments. Consequently, this demand generator governed the micro guide catheter market growth in this period.

Attributes Values
Historical CAGR 6.6%
Valuation in 2020 USD 2.95 billion
Valuation in 2025 USD 4.06 billion

Government funding for minimally invasive surgical procedures potentially increasing demand for micro guide catheters. Due to this, diagnosis and treatment of critical issues are emphasized to resolve using such techniques. This increases the importance of micro guide catheters. Therefore, this factor will govern the forecasted period, inflating the micro guide catheter market size.

Micro Guide Catheter Market Growth Drivers

  • The growing prevalence of cardiovascular diseases will spur the demand for medical instruments. Micro guide catheters also gain traction due to the increasing demand, which fuels the micro guide catheter market size.
  • The rising demand for less invasive treatments and therapies supports the use of micro-guide catheters. Medical professionals and patients seek an alternative to traditional surgeries, which fuels the micro guide catheter market growth.
  • Due to technological developments, micro guide catheters have become safer, which helps them gain traction. Integration of imaging technologies for improved visualization during procedures will help surgeons operate better, increasing the micro guide catheter market size.
  • The growing investments in the healthcare industry fuel the micro guide catheter market growth. Also, government initiatives in the landscape will create prospects for the industry.

Micro Guide Catheter Market Challenges

  • Due to the higher costs of equipment, small-scale clinics might not be able to afford to use these catheters. This limits the target audience, affecting the micro guide catheter market size.
  • Persistent surgical complications might fluctuate their usability, affecting the micro guide catheter market growth rate.

Country-wise Analysis

The growing healthcare industry in North America will likely fuel the micro guide catheter market growth. The region will also provide a wider landscape for the leading micro guide catheter companies.

Emerging economies in the Asia-Pacific region will likely invest more in medical infrastructure, fueling the micro guide catheter market size. Technological developments in Europe help the region contribute to the better future of the industry’s competitive landscape.

Forecast CAGRs from 2025 to 2035

Countries Forecasted CAGR
The United Kingdom 5.2%
Japan 6%
China 6.4%
India 6.8%
The United States of America 6.9%

Technology to Assist the Micro Guide Catheter Market Growth in the United Kingdom

With the growing technological infrastructure, the United Kingdom will help leading micro-guide catheter manufacturers innovate. The healthcare sector will likely use cutting-edge manufacturing practices for medical instruments.

The precision and accuracy of micro guide catheters will likely spur, driving their demand in the competitive landscape. This factor elevates the micro guide catheter market size in the United Kingdom at a moderate CAGR of 5.2%.

Japan’s Healthcare Infrastructure Fuels the Micro Guide Catheter Market Size

Japan’s micro guide catheter market growth is set to advance moderately at 6%. With the investments of large-scale organizations, the healthcare infrastructure in Japan will likely spur. Also, governmental support for these developments will accelerate the progress.

These advancements create various prospects for micro guide catheter use. As a result, the diversity of these instruments spikes, driving their demand with the enlargement in the micro guide catheter market size.

Changing Lifestyle Drives the Micro Guide Catheter Market Growth in China

Due to the rapid rate of urbanization, the population in the country will likely face various lifestyle changes. The increased speed of life will increase pressure on an individual, which might induce more cardiovascular issues.

The growing demand for convenience food will also add to the driving force. This will fuel the landscape’s attractiveness. These factors will enhance the micro guide catheter market size in China, which will likely register a CAGR of 6.4%.

India’s Healthcare Expenditure to Fuel the Micro Guide Catheter Market Size

The micro guide catheter market growth in India will likely occur at 6.8% through 2035. The rising general awareness about cardiovascular diseases and the growing attention to the healthcare department in India will generate better prospects.

The government has increased healthcare expenditure, especially after COVID-19, which will likely increase in the forecasted period. This generates prospects for leading micro guide catheter companies.

Cardiovascular Diseases Spur the Micro Guide Catheter Market Growth in the United States

The rising prevalence of chronic cardiovascular diseases is spurring in the United States. The country registers the highest number of patients affected due to heart-related disorders.

The advanced technological infrastructure helps leading micro guide catheter companies innovate and develop cutting-edge practices. These factors generate demand for interventional cardiology, spurring the need for micro-guide catheters. Therefore, the United States will be the largest industry, promising the fastest micro guide catheter market size enlargement at a CAGR of 6.9%.

Category-wise Insights

Over-the-wire and cardiovascular intervention segments vastly govern the said sector. With the rising demand for accurate and less invasive treatments, these segments are gaining traction.

Category Product type- Over-the-Wire
Industry Share in 2025 56.8%
Segment Drivers
  • Due to the elevated safety provided by over-the-wires, inclination toward the category is growing.
  • Navigating through internal body parts of a human body is simplified, enhancing the precision of medical surgeries.
  • The growing demand for endoscopies fuels the micro guide catheter market size.
Category By Application- Cardiovascular Interventions
Industry Share in 2025 41.6%
Segment Drivers
  • The rising demand for less invasive and painful surgeries drives the demand for the segment.
  • With the accurate treatment for acute myocardial infarction, the technique has gained traction, fueling the micro guide catheter market size.

Competitive Landscape of the Micro Guide Catheter Industry

Micro Guide Catheter Market Analysis By Company

With the help of various key industry expansion modes, including collaborations, partnerships, mergers, and acquisitions, businesses can gain a significant edge in the competitive landscape.

Leading micro guide catheter companies use these tactics to gain more space in the ecosystem. Strategies for new entrants to gain market share include developing innovation expertise, which will differentiate the product portfolio.

Strong tie-ups with suppliers and distributors will help them achieve a sustainable competitive edge. This collective ecosystem fuels the micro guide catheter market size.

Recent Industrial Developments

  • In July 2025, ASAHI INTECC Company Limited was merged with Toyoflex Corporation. This strategic development was a key milestone as it helped the firm diversify its assets and resources. Not only did the production capacity of the business increase but its reach also enhanced.
  • In November 2025, Terumo Europe N.V. expanded globally via its new South African subsidiary. The business aimed to generate a strong global presence, which was achieved through the strategic move. The strategic position of the organization was also bolstered due to this initiative.

Report Scope

Attributes Details
Estimated Size in 2025 USD 4.6 billion
Projected Valuation in 2035 USD 8.5 billion
Value-based CAGR 2025 to 2035 6.3%
Forecast Period 2025 to 2035
Historical Data Available for 2020 to 2025
Analysis in- Value in USD billion
Key Regions Covered

North America; Latin America; Western Europe; Eastern Europe; South Asia and Pacific; East Asia; The Middle East and Africa

Key Segments Covered

Product, Application, End User, Region

Key Countries Profiled

The United States, Canada, Brazil, Mexico, Germany, The United Kingdom, France, Spain, Italy, Poland, Russia, Czech Republic, Romania, India, Bangladesh, Australia, New Zealand, China, Japan, South Korea, GCC Countries, South Africa, Israel

Key Companies Profiled

LuMend Corporation; Terumo Europe N.V.; Covidien AG; ASAHI INTECC Company Limited; Lake Region Manufacturing Inc.; Boston Scientific Corporation; Volcano Corporation; Micro Therapeutics Inc.

Micro Guide Catheter Industry - Key Segments

By Product:

The market is segmented as over-the-wire and flow-directed micro guide catheters.

By Application:

The study on micro guide catheters by application include cardiovascular, neurovascular, and other applications.

By End User:

Analysis of micro guide catheter sales in hospitals/clinics and ambulatory surgical centres.

By Region:

Demand for micro guide catheters is studies in key countries across North America, Latin America, Western Europe, Eastern Europe, South Asia and Pacific, East Asia and the Middle East and Africa

Frequently Asked Questions

How big is the micro guide catheter market in 2025?

The global micro guide catheter market is estimated to be valued at USD 4.6 billion in 2025.

What will be the size of micro guide catheter market in 2035?

The market size for the micro guide catheter market is projected to reach USD 8.5 billion by 2035.

How much will be the micro guide catheter market growth between 2025 and 2035?

The micro guide catheter market is expected to grow at a 6.3% CAGR between 2025 and 2035.

What are the key product types in the micro guide catheter market?

The key product types in micro guide catheter market are over-the-wire and flow-directed.

Which application segment to contribute significant share in the micro guide catheter market in 2025?

In terms of application, cardiovascular segment to command 41.6% share in the micro guide catheter market in 2025.

Table of Content

  1. Executive Summary
    • Global Market Outlook
    • Demand-side Trends
    • Supply-side Trends
    • Technology Roadmap Analysis
    • Analysis and Recommendations
  2. Market Overview
    • Market Coverage / Taxonomy
    • Market Definition / Scope / Limitations
  3. Market Background
    • Market Dynamics
      • Drivers
      • Restraints
      • Opportunity
      • Trends
    • Scenario Forecast
      • Demand in Optimistic Scenario
      • Demand in Likely Scenario
      • Demand in Conservative Scenario
    • Opportunity Map Analysis
    • Product Life Cycle Analysis
    • Supply Chain Analysis
    • Investment Feasibility Matrix
    • Value Chain Analysis
    • PESTLE and Porter’s Analysis
    • Regulatory Landscape
    • Regional Parent Market Outlook
    • Production and Consumption Statistics
    • Import and Export Statistics
  4. Global Market Analysis 2020 to 2024 and Forecast, 2025 to 2035
    • Historical Market Size Value (USD Million) Analysis, 2020 to 2024
    • Current and Future Market Size Value (USD Million) Projections, 2025 to 2035
      • Y-o-Y Growth Trend Analysis
      • Absolute $ Opportunity Analysis
  5. Global Market Pricing Analysis 2020 to 2024 and Forecast 2025 to 2035
  6. Global Market Analysis 2020 to 2024 and Forecast 2025 to 2035, By Product
    • Introduction / Key Findings
    • Historical Market Size Value (USD Million) Analysis By Product , 2020 to 2024
    • Current and Future Market Size Value (USD Million) Analysis and Forecast By Product , 2025 to 2035
      • Over-The-Wire
      • Flow-Directed
    • Y-o-Y Growth Trend Analysis By Product , 2020 to 2024
    • Absolute $ Opportunity Analysis By Product , 2025 to 2035
  7. Global Market Analysis 2020 to 2024 and Forecast 2025 to 2035, By Application
    • Introduction / Key Findings
    • Historical Market Size Value (USD Million) Analysis By Application, 2020 to 2024
    • Current and Future Market Size Value (USD Million) Analysis and Forecast By Application, 2025 to 2035
      • Cardiovascular
      • Neurovascular
      • Other Applications
    • Y-o-Y Growth Trend Analysis By Application, 2020 to 2024
    • Absolute $ Opportunity Analysis By Application, 2025 to 2035
  8. Global Market Analysis 2020 to 2024 and Forecast 2025 to 2035, By End User
    • Introduction / Key Findings
    • Historical Market Size Value (USD Million) Analysis By End User, 2020 to 2024
    • Current and Future Market Size Value (USD Million) Analysis and Forecast By End User, 2025 to 2035
      • Hospitals/Clinics
      • Ambulatory Surgical Centres
    • Y-o-Y Growth Trend Analysis By End User, 2020 to 2024
    • Absolute $ Opportunity Analysis By End User, 2025 to 2035
  9. Global Market Analysis 2020 to 2024 and Forecast 2025 to 2035, By Region
    • Introduction
    • Historical Market Size Value (USD Million) Analysis By Region, 2020 to 2024
    • Current Market Size Value (USD Million) Analysis and Forecast By Region, 2025 to 2035
      • North America
      • Latin America
      • Western Europe
      • Eastern Europe
      • East Asia
      • South Asia and Pacific
      • Middle East & Africa
    • Market Attractiveness Analysis By Region
  10. North America Market Analysis 2020 to 2024 and Forecast 2025 to 2035, By Country
    • Historical Market Size Value (USD Million) Trend Analysis By Market Taxonomy, 2020 to 2024
    • Market Size Value (USD Million) Forecast By Market Taxonomy, 2025 to 2035
      • By Country
        • USA
        • Canada
        • Mexico
      • By Product
      • By Application
      • By End User
    • Market Attractiveness Analysis
      • By Country
      • By Product
      • By Application
      • By End User
    • Key Takeaways
  11. Latin America Market Analysis 2020 to 2024 and Forecast 2025 to 2035, By Country
    • Historical Market Size Value (USD Million) Trend Analysis By Market Taxonomy, 2020 to 2024
    • Market Size Value (USD Million) Forecast By Market Taxonomy, 2025 to 2035
      • By Country
        • Brazil
        • Chile
        • Rest of Latin America
      • By Product
      • By Application
      • By End User
    • Market Attractiveness Analysis
      • By Country
      • By Product
      • By Application
      • By End User
    • Key Takeaways
  12. Western Europe Market Analysis 2020 to 2024 and Forecast 2025 to 2035, By Country
    • Historical Market Size Value (USD Million) Trend Analysis By Market Taxonomy, 2020 to 2024
    • Market Size Value (USD Million) Forecast By Market Taxonomy, 2025 to 2035
      • By Country
        • Germany
        • UK
        • Italy
        • Spain
        • France
        • Nordic
        • BENELUX
        • Rest of Western Europe
      • By Product
      • By Application
      • By End User
    • Market Attractiveness Analysis
      • By Country
      • By Product
      • By Application
      • By End User
    • Key Takeaways
  13. Eastern Europe Market Analysis 2020 to 2024 and Forecast 2025 to 2035, By Country
    • Historical Market Size Value (USD Million) Trend Analysis By Market Taxonomy, 2020 to 2024
    • Market Size Value (USD Million) Forecast By Market Taxonomy, 2025 to 2035
      • By Country
        • Russia
        • Poland
        • Hungary
        • Balkan & Baltic
        • Rest of Eastern Europe
      • By Product
      • By Application
      • By End User
    • Market Attractiveness Analysis
      • By Country
      • By Product
      • By Application
      • By End User
    • Key Takeaways
  14. East Asia Market Analysis 2020 to 2024 and Forecast 2025 to 2035, By Country
    • Historical Market Size Value (USD Million) Trend Analysis By Market Taxonomy, 2020 to 2024
    • Market Size Value (USD Million) Forecast By Market Taxonomy, 2025 to 2035
      • By Country
        • China
        • Japan
        • South Korea
      • By Product
      • By Application
      • By End User
    • Market Attractiveness Analysis
      • By Country
      • By Product
      • By Application
      • By End User
    • Key Takeaways
  15. South Asia and Pacific Market Analysis 2020 to 2024 and Forecast 2025 to 2035, By Country
    • Historical Market Size Value (USD Million) Trend Analysis By Market Taxonomy, 2020 to 2024
    • Market Size Value (USD Million) Forecast By Market Taxonomy, 2025 to 2035
      • By Country
        • India
        • ASEAN
        • Australia & New Zealand
        • Rest of South Asia and Pacific
      • By Product
      • By Application
      • By End User
    • Market Attractiveness Analysis
      • By Country
      • By Product
      • By Application
      • By End User
    • Key Takeaways
  16. Middle East & Africa Market Analysis 2020 to 2024 and Forecast 2025 to 2035, By Country
    • Historical Market Size Value (USD Million) Trend Analysis By Market Taxonomy, 2020 to 2024
    • Market Size Value (USD Million) Forecast By Market Taxonomy, 2025 to 2035
      • By Country
        • Kingdom of Saudi Arabia
        • Other GCC Countries
        • Turkiye
        • South Africa
        • Other African Union
        • Rest of Middle East & Africa
      • By Product
      • By Application
      • By End User
    • Market Attractiveness Analysis
      • By Country
      • By Product
      • By Application
      • By End User
    • Key Takeaways
  17. Key Countries Market Analysis
    • USA
      • Pricing Analysis
      • Market Share Analysis, 2024
        • By Product
        • By Application
        • By End User
    • Canada
      • Pricing Analysis
      • Market Share Analysis, 2024
        • By Product
        • By Application
        • By End User
    • Mexico
      • Pricing Analysis
      • Market Share Analysis, 2024
        • By Product
        • By Application
        • By End User
    • Brazil
      • Pricing Analysis
      • Market Share Analysis, 2024
        • By Product
        • By Application
        • By End User
    • Chile
      • Pricing Analysis
      • Market Share Analysis, 2024
        • By Product
        • By Application
        • By End User
    • Germany
      • Pricing Analysis
      • Market Share Analysis, 2024
        • By Product
        • By Application
        • By End User
    • UK
      • Pricing Analysis
      • Market Share Analysis, 2024
        • By Product
        • By Application
        • By End User
    • Italy
      • Pricing Analysis
      • Market Share Analysis, 2024
        • By Product
        • By Application
        • By End User
    • Spain
      • Pricing Analysis
      • Market Share Analysis, 2024
        • By Product
        • By Application
        • By End User
    • France
      • Pricing Analysis
      • Market Share Analysis, 2024
        • By Product
        • By Application
        • By End User
    • India
      • Pricing Analysis
      • Market Share Analysis, 2024
        • By Product
        • By Application
        • By End User
    • ASEAN
      • Pricing Analysis
      • Market Share Analysis, 2024
        • By Product
        • By Application
        • By End User
    • Australia & New Zealand
      • Pricing Analysis
      • Market Share Analysis, 2024
        • By Product
        • By Application
        • By End User
    • China
      • Pricing Analysis
      • Market Share Analysis, 2024
        • By Product
        • By Application
        • By End User
    • Japan
      • Pricing Analysis
      • Market Share Analysis, 2024
        • By Product
        • By Application
        • By End User
    • South Korea
      • Pricing Analysis
      • Market Share Analysis, 2024
        • By Product
        • By Application
        • By End User
    • Russia
      • Pricing Analysis
      • Market Share Analysis, 2024
        • By Product
        • By Application
        • By End User
    • Poland
      • Pricing Analysis
      • Market Share Analysis, 2024
        • By Product
        • By Application
        • By End User
    • Hungary
      • Pricing Analysis
      • Market Share Analysis, 2024
        • By Product
        • By Application
        • By End User
    • Kingdom of Saudi Arabia
      • Pricing Analysis
      • Market Share Analysis, 2024
        • By Product
        • By Application
        • By End User
    • Turkiye
      • Pricing Analysis
      • Market Share Analysis, 2024
        • By Product
        • By Application
        • By End User
    • South Africa
      • Pricing Analysis
      • Market Share Analysis, 2024
        • By Product
        • By Application
        • By End User
  18. Market Structure Analysis
    • Competition Dashboard
    • Competition Benchmarking
    • Market Share Analysis of Top Players
      • By Regional
      • By Product
      • By Application
      • By End User
  19. Competition Analysis
    • Competition Deep Dive
      • Lumend Inc
        • Overview
        • Product Portfolio
        • Profitability by Market Segments (Product/Age /Sales Channel/Region)
        • Sales Footprint
        • Strategy Overview
          • Marketing Strategy
          • Product Strategy
          • Channel Strategy
      • Terumo Europe NV
      • Covidien
      • Asahi Intecc Co Ltd
      • Lake Region Manufacturing Inc.
      • Boston Scientific Corporation
      • Volcano Corporation
      • Micro Therapeutics Inc.
  20. Assumptions & Acronyms Used
  21. Research Methodology

List of Tables

  • Table 1: Global Market Value (USD Million) Forecast by Region, 2020-2035
  • Table 2: Global Market Value (USD Million) Forecast by Product , 2020-2035
  • Table 3: Global Market Value (USD Million) Forecast by Application, 2020-2035
  • Table 4: Global Market Value (USD Million) Forecast by End User, 2020-2035
  • Table 5: North America Market Value (USD Million) Forecast by Country, 2020-2035
  • Table 6: North America Market Value (USD Million) Forecast by Product , 2020-2035
  • Table 7: North America Market Value (USD Million) Forecast by Application, 2020-2035
  • Table 8: North America Market Value (USD Million) Forecast by End User, 2020-2035
  • Table 9: Latin America Market Value (USD Million) Forecast by Country, 2020-2035
  • Table 10: Latin America Market Value (USD Million) Forecast by Product , 2020-2035
  • Table 11: Latin America Market Value (USD Million) Forecast by Application, 2020-2035
  • Table 12: Latin America Market Value (USD Million) Forecast by End User, 2020-2035
  • Table 13: Western Europe Market Value (USD Million) Forecast by Country, 2020-2035
  • Table 14: Western Europe Market Value (USD Million) Forecast by Product , 2020-2035
  • Table 15: Western Europe Market Value (USD Million) Forecast by Application, 2020-2035
  • Table 16: Western Europe Market Value (USD Million) Forecast by End User, 2020-2035
  • Table 17: Eastern Europe Market Value (USD Million) Forecast by Country, 2020-2035
  • Table 18: Eastern Europe Market Value (USD Million) Forecast by Product , 2020-2035
  • Table 19: Eastern Europe Market Value (USD Million) Forecast by Application, 2020-2035
  • Table 20: Eastern Europe Market Value (USD Million) Forecast by End User, 2020-2035
  • Table 21: East Asia Market Value (USD Million) Forecast by Country, 2020-2035
  • Table 22: East Asia Market Value (USD Million) Forecast by Product , 2020-2035
  • Table 23: East Asia Market Value (USD Million) Forecast by Application, 2020-2035
  • Table 24: East Asia Market Value (USD Million) Forecast by End User, 2020-2035
  • Table 25: South Asia and Pacific Market Value (USD Million) Forecast by Country, 2020-2035
  • Table 26: South Asia and Pacific Market Value (USD Million) Forecast by Product , 2020-2035
  • Table 27: South Asia and Pacific Market Value (USD Million) Forecast by Application, 2020-2035
  • Table 28: South Asia and Pacific Market Value (USD Million) Forecast by End User, 2020-2035
  • Table 29: Middle East & Africa Market Value (USD Million) Forecast by Country, 2020-2035
  • Table 30: Middle East & Africa Market Value (USD Million) Forecast by Product , 2020-2035
  • Table 31: Middle East & Africa Market Value (USD Million) Forecast by Application, 2020-2035
  • Table 32: Middle East & Africa Market Value (USD Million) Forecast by End User, 2020-2035

List of Figures

  • Figure 1: Global Market Pricing Analysis
  • Figure 2: Global Market Value (USD Million) Forecast 2020-2035
  • Figure 3: Global Market Value Share and BPS Analysis by Product , 2025 and 2035
  • Figure 4: Global Market Y-o-Y Growth Comparison by Product , 2025-2035
  • Figure 5: Global Market Attractiveness Analysis by Product
  • Figure 6: Global Market Value Share and BPS Analysis by Application, 2025 and 2035
  • Figure 7: Global Market Y-o-Y Growth Comparison by Application, 2025-2035
  • Figure 8: Global Market Attractiveness Analysis by Application
  • Figure 9: Global Market Value Share and BPS Analysis by End User, 2025 and 2035
  • Figure 10: Global Market Y-o-Y Growth Comparison by End User, 2025-2035
  • Figure 11: Global Market Attractiveness Analysis by End User
  • Figure 12: Global Market Value (USD Million) Share and BPS Analysis by Region, 2025 and 2035
  • Figure 13: Global Market Y-o-Y Growth Comparison by Region, 2025-2035
  • Figure 14: Global Market Attractiveness Analysis by Region
  • Figure 15: North America Market Incremental Dollar Opportunity, 2025-2035
  • Figure 16: Latin America Market Incremental Dollar Opportunity, 2025-2035
  • Figure 17: Western Europe Market Incremental Dollar Opportunity, 2025-2035
  • Figure 18: Eastern Europe Market Incremental Dollar Opportunity, 2025-2035
  • Figure 19: East Asia Market Incremental Dollar Opportunity, 2025-2035
  • Figure 20: South Asia and Pacific Market Incremental Dollar Opportunity, 2025-2035
  • Figure 21: Middle East & Africa Market Incremental Dollar Opportunity, 2025-2035
  • Figure 22: North America Market Value Share and BPS Analysis by Country, 2025 and 2035
  • Figure 23: North America Market Value Share and BPS Analysis by Product , 2025 and 2035
  • Figure 24: North America Market Y-o-Y Growth Comparison by Product , 2025-2035
  • Figure 25: North America Market Attractiveness Analysis by Product
  • Figure 26: North America Market Value Share and BPS Analysis by Application, 2025 and 2035
  • Figure 27: North America Market Y-o-Y Growth Comparison by Application, 2025-2035
  • Figure 28: North America Market Attractiveness Analysis by Application
  • Figure 29: North America Market Value Share and BPS Analysis by End User, 2025 and 2035
  • Figure 30: North America Market Y-o-Y Growth Comparison by End User, 2025-2035
  • Figure 31: North America Market Attractiveness Analysis by End User
  • Figure 32: Latin America Market Value Share and BPS Analysis by Country, 2025 and 2035
  • Figure 33: Latin America Market Value Share and BPS Analysis by Product , 2025 and 2035
  • Figure 34: Latin America Market Y-o-Y Growth Comparison by Product , 2025-2035
  • Figure 35: Latin America Market Attractiveness Analysis by Product
  • Figure 36: Latin America Market Value Share and BPS Analysis by Application, 2025 and 2035
  • Figure 37: Latin America Market Y-o-Y Growth Comparison by Application, 2025-2035
  • Figure 38: Latin America Market Attractiveness Analysis by Application
  • Figure 39: Latin America Market Value Share and BPS Analysis by End User, 2025 and 2035
  • Figure 40: Latin America Market Y-o-Y Growth Comparison by End User, 2025-2035
  • Figure 41: Latin America Market Attractiveness Analysis by End User
  • Figure 42: Western Europe Market Value Share and BPS Analysis by Country, 2025 and 2035
  • Figure 43: Western Europe Market Value Share and BPS Analysis by Product , 2025 and 2035
  • Figure 44: Western Europe Market Y-o-Y Growth Comparison by Product , 2025-2035
  • Figure 45: Western Europe Market Attractiveness Analysis by Product
  • Figure 46: Western Europe Market Value Share and BPS Analysis by Application, 2025 and 2035
  • Figure 47: Western Europe Market Y-o-Y Growth Comparison by Application, 2025-2035
  • Figure 48: Western Europe Market Attractiveness Analysis by Application
  • Figure 49: Western Europe Market Value Share and BPS Analysis by End User, 2025 and 2035
  • Figure 50: Western Europe Market Y-o-Y Growth Comparison by End User, 2025-2035
  • Figure 51: Western Europe Market Attractiveness Analysis by End User
  • Figure 52: Eastern Europe Market Value Share and BPS Analysis by Country, 2025 and 2035
  • Figure 53: Eastern Europe Market Value Share and BPS Analysis by Product , 2025 and 2035
  • Figure 54: Eastern Europe Market Y-o-Y Growth Comparison by Product , 2025-2035
  • Figure 55: Eastern Europe Market Attractiveness Analysis by Product
  • Figure 56: Eastern Europe Market Value Share and BPS Analysis by Application, 2025 and 2035
  • Figure 57: Eastern Europe Market Y-o-Y Growth Comparison by Application, 2025-2035
  • Figure 58: Eastern Europe Market Attractiveness Analysis by Application
  • Figure 59: Eastern Europe Market Value Share and BPS Analysis by End User, 2025 and 2035
  • Figure 60: Eastern Europe Market Y-o-Y Growth Comparison by End User, 2025-2035
  • Figure 61: Eastern Europe Market Attractiveness Analysis by End User
  • Figure 62: East Asia Market Value Share and BPS Analysis by Country, 2025 and 2035
  • Figure 63: East Asia Market Value Share and BPS Analysis by Product , 2025 and 2035
  • Figure 64: East Asia Market Y-o-Y Growth Comparison by Product , 2025-2035
  • Figure 65: East Asia Market Attractiveness Analysis by Product
  • Figure 66: East Asia Market Value Share and BPS Analysis by Application, 2025 and 2035
  • Figure 67: East Asia Market Y-o-Y Growth Comparison by Application, 2025-2035
  • Figure 68: East Asia Market Attractiveness Analysis by Application
  • Figure 69: East Asia Market Value Share and BPS Analysis by End User, 2025 and 2035
  • Figure 70: East Asia Market Y-o-Y Growth Comparison by End User, 2025-2035
  • Figure 71: East Asia Market Attractiveness Analysis by End User
  • Figure 72: South Asia and Pacific Market Value Share and BPS Analysis by Country, 2025 and 2035
  • Figure 73: South Asia and Pacific Market Value Share and BPS Analysis by Product , 2025 and 2035
  • Figure 74: South Asia and Pacific Market Y-o-Y Growth Comparison by Product , 2025-2035
  • Figure 75: South Asia and Pacific Market Attractiveness Analysis by Product
  • Figure 76: South Asia and Pacific Market Value Share and BPS Analysis by Application, 2025 and 2035
  • Figure 77: South Asia and Pacific Market Y-o-Y Growth Comparison by Application, 2025-2035
  • Figure 78: South Asia and Pacific Market Attractiveness Analysis by Application
  • Figure 79: South Asia and Pacific Market Value Share and BPS Analysis by End User, 2025 and 2035
  • Figure 80: South Asia and Pacific Market Y-o-Y Growth Comparison by End User, 2025-2035
  • Figure 81: South Asia and Pacific Market Attractiveness Analysis by End User
  • Figure 82: Middle East & Africa Market Value Share and BPS Analysis by Country, 2025 and 2035
  • Figure 83: Middle East & Africa Market Value Share and BPS Analysis by Product , 2025 and 2035
  • Figure 84: Middle East & Africa Market Y-o-Y Growth Comparison by Product , 2025-2035
  • Figure 85: Middle East & Africa Market Attractiveness Analysis by Product
  • Figure 86: Middle East & Africa Market Value Share and BPS Analysis by Application, 2025 and 2035
  • Figure 87: Middle East & Africa Market Y-o-Y Growth Comparison by Application, 2025-2035
  • Figure 88: Middle East & Africa Market Attractiveness Analysis by Application
  • Figure 89: Middle East & Africa Market Value Share and BPS Analysis by End User, 2025 and 2035
  • Figure 90: Middle East & Africa Market Y-o-Y Growth Comparison by End User, 2025-2035
  • Figure 91: Middle East & Africa Market Attractiveness Analysis by End User
  • Figure 92: Global Market - Tier Structure Analysis
  • Figure 93: Global Market - Company Share Analysis
Dashboard
Dashboard
Dashboard
Dashboard
Dashboard
Dashboard

Full Research Suite comprises of:

Market outlook & trends analysis

Market outlook & trends analysis

Interviews & case studies

Interviews & case studies

Strategic recommendations

Strategic recommendations

Vendor profiles & capabilities analysis

Vendor profiles & capabilities analysis

5-year forecasts

5-year forecasts

8 regions and 60+ country-level data splits

8 regions and 60+ country-level data splits

Market segment data splits

Market segment data splits

12 months of continuous data updates

12 months of continuous data updates

DELIVERED AS:

PDF EXCEL ONLINE

Full Research Suite


$5000

$7500

$10000

Buy Report Now
Similar Industry Reports

Similar Industry Reports

Micro CHP Market
Micro CHP Market

Micro CHP Market Size and Share Forecast Outlook 2025 to 2035

Micro Irrigation System Market

Micro Irrigation System Market Size and Share Forecast Outlook 2025 to 2035

Micro Flute Paper Market

Micro Flute Paper Market Size and Share Forecast Outlook 2025 to 2035

Microcrystalline Cellulose Market

Microcrystalline Cellulose Market Size and Share Forecast Outlook 2025 to 2035

Micro Balances Market

Micro Balances Market Size and Share Forecast Outlook 2025 to 2035

Micro Perforated Films Packaging Market

Micro Perforated Films Packaging Market Size and Share Forecast Outlook 2025 to 2035

Microbial Coagulants Market

Microbial Coagulants Market Size and Share Forecast Outlook 2025 to 2035

Microserver IC Market

Microserver IC Market Size and Share Forecast Outlook 2025 to 2035

Microplate Handling Instruments Market

Microplate Handling Instruments Market Size and Share Forecast Outlook 2025 to 2035

Microsclerotherapy Treatment Market

Microsclerotherapy Treatment Market Size and Share Forecast Outlook 2025 to 2035

MicroLED Photoluminescence Inspection System Market

MicroLED Photoluminescence Inspection System Market Size and Share Forecast Outlook 2025 to 2035

Micro-Scale VFFS Modules Market

Micro-Scale VFFS Modules Market Analysis - Size and Share Forecast Outlook 2025 to 2035

Microscope Digital Camera Market

Microscope Digital Camera Market Size and Share Forecast Outlook 2025 to 2035

Micro Perforation Machines Market

Micro Perforation Machines Market Size and Share Forecast Outlook 2025 to 2035

Micro Battery Market

Micro Battery Market Size and Share Forecast Outlook 2025 to 2035

Microwave Monolithic Integrated Circuits Market

Microwave Monolithic Integrated Circuits Market Size and Share Forecast Outlook 2025 to 2035

Microhardness Testing System Market

Microhardness Testing System Market Size and Share Forecast Outlook 2025 to 2035

Microchip Electrophoresis Market

Microchip Electrophoresis Market Size and Share Forecast Outlook 2025 to 2035

Micropipette Puller Market

Micropipette Puller Market Size and Share Forecast Outlook 2025 to 2035

Microwave Cable Assemblies Market

Microwave Cable Assemblies Market Size and Share Forecast Outlook 2025 to 2035

Future Market Insights

Micro Guide Catheter Market

Chat With MaRIA

Chat With

MaRIA

Hi There, I am MaRIA, Your Market Research Intelligence Assistant. How may I help you?