Reports
- Global Locations -
Headquarters
Future Market Insights, Inc.
Christiana Corporate, 200
Continental Drive, Suite 401,
Newark, Delaware - 19713,
United States
Americas
Future Market Insights, Inc.
616 Corporate Way, Suite 2-9018,
Valley Cottage, NY 10989, United States
MEA
Future Market Insights
1602-6 Jumeirah Bay X2 Tower, Plot No: JLT-PH2-X2A,
Jumeirah Lakes Towers, Dubai,
United Arab Emirates
Europe
Future Market Insights
3rd Floor, 207 Regent Street,
W1B 3HH London
United Kingdom
Asia Pacific
Future Market Insights
Office No. 401-A, 4th Floor,
VANTAGE 9, S.No. 36/1/1,
Baner, Pune 411045, India
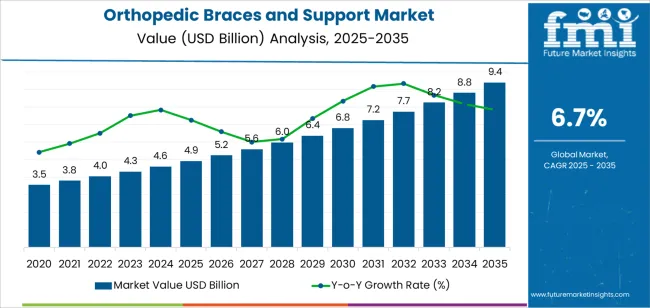
[250 Pages Report] The global orthopedic braces and support market is valued at US$ 4.09 Bn in 2022, which amounts to 38.6% share of the global fracture fixation products market. Demand for orthopedic braces and supports is predicted to increase at a CAGR of 6.9% to reach a market valuation of US$ 4.67 Bn by the end of 2024.
Attribute | Details |
---|---|
Orthopedic Braces and Support Market Size (2022) | US$ 4.09 billion |
Sales Forecast (2024) | US$ 4.67 billion |
Global Market Growth Rate (2022 to 2024) | 6.9% CAGR |
Share of Top 5 Market Players | 55% |
Don't pay for what you don't need
Customize your report by selecting specific countries or regions and save 30%!
Particulars | Details |
---|---|
H1, 2021 | 6.13% |
H1, 2022 Projected | 6.38% |
H1, 2022 Outlook | 6.18% |
BPS Change - H1, 2022 (O) – H1, 2022 (P) | (-) 20 ↓ |
BPS Change – H1, 2022 (O) – H1, 2021 | (+) 05 ↑ |
The comparative analysis and market growth rate of global orthopedic braces and support market as studied by Future Market Insights, will show a negative BPS growth in H1-2022 outlook as compared to H1-2022 projected period by 20 BPS. However, a positive BPS growth is expected in H1-2022 over H1- 2021 duration with 05 Basis Point Share (BPS).
The market for orthopedic braces and support is subject to changes as per product adoption rates and regulatory compliance, in accordance to the macro and industry dynamics. The key developments in the market include novel innovations in rehabilitative and functional orthopedic braces, such as the recent development of dynamic posterior cruciate ligament (PCL) knee braces.
The market observes a decline in the BPS values owed to the present scenario of lowered adoption of orthopedic braces and support products. This is due to reported cases of poor patient compliance, owed to the product’s weight, appearance of skin irritation upon product adoption, and the additional cost of physical therapy following regular treatment regime.
However, with the advancements in 3D printing and manufacturing, development of personalized orthopedic braces and support products will provide individual customization for the patient, thus increasing compliance rate, hence promoting treatment outcomes. Owed to novel advancements in manufacturing and production, the market is set to witness a positive outlook towards growth during the forecast period.
“Increasing Global Prevalence of Orthopedic Disorders Driving Market Growth”
From 2014 to 2021, the global market for orthopedic braces and supports experienced a CAGR of around 6.4%.
Given their better clinical efficacy and rapid recovery compared to conventional therapies such as pain medications, orthopedic braces and supports are increasingly gaining traction during clinical management of several orthopedic disorders including, rheumatoid arthritis (RA), osteoarthritis (OA), carpal tunnel syndrome, and osteoporotic fractures.
Arthritis is more prevalent among people who have chronic conditions such as diabetes, cardiovascular diseases (CVD), and obesity. Incidences of orthopedic disorders are projected to swell further over the years ahead with the rising prevalence of obesity and related lifestyle diseases, as obese people are at a higher risk of orthopedic and musculoskeletal injuries, as well as diabetes.
Moreover, rising cases of sport-related injuries have also become a leading cause of osteoarthritis. Health-conscious individuals are continuously engaging in fitness-related pursuits, which can result in muscle pain, thus spurring the demand for orthopedic braces and supports.
The global orthopedic braces and support market is anticipated to rise at a 6.9% CAGR from 2022 to 2024.
“Continuous Innovation in Products for Better Patient Comfort”
The healthcare industry is increasingly shifting towards more patient-centric and participatory health, and that is likely to drive several companies to incorporate connected on-demand and data-enabled patient engagement solutions.
The shift towards participatory medicine is transforming the cornerstone of healthcare infrastructure, from a supply-side push of services to consumers to one where the pull of patient demand defines activity and value.
Following this trend, market players such as DJO have developed X-ROM™ Post-Op Knee Brace. Equipped with the company’s most advanced range of motion (ROM) protection and better user-centric design for swifter and simpler adoption and adjustment, the X-ROM™ brace aids patients in recovering from ACL and other knee surgeries with better stability and convenience.
Key players rethinking the next-gen care model with meaningful engagement in healthcare delivery including integration of patients’ care journey are witnessing greater returns.
“Growing Adoption of Pain Medications & Minimum Patient Qualification for Orthopedic Treatment”
Low patient awareness regarding bracing-mediated orthopedic treatment and lack of proper clinical data to support the therapeutic efficacy of orthopedic braces are expected to hamper market growth.
Frequent use of painkillers is limiting the sales of orthopedic braces and supports. For pains associated with orthopedic conditions, more people are turning to pain medications rather than using proper orthopedic products.
“Surging Adoption of Knee Braces and Supports across North America”
Rise in musculoskeletal disorders and the increasing incidence of sports-related injuries are driving the market growth in North America. With increased government guidelines for product commercialization and an increase in the number of favorable reimbursement and insurance policies, the region USD share is expected to grow over the coming years.
Increasing sales of knee braces and supports, presence of key companies, and well-established healthcare infrastructure are factors expected to drive market growth in the region.
Get the data you need at a Fraction of the cost
Personalize your report by choosing insights you need
and save 40%!
“Rapid Deployment of Advanced Therapies Driving Market Expansion”
Recent studies reveal that in the U.S., over 21 million individuals suffer from osteoarthritis and about 40 million persons are affected by arthritis, which includes over 250,000 children.
Major players are shifting their focus to 3D printing capabilities while collaborating with specialized technology firms. The U.S.;is home to a number of small and medium-sized orthopedic companies, which are encouraging global firms to invest in the U.S.;orthopedic braces and support industry.
Rising awareness regarding bracing devices, availability of advanced materials & skilled professionals, and growing demand for advanced therapies are the factors anticipated to support market growth in the U.S.
“Rising Initiatives for Orthopedic Braces and Supports Development in China”
The market in China is anticipated to showcase the highest CAGR over the forecast period, owing to the rising geriatric and obese population, the presence of advanced manufacturing facilities and smart technologies, and the increasing patient pool of osteoarthritis.
The market is expanding in China due to the rising use of ankle braces and supports, increased government initiatives to provide funds for research activities in the development of orthopedic braces and supports, and an increase in the number of hospitals with modern medical facilities.
“Lower Extremity Braces and Supports Gaining Traction Owing to their Cost-effectiveness”
Lower extremity braces and supports are expected to account 67.5% share of the orthopedic braces and support market in 2022. Rising instances of injuries in legs and knees are driving the demand for lower extremity braces and supports.
Adoption of lower extremity braces and supports is increasing, attributable to umpteen benefits they offered - reduced knee rotation, lateral and medial support, protection from the post-surgical risk of injuries, and limited injuries during movement.
Lower extremity braces and supports are most commonly used by those with arthritis and other joint-related ailments, athletes, and those who have had knee and ankle surgeries.
“Retail Sales Remain Dominant Due to Easy Availability of Medical Devices”
Certain orthopedic braces can only be used under the supervision of healthcare practitioners or orthopedic technicians as they require customization or product variation as per patient characteristics.
Braces including, wrist/hand braces, ankle braces, and elbow braces, are increasingly being distributed via retail sales as their usage does not require authorization from healthcare professionals.
About 6 in10 orthopedic braces and support are distributed either via retail sales channels or retail pharmacies. Patients are regularly banking on upper extremity products as preventative measures to prevent injuries. Amazon, BraceAbility, and Alibaba are leading e-Commerce platforms that sell orthopedic products.
As such, growing sales of healthcare medical devices via retail sales, as well as the increasing availability of reimbursements for these products across established markets, are expected to offer lucrative growth opportunities for manufacturers of orthopedic braces and supports.
The COVID-19 pandemic negatively impacted the orthopedic braces and support industry due to reasons such as a prohibition on organized sports and a decrease in elective surgeries. The orthopedic braces market growth was hampered by a decrease in patient flow and referrals, as well as a decrease in trauma and workplace injuries.
Key players are focusing on a variety of methods, including technological improvements, as well as expanding manufacturing and research capacities. An increase in the usage of orthopedic braces and support systems, as well as a higher adoption rate of smart technologies in hospitals and orthopedic centers, and the recent trends in facial braces and supports are expected to drive the market growth over the coming years.
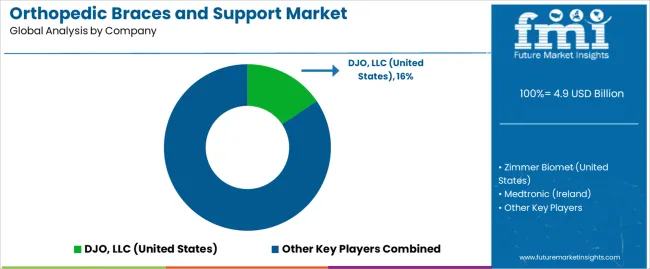
The global orthopedic braces and support market is moderately fragmented with a majority market share held by many players. Investments in innovation and diversification are imperative for market players to accelerate sales growth, expand customer reach, and improve customer retention and loyalty.
For instance,
In September 2021, Ossur launched the Rebound Post-Op Elbow Brace, which facilitates elbow immobilization and range-of-motion restriction for patients suffering from a several conditions, including chronic elbow injuries and tennis elbow release.
Attribute | Details |
---|---|
Forecast Period | 2022-2024 |
Historical Data Available for | 2014-2021 |
Market Analysis | Value in US$ Mn, Volume in Units |
Key Regions Covered |
|
Key Countries Covered |
|
Key Market Segments Covered |
|
Key Companies Profiled | |
Pricing | Available upon Request |
Orthopedic Braces and Support Market by Product:
Orthopedic Braces and Support Market by Distribution Channel:
Orthopedic Braces and Support Market by Region:
1. Executive Summary 1.1. Global Market Outlook 1.2. Key Trends & Market Dynamics 1.3. Industry Evolution 1.4. Analysis and Recommendations 2. Market Overview 2.1. Market Coverage / Taxonomy 2.2. Market Definition / Scope / Limitations 3. Key Market Trends 4. Key Success Factors 4.1. Product Adoption / Usage Analysis 4.2. Key Regulations 5. COVID19 Crisis Analysis 5.1. Current COVID19 Statistics 5.2. Current GDP Projection and Probable Impact 6. Global Market Demand Analysis 2014–2021 and Forecast, 2022-2024 6.1. Historical Market Volume (Units) Analysis, 2014–2021 6.2. Current and Future Market Volume (Units) Projections, 2022-2024 6.3. Y-o-Y Growth Trend Analysis 7. Global Market - Pricing Analysis 8. Global Market Demand (in Value or Size in US$ Mn) Analysis 2014–2021 and Forecast, 2022-2024 8.1. Historical Market Value (US$ Mn) Analysis, 2014–2021 8.2. Current and Future Market Value (US$ Mn) Projections, 2022-2024 8.2.1. Y-o-Y Growth Trend Analysis 8.2.2. Absolute $ Opportunity Analysis 9. Market Background 9.1. Macro-Economic Factors 9.1.1. Global aging population 9.1.2. Prevalence of orthopedic related disorders 9.2. Forecast Factors - Relevance & Impact 9.2.1. R&D Activities and Commercialization of New Products 9.2.2. Increased Application in Injury Prevention and Rehabilitation 9.2.3. Regulatory Imposition on Products 9.2.4. Advancements in Orthotic Devices 9.2.5. Growing Adoption Rate for Orthopedic Braces and Support 9.3. Market Dynamics 9.3.1. Drivers 9.3.2. Restraints 9.3.3. Opportunity Analysis 10. Global Market Analysis 2014–2021 and Forecast 2022-2024, by Product Type 10.1. Introduction / Key Findings 10.2. Historical Market Size (US$ Mn) and Volume (Units) Analysis By Product Type, 2014–2021 10.3. Current and Future Market Size (US$ Mn) and Volume (Units) Analysis and Forecast By Product Type, 2022 - 2024 10.3.1. Upper Extremity 10.3.1.1. Shoulder Braces and Support 10.3.1.2. Neck Braces and Support 10.3.1.3. Elbow Braces and Support 10.3.1.4. Wrist Braces and Support 10.3.1.5. Spinal Braces and Support 10.3.2. Lower Extremity 10.3.2.1. Knee Braces and Support 10.3.2.2. Ankle Braces and Support 10.3.2.3. Hip Braces and Support 10.4. Market Attractiveness Analysis By Product Type 11. Global Market Analysis 2014–2021 and Forecast 2022-2024, by Distribution channel 11.1. Introduction / Key Findings 11.2. Historical Market Size (US$ Mn) Analysis By Distribution channel, 2014–2021 11.3. Current and Future Market Size (US$ Mn) Analysis and Forecast By Distribution channel, 2022 - 2024 11.3.1. Institutional Sales 11.3.1.1. Hospitals 11.3.1.2. Orthopedic Clinics 11.3.1.3. Nursing Facilities 11.3.2. Retail Sales 11.3.2.1. Online Sales 11.3.2.2. Retail Pharmacies 11.3.2.3. Drug Stores 11.4. Market Attractiveness Analysis By Distribution channel 12. Global Market Analysis 2014–2021 and Forecast 2022-2024, by Region 12.1. Introduction / Key Findings 12.2. Historical Market Size (US$ Mn) and Volume (Units) Analysis By Distribution channel, 2014–2021 12.3. Current and Future Market Size (US$ Mn) and Volume (Units) Analysis and Forecast By Distribution channel, 2022 - 2024 12.3.1. North America 12.3.2. Latin America 12.3.3. Europe 12.3.4. Middle East and Africa (MEA) 12.3.5. East Asia 12.3.6. South Asia 12.3.7. Oceania 12.4. Market Attractiveness Analysis By Region 13. North America Market Analysis 2014–2021 and Forecast 2022-2024 13.1. Pricing Analysis 13.2. Historical Market Size (US$ Mn) and Volume Analysis By Distribution channel, 2014–2021 13.3. Current and Future Market Size (US$ Mn) and Volume Analysis and Forecast By Distribution channel, 2022 - 2024 13.3.1. By Country 13.3.1.1. U.S. 13.3.1.2. Canada 13.3.2. By Product Type 13.3.3. By Distribution channel 13.4. Market Attractiveness Analysis 13.4.1. By Country 13.4.2. By Product Type 13.4.3. By Distribution channel 13.5. Drivers and Restraints - Impact Analysis 14. Latin America Market Analysis 2014–2021 and Forecast 2022-2024 14.1. Pricing Analysis 14.2. Historical Market Size (US$ Mn) and Volume Analysis By Distribution channel, 2014–2021 14.3. Current and Future Market Size (US$ Mn) and Volume Analysis and Forecast By Distribution channel, 2022 - 2024 14.3.1. By Country 14.3.1.1. Brazil 14.3.1.2. Mexico 14.3.1.3. Rest of Latin America 14.3.2. By Product Type 14.3.3. By Distribution channel 14.4. Market Attractiveness Analysis 14.4.1. By Country 14.4.2. By Product Type 14.4.3. By Distribution channel 14.5. Drivers and Restraints - Impact Analysis 15. Europe Market Analysis 2014–2021 and Forecast 2022-2024 15.1. Pricing Analysis 15.2. Historical Market Size (US$ Mn) and Volume Analysis By Distribution channel, 2014–2021 15.3. Current and Future Market Size (US$ Mn) and Volume Analysis and Forecast By Distribution channel, 2022 - 2024 15.3.1. By Country 15.3.1.1. Germany 15.3.1.2. Italy 15.3.1.3. France 15.3.1.4. U.K. 15.3.1.5. Spain 15.3.1.6. BENELUX 15.3.1.7. Russia 15.3.1.8. Rest of Europe 15.3.2. By Product Type 15.3.3. By Distribution channel 15.4. Market Attractiveness Analysis 15.4.1. By Country 15.4.2. By Product Type 15.4.3. By Distribution channel 15.5. Drivers and Restraints - Impact Analysis 16. South Asia Market Analysis 2014–2021 and Forecast 2022-2024 16.1. Pricing Analysis 16.2. Historical Market Size (US$ Mn) and Volume Analysis By Distribution channel, 2014–2021 16.3. Current and Future Market Size (US$ Mn) and Volume Analysis and Forecast By Distribution channel, 2022 - 2024 16.3.1. By Country 16.3.1.1. India 16.3.1.2. Thailand 16.3.1.3. Indonesia 16.3.1.4. Malaysia 16.3.1.5. Rest of South Asia 16.3.2. By Product Type 16.3.3. By Distribution channel 16.4. Market Attractiveness Analysis 16.4.1. By Country 16.4.2. By Product Type 16.4.3. By Distribution channel 16.5. Drivers and Restraints - Impact Analysis 17. East Asia Market Analysis 2014–2021 and Forecast 2022-2024 17.1. Pricing Analysis 17.2. Historical Market Size (US$ Mn) and Volume Analysis By Distribution channel, 2014–2021 17.3. Current and Future Market Size (US$ Mn) and Volume Analysis and Forecast By Distribution channel, 2022 - 2024 17.3.1. By Country 17.3.1.1. China 17.3.1.2. Japan 17.3.1.3. South Korea 17.3.2. By Product Type 17.3.3. By Distribution channel 17.4. Market Attractiveness Analysis 17.4.1. By Country 17.4.2. By Product Type 17.4.3. By Distribution channel 17.5. Drivers and Restraints - Impact Analysis 18. Oceania Market Analysis 2014–2021 and Forecast 2022-2024 18.1. Pricing Analysis 18.2. Historical Market Size (US$ Mn) and Volume Analysis By Distribution channel, 2014–2021 18.3. Current and Future Market Size (US$ Mn) and Volume Analysis and Forecast By Distribution channel, 2022 - 2024 18.3.1. By Country 18.3.1.1. Australia 18.3.1.2. New Zealand 18.3.2. By Product Type 18.3.3. By Distribution channel 18.4. Market Attractiveness Analysis 18.4.1. By Country 18.4.2. By Product Type 18.4.3. By Distribution channel 18.5. Drivers and Restraints - Impact Analysis 19. Middle East and Africa Market Analysis 2014–2021 and Forecast 2022-2024 19.1. Pricing Analysis 19.2. Historical Market Size (US$ Mn) and Volume Analysis By Distribution channel, 2014–2021 19.3. Current and Future Market Size (US$ Mn) and Volume Analysis and Forecast By Distribution channel, 2022 - 2024 19.3.1. By Country 19.3.1.1. GCC Countries 19.3.1.2. Turkey 19.3.1.3. Northern Africa 19.3.1.4. South Africa 19.3.1.5. Rest of Middle East and Africa 19.3.2. By Product Type 19.3.3. By Distribution channel 19.4. Market Attractiveness Analysis 19.4.1. By Country 19.4.2. By Product Type 19.4.3. By Distribution channel 19.5. Drivers and Restraints - Impact Analysis 20. Key and Emerging Countries Respiratory Pathogen Testing Market Analysis 2014-2021 and Forecast 2022-2024 20.1. U.S. Respiratory Pathogen Testing Market Analysis 20.1.1. By Products 20.1.2. By Distribution Channel 20.2. Canada Respiratory Pathogen Testing Market Analysis 20.2.1. By Products 20.2.2. By Distribution Channel 20.3. Mexico Respiratory Pathogen Testing Market Analysis 20.3.1. By Products 20.3.2. By Distribution Channel 20.4. Brazil Respiratory Pathogen Testing Market Analysis 20.4.1. By Products 20.4.2. By Distribution Channel 20.5. U.K. Respiratory Pathogen Testing Market Analysis 20.5.1. By Products 20.5.2. By Distribution Channel 20.6. Germany Respiratory Pathogen Testing Market Analysis 20.6.1. By Products 20.6.2. By Distribution Channel 20.7. France Respiratory Pathogen Testing Market Analysis 20.7.1. By Products 20.7.2. By Distribution Channel 20.8. Italy Respiratory Pathogen Testing Market Analysis 20.8.1. By Products 20.8.2. By Distribution Channel 20.9. Spain Respiratory Pathogen Testing Market Analysis 20.9.1. By Products 20.9.2. By Distribution Channel 20.10. BENELUX Respiratory Pathogen Testing Market Analysis 20.10.1. By Products 20.10.2. By Distribution Channel 20.11. Russia Respiratory Pathogen Testing Market Analysis 20.11.1. By Products 20.11.2. By Distribution Channel 20.12. China Respiratory Pathogen Testing Market Analysis 20.12.1. By Products 20.12.2. By Distribution Channel 20.13. Japan Respiratory Pathogen Testing Market Analysis 20.13.1. By Products 20.13.2. By Distribution Channel 20.14. South Korea Respiratory Pathogen Testing Market Analysis 20.14.1. By Products 20.14.2. By Distribution Channel 20.15. India Respiratory Pathogen Testing Market Analysis 20.15.1. By Products 20.15.2. By Distribution Channel 20.16. ASEAN Respiratory Pathogen Testing Market Analysis 20.16.1. By Products 20.16.2. By Distribution Channel 20.17. Australia Respiratory Pathogen Testing Market Analysis 20.17.1. By Products 20.17.2. By Distribution Channel 20.18. New Zealand Respiratory Pathogen Testing Market Analysis 20.18.1. By Products 20.18.2. By Distribution Channel 20.19. GCC Countries Respiratory Pathogen Testing Market Analysis 20.19.1. By Products 20.19.2. By Distribution Channel 20.20. Turkey Respiratory Pathogen Testing Market Analysis 20.20.1. By Products 20.20.2. By Distribution Channel 20.21. Northern Africa Respiratory Pathogen Testing Market Analysis 20.21.1. By Products 20.21.2. By Distribution Channel 20.22. South Africa Respiratory Pathogen Testing Market Analysis 20.22.1. By Products 20.22.2. By Distribution Channel 21. Market Structure Analysis 21.1. Market Share Analysis of Top Players 21.1.1. Market Share Analysis 21.1.2. Casting Supplies & Equipment Market Share Analysis 21.1.3. Splinting Supplies & Equipment Market Share Analysis 21.1.4. Orthotics Market Share Analysis 22. Competition Analysis 22.1. Competition Dashboard 22.2. Competition Deep Dive 22.2.1. BSN Medical 22.2.1.1. Overview 22.2.1.2. Product Portfolio 22.2.1.3. Profitability by Market Segments (Product/Channel/Region) 22.2.1.4. Sales Footprint 22.2.1.5. Strategy Overview 22.2.1.5.1. Marketing Strategy 22.2.1.5.2. Product Strategy 22.2.1.5.3. Channel Strategy 22.2.2. De royal Industries, Inc. 22.2.2.1. Overview 22.2.2.2. Product Portfolio 22.2.2.3. Profitability by Market Segments (Product/Channel/Region) 22.2.2.4. Sales Footprint 22.2.2.5. Strategy Overview 22.2.2.5.1. Marketing Strategy 22.2.2.5.2. Product Strategy 22.2.2.5.3. Channel Strategy 22.2.3. Össur Hf 22.2.3.1. Overview 22.2.3.2. Product Portfolio 22.2.3.3. Profitability by Market Segments (Product/Channel/Region) 22.2.3.4. Sales Footprint 22.2.3.5. Strategy Overview 22.2.3.5.1. Marketing Strategy 22.2.3.5.2. Product Strategy 22.2.3.5.3. Channel Strategy 22.2.4. DJO, LLC 22.2.4.1. Overview 22.2.4.2. Product Portfolio 22.2.4.3. Profitability by Market Segments (Product/Channel/Region) 22.2.4.4. Sales Footprint 22.2.4.5. Strategy Overview 22.2.4.5.1. Marketing Strategy 22.2.4.5.2. Product Strategy 22.2.4.5.3. Channel Strategy 22.2.5. Zimmer Biomet Holdings, Inc. 22.2.5.1. Overview 22.2.5.2. Product Portfolio 22.2.5.3. Profitability by Market Segments (Product/Channel/Region) 22.2.5.4. Sales Footprint 22.2.5.5. Strategy Overview 22.2.5.5.1. Marketing Strategy 22.2.5.5.2. Product Strategy 22.2.5.5.3. Channel Strategy 22.2.6. Stryker Corporation 22.2.6.1. Overview 22.2.6.2. Product Portfolio 22.2.6.3. Profitability by Market Segments (Product/Channel/Region) 22.2.6.4. Sales Footprint 22.2.6.5. Strategy Overview 22.2.6.5.1. Marketing Strategy 22.2.6.5.2. Product Strategy 22.2.6.5.3. Channel Strategy 22.2.7. 3M Healthcare 22.2.7.1. Overview 22.2.7.2. Product Portfolio 22.2.7.3. Profitability by Market Segments (Product/Channel/Region) 22.2.7.4. Sales Footprint 22.2.7.5. Strategy Overview 22.2.7.5.1. Marketing Strategy 22.2.7.5.2. Product Strategy 22.2.7.5.3. Channel Strategy 22.2.8. Ascent Meditech Ltd. 22.2.8.1. Overview 22.2.8.2. Product Portfolio 22.2.8.3. Profitability by Market Segments (Product/Channel/Region) 22.2.8.4. Sales Footprint 22.2.8.5. Strategy Overview 22.2.8.5.1. Marketing Strategy 22.2.8.5.2. Product Strategy 22.2.8.5.3. Channel Strategy 22.2.9. Fillauer LLC 22.2.9.1. Overview 22.2.9.2. Product Portfolio 22.2.9.3. Profitability by Market Segments (Product/Channel/Region) 22.2.9.4. Sales Footprint 22.2.9.5. Strategy Overview 22.2.9.5.1. Marketing Strategy 22.2.9.5.2. Product Strategy 22.2.9.5.3. Channel Strategy 22.2.10. Hanger, Inc. 22.2.10.1. Overview 22.2.10.2. Product Portfolio 22.2.10.3. Profitability by Market Segments (Product/Channel/Region) 22.2.10.4. Sales Footprint 22.2.10.5. Strategy Overview 22.2.10.5.1. Marketing Strategy 22.2.10.5.2. Product Strategy 22.2.10.5.3. Channel Strategy 23. Assumptions and Acronyms Used 24. Research Methodology
Don't pay for what you don't need
Customize your report by selecting specific countries or regions and save 30%!
Table 01: Global Market Value (US$ Mn) Analysis 2014–2021 and Forecast 2022–2024, by Product Table 02: Global Market Volume (Mn Units) Analysis 2014–2021 and Forecast 2022–2024, by Product Table 03: Global Market Value (US$ Mn) Analysis 2014–2021 and Forecast 2022–2024, by Distribution Channel Table 04: Global Market Value (US$ Mn) Analysis 2014–2021 and Forecast 2022–2024, by Region Table 05: North America Market Value (US$ Mn) Analysis 2014–2021 and Forecast 2022–2024, by Country Table 06: North America Market Value (US$ Mn) Analysis 2014–2021 and Forecast 2022–2024, by Product Table 07: North America Market Volume (Mn Units) Analysis 2014–2021 and Forecast 2022–2024, by Product Table 08: North America Market Value (US$ Mn) Analysis 2014–2021 and Forecast 2022–2024, by Distribution Channel Table 09: Latin America Market Value (US$ Mn) Analysis 2014–2021 and Forecast 2022–2024, by Country Table 10: Latin America Market Value (US$ Mn) Analysis 2014–2021 and Forecast 2022–2024, by Product Table 11: Latin America Market Volume (Mn Units) Analysis 2014–2021 and Forecast 2022–2024, by Product Table 12: Latin America Market Value (US$ Mn) Analysis 2014–2021 and Forecast 2022–2024, by Distribution Channel Table 13: Europe Market Value (US$ Mn) Analysis 2014–2021 and Forecast 2022–2024, by Country Table 14: Europe Market Value (US$ Mn) Analysis 2014–2021 and Forecast 2022–2024, by Product Table 15: Europe Market Volume (Mn Units)Analysis 2014–2021 and Forecast 2022–2024, by Product Table 16: Europe Market Value (US$ Mn) Analysis 2014–2021 and Forecast 2022–2024, by Distribution Channel Table 17: South Asia Market Value (US$ Mn) Analysis 2014–2021 and Forecast 2022–2024, by Country Table 18: South Asia Market Value (US$ Mn) Analysis 2014–2021 and Forecast 2022–2024, by Product Table 19: South Asia Market Volume (Mn Units) Analysis 2014–2021 and Forecast 2022–2024, by Product Table 20: South Asia Market Value (US$ Mn) Analysis 2014–2021 and Forecast 2022–2024, by Distribution Channel Table 21: East Asia Market Value (US$ Mn) Analysis 2014–2021 and Forecast 2022–2024, by Country Table 22: East Asia Market Value (US$ Mn) Analysis 2014–2021 and Forecast 2022–2024, by Product Table 23: East Asia Market Volume (Mn Units) Analysis 2014–2021 and Forecast 2022–2024, by Product Table 24: East Asia Market Value (US$ Mn) Analysis 2014–2021 and Forecast 2022–2024, by Distribution Channel Table 25: Oceania Market Value (US$ Mn) Analysis 2014–2021 and Forecast 2022–2024, by Country Table 26: Oceania Market Value (US$ Mn) Analysis 2014–2021 and Forecast 2022–2024, by Product Table 27: Oceania Market Volume (Mn Units) Analysis 2014–2021 and Forecast 2022–2024, by Product Table 28: Oceania Market Value (US$ Mn) Analysis 2014–2021 and Forecast 2022–2024, by Distribution Channel Table 29: MEA Market Value (US$ Mn) Analysis 2014–2021 and Forecast 2022–2024, by Country Table 30: MEA Market Value (US$ Mn) Analysis 2014–2021 and Forecast 2022–2024, by Product Table 31: MEA Market Volume (Mn Units) Analysis 2014–2021 and Forecast 2022–2024, by Product Table 32: MEA Market Value (US$ Mn) Analysis 2014–2021 and Forecast 2022–2024, by Distribution Channel
Figure 01: Global Market Value Analysis and Forecast 2022 – 2024 (Mn Units) Figure 02: Global Pricing Analysis (US$) By Region, 2021 (Per Unit) Figure 03: Global Pricing Analysis (US$) By Region, 2024 (Per Unit) Figure 04: Global Market Value Analysis and Forecast 2022 – 2024 (US$ Mn) Figure 05: Global Market Value (US$ Mn), 2015 – 2021 Figure 06: Global Market Absolute $ Opportunity (US$ Mn), 2021–2024 Figure 07: Global Market Share Analysis (%) by Product, 2021 & 2024 Figure 08: Global Market Y-o-Y Growth (%) by Product, 2022–2029 Figure 09: Global Market Attractiveness Analysis by Product, 2022–2024 Figure 10: Global Market Share Analysis (%) by Distribution Channel, 2021 & 2024 Figure 11: Global Market Y-o-Y Growth (%) by Distribution Channel, 2018–2024 Figure 12: Global Market Attractiveness Analysis by Distribution Channel, 2022–2024 Figure 13: Global Market Share Analysis (%) by Region, 2021 & 2024 Figure 14: Global Market Y-o-Y Growth (%) by Region, 2018–2024 Figure 15: Global Market Attractiveness Analysis by Region on, 2022–2024 Figure 16: North America Casting Supplies & Equipment Pricing Analysis (US$) By Region, 2021 (Per Unit) Figure 17: North America Splinting Supplies & Equipment Pricing Analysis (US$) By Region, 2021 (Per Unit) Figure 18: North America Orthopedic Braces and Supports Pricing Analysis (US$) By Region, 2021 (Per Unit) Figure 19: North America Orthotics Pricing Analysis (US$) By Region, 2021 (Per Unit) Figure 20: North America Market Value (US$ Mn), 2015 – 2021 Figure 21: North America Market Value (US$ Mn) Forecast, 2021–2024 Figure 22: North America Market Attractiveness Analysis by Product, 2022–2024 Figure 23: North America Market Attractiveness Analysis by Distribution Channel, 2022–2024 Figure 24: North America Market Attractiveness Analysis by Country, 2022–2024 Figure 25: Latin America Casting Supplies & Equipment Pricing Analysis (US$) By Region, 2021 (Per Unit) Figure 26: Latin America Splinting Supplies & Equipment Pricing Analysis (US$) By Region, 2021 (Per Unit) Figure 27: Latin America Orthopedic Braces and Supports Pricing Analysis (US$) By Region, 2021 (Per Unit) Figure 28: Latin America Orthotics Pricing Analysis (US$) By Region, 2021 (Per Unit) Figure 29: Latin America Market Value (US$ Mn), 2015 – 2021 Figure 30: Latin America Market Value (US$ Mn) Forecast, 2021–2024 Figure 31: Latin America Market Attractiveness Analysis by Product, 2022–2024 Figure 32: Latin America Market Attractiveness Analysis by Distribution Channel, 2022–2024 Figure 33: Latin America Market Attractiveness Analysis by Country, 2022–2024 Figure 34: Europe Casting Supplies & Equipment Pricing Analysis (US$) By Region, 2021 (Per Unit) Figure 35: Europe Splinting Supplies & Equipment Pricing Analysis (US$) By Region, 2021 (Per Unit) Figure 36: Europe Orthopedic Braces and Supports Pricing Analysis (US$) By Region, 2021 (Per Unit) Figure 37: Europe Orthotics Pricing Analysis (US$) By Region, 2021 (Per Unit) Figure 38: Europe Market Value (US$ Mn), 2015 – 2021 Figure 39: Europe Market Value (US$ Mn) Forecast, 2021–2024 Figure 40: Europe Market Attractiveness Analysis by Product, 2022–2024 Figure 41: Europe Market Attractiveness Analysis by Distribution Channel, 2022–2024 Figure 42: Europe Market Attractiveness Analysis by Country, 2022–2024 Figure 43: South Asia Casting Supplies & Equipment Pricing Analysis (US$) By Region, 2021 (Per Unit) Figure 44: South Asia Splinting Supplies & Equipment Pricing Analysis (US$) By Region, 2021 (Per Unit) Figure 45: South Asia Orthopedic Braces and Supports Pricing Analysis (US$) By Region, 2021 (Per Unit) Figure 46: South Asia Orthotics Pricing Analysis (US$) By Region, 2021 (Per Unit) Figure 47: South Asia Market Value (US$ Mn), 2015 – 2021 Figure 48: South Asia Market Value (US$ Mn) Forecast, 2021–2024 Figure 49: South Asia Market Attractiveness Analysis by Product, 2022–2024 Figure 50: South Asia Market Attractiveness Analysis by Distribution Channel, 2022–2024 Figure 51: South Asia Market Attractiveness Analysis by Country, 2022–2024 Figure 52: East Asia Casting Supplies & Equipment Pricing Analysis (US$) By Region, 2021 (Per Unit) Figure 53: East Asia Splinting Supplies & Equipment Pricing Analysis (US$) By Region, 2021 (Per Unit) Figure 54: East Asia Orthopedic Braces and Supports Pricing Analysis (US$) By Region, 2021 (Per Unit) Figure 55: East Asia Orthotics Pricing Analysis (US$) By Region, 2021 (Per Unit) Figure 56: East Asia Market Value (US$ Mn), 2015 – 2021 Figure 57: East Asia Market Value (US$ Mn) Forecast, 2021–2024 Figure 58: East Asia Market Attractiveness Analysis by Product, 2022–2024 Figure 59: East Asia Market Attractiveness Analysis by Distribution Channel, 2022–2024 Figure 60: East Asia Market Attractiveness Analysis by Country, 2022–2024 Figure 61: Oceania Casting Supplies & Equipment Pricing Analysis (US$) By Region, 2021 (Per Unit) Figure 62: Oceania Splinting Supplies & Equipment Pricing Analysis (US$) By Region, 2021 (Per Unit) Figure 63: Oceania Orthopedic Braces and Supports Pricing Analysis (US$) By Region, 2021 (Per Unit) Figure 64: Oceania Orthotics Pricing Analysis (US$) By Region, 2021 (Per Unit) Figure 65: Oceania Market Value (US$ Mn), 2015 – 2021 Figure 66: Oceania Market Value (US$ Mn) Forecast, 2021–2024 Figure 67: Oceania Market Attractiveness Analysis by Product, 2022–2024 Figure 68: Oceania Market Attractiveness Analysis by Distribution Channel, 2022–2024 Figure 69: Oceania Market Attractiveness Analysis by Country, 2022–2024 Figure 70: MEA Casting Supplies & Equipment Pricing Analysis (US$) By Region, 2021 (Per Unit) Figure 71: MEA Splinting Supplies & Equipment Pricing Analysis (US$) By Region, 2021 (Per Unit) Figure 72: MEA Orthopedic Braces and Supports Pricing Analysis (US$) By Region, 2021 (Per Unit) Figure 73: MEA Orthotics Pricing Analysis (US$) By Region, 2021 (Per Unit) Figure 74: MEA Market Value (US$ Mn), 2015 – 2021 Figure 75: MEA Market Value (US$ Mn) Forecast, 2021–2024 Figure 76: MEA Market Attractiveness Analysis by Product, 2022–2024 Figure 77: MEA Market Attractiveness Analysis by Distribution Channel, 2022–2024 Figure 78: MEA Market Attractiveness Analysis by Country, 2022–2024 Figure 79: U.S. Market Share Analysis (%), by Product, 2021 & 2024 Figure 80: U.S. Market Share Analysis (%), by Distribution Channel, 2021 & 2024 Figure 81: Canada Market Share Analysis (%), by Product, 2021 & 2024 Figure 82: Canada Market Share Analysis (%), by Distribution Channel, 2021 & 2024 Figure 83: Brazil Market Share Analysis (%), by Product, 2021 & 2024 Figure 84: Brazil Market Share Analysis (%), by Distribution Channel, 2021 & 2024 Figure 85: Mexico Market Share Analysis (%), by Product, 2021 & 2024 Figure 86: Mexico Market Share Analysis (%), by Distribution Channel, 2021 & 2024 Figure 87: Germany Market Share Analysis (%), by Product, 2021 & 2024 Figure 88: Germany Market Share Analysis (%), by Distribution Channel, 2021 & 2024 Figure 89: Italy Market Share Analysis (%), by Product, 2021 & 2024 Figure 90: Italy Market Share Analysis (%), by Distribution Channel, 2021 & 2024 Figure 91: France Market Share Analysis (%), by Product, 2021 & 2024 Figure 92: France Market Share Analysis (%), by Distribution Channel, 2021 & 2024 Figure 93: U.K. Market Share Analysis (%), by Product, 2021 & 2024 Figure 94: U.K. Market Share Analysis (%), by Distribution Channel, 2021 & 2024 Figure 95: Spain Market Share Analysis (%), by Product, 2021 & 2024 Figure 96: Spain Market Share Analysis (%), by Distribution Channel, 2021 & 2024 Figure 97: BENELUX Market Share Analysis (%), by Product, 2021 & 2024 Figure 98: BENELUX Market Share Analysis (%), by Distribution Channel, 2021 & 2024 Figure 99: Russia Market Share Analysis (%), by Product, 2021 & 2024 Figure 100: Russia Market Share Analysis (%), by Distribution Channel, 2021 & 2024 Figure 101: India Market Share Analysis (%), by Product, 2021 & 2024 Figure 102: India Market Share Analysis (%), by Distribution Channel, 2021 & 2024 Figure 103: Malaysia Market Share Analysis (%), by Product, 2021 & 2024 Figure 104: Malaysia Market Share Analysis (%), by Distribution Channel, 2021 & 2024 Figure 105: Thailand Market Share Analysis (%), by Product, 2021 & 2024 Figure 106: Thailand Market Share Analysis (%), by Distribution Channel, 2021 & 2024 Figure 107: Indonesia Market Share Analysis (%), by Product, 2021 & 2024 Figure 108: Indonesia Market Share Analysis (%), by Distribution Channel, 2021 & 2024 Figure 109: China Market Share Analysis (%), by Product, 2021 & 2024 Figure 110: China Market Share Analysis (%), by Distribution Channel, 2021 & 2024 Figure 111: Japan Market Share Analysis (%), by Product, 2021 & 2024 Figure 112: Japan Market Share Analysis (%), by Distribution Channel, 2021 & 2024 Figure 113: Australia Market Share Analysis (%), by Product, 2021 & 2024 Figure 114: Australia Market Share Analysis (%), by Distribution Channel, 2021 & 2024 Figure 115: New Zealand Market Share Analysis (%), by Product, 2021 & 2024 Figure 116: New Zealand Market Share Analysis (%), by Distribution Channel, 2021 & 2024 Figure 117: GCC Countries Market Share Analysis (%), by Product, 2021 & 2024 Figure 118: GCC Countries Market Share Analysis (%), by Distribution Channel, 2021 & 2024 Figure 119: Turkey Market Share Analysis (%), by Product, 2021 & 2024 Figure 120: Turkey Market Share Analysis (%), by Distribution Channel, 2021 & 2024 Figure 121: Northern Africa Market Share Analysis (%), by Product, 2021 & 2024 Figure 122: Northern Africa Market Share Analysis (%), by Distribution Channel, 2021 & 2024 Figure 123: South Africa Market Share Analysis (%), by Product, 2021 & 2024 Figure 124: South Africa Market Share Analysis (%), by Distribution Channel, 2021 & 2024
Recommendations
Healthcare
Published : June 2022
Explore Healthcare Insights
View Reports