The Orthopedic Splints Market is estimated to be valued at USD 2.3 billion in 2025 and is projected to reach USD 6.8 billion by 2035, registering a compound annual growth rate (CAGR) of 11.5% over the forecast period.
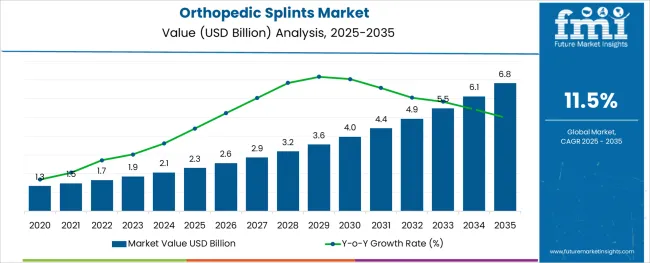
The orthopedic splints market is advancing steadily due to the growing incidence of musculoskeletal injuries, rising participation in sports activities, and increasing awareness about non invasive fracture management. Greater emphasis on immediate immobilization and outpatient care has contributed to the widespread use of orthopedic splints across trauma centers, clinics, and emergency departments.
Innovations in material science, lightweight design, and moisture resistance have improved patient comfort and clinical efficiency. The trend toward cost effective outpatient treatment and rising demand for temporary stabilization in orthopedic and post surgical care settings are also fueling market expansion.
Moreover, the market is benefitting from a growing elderly population prone to fractures and degenerative bone disorders, reinforcing the need for supportive orthopedic solutions. The future outlook remains positive as manufacturers prioritize product customization, sustainable materials, and fast application techniques to meet evolving healthcare needs.
The market is segmented by Product Type, Application, and End User and region. By Product Type, the market is divided into Plaster Splints, Fiberglass Splints, Tools & Accessories, and Other Product Types. In terms of Application, the market is classified into Upper Extremity and Lower Extremity. Based on End User, the market is segmented into Specialty Centers, Hospitals, and Other End-users. Regionally, the market is classified into North America, Latin America, Western Europe, Eastern Europe, Balkan & Baltic Countries, Russia & Belarus, Central Asia, East Asia, South Asia & Pacific, and the Middle East & Africa.
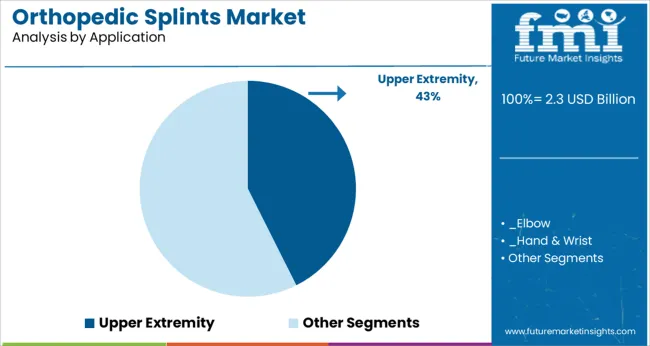
The upper extremity segment is projected to contribute 42.60% of the total market revenue by 2025 within the application category, establishing it as the leading segment. This dominance is attributed to the high incidence of hand, wrist, and forearm fractures resulting from sports injuries, falls, and occupational hazards.
The requirement for rapid immobilization and stable positioning in upper limb trauma has accelerated the adoption of splints specifically designed for upper extremity support. These splints are favored in emergency care due to ease of application, versatility, and the ability to accommodate swelling and wound care access.
Their consistent use across orthopedic practices and rehabilitation programs has solidified their position as a critical solution in fracture and post operative care.
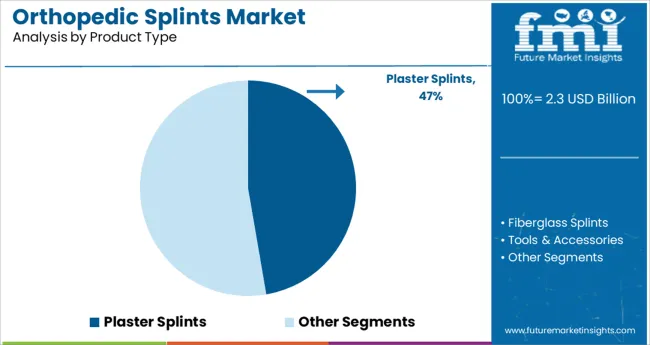
The plaster splints segment is expected to account for 47.30% of the total market revenue by 2025 within the product type category, positioning it as the most widely adopted option. This is due to the excellent moldability, rigidity, and cost effectiveness of plaster material, which remains a preferred choice in both developed and emerging healthcare settings.
Plaster splints are known for their quick setting properties, adaptability to patient anatomy, and reliability in acute care environments. Despite the advent of newer materials, the clinical familiarity and proven outcomes associated with plaster splints have preserved their relevance.
As orthopedic teams continue to rely on time tested materials for fracture stabilization, the plaster splints segment maintains its leadership within the product landscape.
The natural fibre shades segment is anticipated to represent 37.50% of total market revenue by 2025 in the material used category, emerging as a key driver of environmentally conscious medical products. The increasing preference for sustainable, biodegradable, and skin friendly materials in healthcare has led to greater interest in natural fibre based splints.
These materials offer adequate structural support while being lightweight, breathable, and hypoallergenic, making them suitable for long term use. Growing institutional policies favoring green procurement and reduced plastic waste have further propelled the adoption of natural alternatives.
As patient awareness regarding eco friendly products rises, the use of natural fibre.
The global market for orthopedic splints expanded at a CAGR of 10.6% from 2020 to 2024. The market growth is projected to benefit from the surge in requirements for fiberglass splints. Fiberglass splints are extensively advantageous relative to plaster splints. Aside from weighing less, they are a better option because of their increased durability and porosity.
The global Orthopedic Splints market is predicted to surge ahead at a CAGR of 11.5% and record sales worth USD 6.8 billion by the end of 2035. USA will continue to be the largest market throughout the analysis period accounting for over USD 1.1 billion absolute dollar opportunity in the coming 10-year epoch.
The highly accelerated increase in the number of people suffering from musculoskeletal diseases like osteoporosis and arthritis is one of the instrumental driving forces for the demand for Orthopedic Splints during the 10-year forecast epoch. Additionally, the Orthopedic Splints market is also anticipated to be advanced by the increase in the geriatric cohort of the population globally, as it will directly aid in increasing the number of patients having orthopedic ailments leading to a positive impact on the orthopedic splints demand.
Taking into account, a 2024 report by the National Natural Science Foundation Council of China, cases of knee osteoarthritis around the world are 16%, which is significantly more in the aged 40 and above population. Factors such as growing sports-related injuries and the increase in the number of road accidents are also anticipated to have an advantageous effect on the Orthopedic Splints market during the forecast period.
Compartment syndrome, the creation of pressure sores, and the risk of thermal injuries during the procedure of splinting or casting are among the key growth restraints faced by the Orthopedic Splints market during the forecast period. Moreover, high prices associated with fiberglass splints and the related custom products in some regions around the world may also hamper the growth of the Orthopedic Splints Market during the forecast period. Presently the BSN Medical Articast Fiberglass Casting Tape costs as high as Rs. 1,144 in India. Thus, high costs can be detrimental to the Orthopedic Splints Market.
Asia- Pacific is expected to be the most lucrative region for the Orthopedic Splints Market during the next 10-year epoch owing to the highly accelerated growth it is envisioned to experience. In the recent few years, hip fractures are on a steady rise in Japan, and it is anticipated that hip fractures could go up to 7.3-21.3 million population every year. This is projected to influence the lower extremity segment through the application of the Orthopedic Splints Market in Japan.
A 2020 article by the British Medical Journal states that as many as 1.3 million Indians are dealing with obesity, which increases the possibility of orthopedic injuries by 48%. As per a NIC report, as many as 467,044 street accidents have been reported in India in 2020 which lead to fractures and related injuries fueling the demand for orthopedic splints in both upper and lower extremities. Moreover, another article by the National Institute of Health and Family (NIHFW), by the Ministry of Health and Welfare (MoHFW) states that not only osteoarthritis is the second most common rheumatologic issue, but it also had a prevalence of 22%-39% in 2020 in the country.
All these factors are contributing to the growth of the Orthopedic Splints Market in the country. Since the rise in cases of orthopedic diseases such as osteoarthritis is increasing, it will directly affect the application of orthopedic splints, thereby benefitting the market. The market in the region is further benefitted by the expanding medical tourism, especially to the countries such as India and China due to their comparative cost-effectiveness and availability of high-order equipment.
Orthopedic Splints Market in the North American region accounts for more than 35% of the total market revenue and is projected to keep its dominant position in the market intact during the 10-year forecast period. The USA is forecasted to dominate the Orthopedic Splints Market in the North-American region. Taking into account the World Population Aging Report, people over the age of 65 in the USA and Canada are anticipated to increase from over 1.3 million in 2020 to approximately 6.8 million in 2035.
Considering the elevated vulnerability of this cohort to arthritis, joint pain, and other related orthopedic conditions, it is anticipated to be instrumental to fuel the growth of the Orthopedic Splints Market forward during the forecasted period of 10 years in the North American region. Additionally, the Orthopedic Splints Market is expected to gain further traction in the North American region from the increasing Sports injuries in the USA The American Academy of Pediatrics reported in a 2020 article that among all the time-loss injuries among soccer players aged 5-17, the most common are ankles and knees, with 20.9% and 16.3% of the total injuries, respectively.
Due to this, the demand for orthopedic splints in the lower extremity segment by application is projected to increase during the forecast period, thus positively shaping the market.
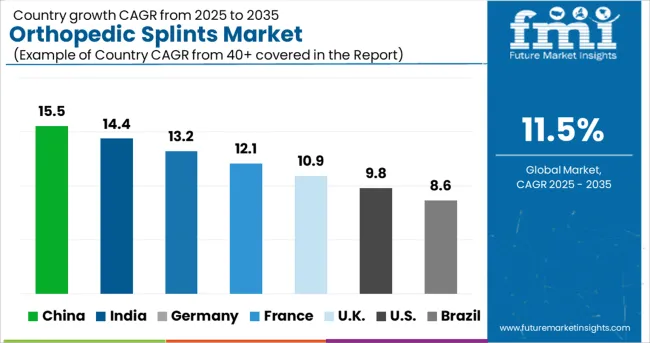
During the forthcoming years, the USA is expected to experience a USD 6.8 billion absolute dollar opportunity to grow at a highly accelerated rate of 12.4% CAGR and reach the market valuation of USD 1.6 billion by the end of 2035. Centers for Disease Control and Prevention (CDC) estimates that approximately 78 million (26% of the adults in the USA) will be suffering from arthritis by 2040. This increasing volume is set to further fuel the Orthopedic Splints Market during the forecast years.
A recent article by the National Center for Biotechnology Information (NCBI) states that in 2024, approximately 1.5 million people have suffered from fractures related to bone disorders. With as many as 3.5 million annual sports injuries among teens and children in the USA, the demand for orthopedic splints is expected to be benefitted during the forecast period of 10 years due to this, leading to an increase in its application. Thus, the USA is expected to play an instrumental role in the Global Orthopedic Splints Demand in the forthcoming years.
In 2024, around 470,000 workers suffered from work-related musculoskeletal disorders. Considering the overall population, around 20.3 million people in the United Kingdom have musculoskeletal (MSK) conditions such as arthritis or back pain. Apart from this, a large population in the country has been suffering from shin splints. Owing to these facts, the market in the United Kingdom is projected to reach a valuation of USD 225 million by 2035, growing at a CAGR of 12.4%.
Japan is one of the countries with a high geriatric population. This has kept the Japanese people exposed to several orthopedic ailments. There were nearly 5,000 general hospitals in Japan with orthopedic surgery departments. With these statistics, the orthopedic splints market in Japan is expected to reach a valuation of USD 194 million by 2035, growing at a CAGR of 11.5% from 2025 to 2035.
A total of 735,073 ankle fractures were identified in 461,497,758 South Korean people in the last 10 years. The annual incidence of ankle fracture was 171.4 per 100,000 persons, with a male-to-female ratio of 0.78. With these statistics, the orthopedic splints market in South Korea is projected to garner an absolute dollar opportunity of USD 2.3 million, from 2025 to 2035.
Orthopedic Splints market revenue through the lower extremity segment is projected to witness a CAGR of 10.3% during the 10-year epoch. The 2020 statistics of the International Osteoporosis Foundation stated that annually around 1.3 million fractures globally are the result of osteoporosis. This consequently leads to an osteoporosis fracture, every 3 seconds. Over 86% of hip fractures globally occur among the geriatric population. United Nations’ World Population Ageing report of 2020, states that as of 2020, 703 million of the global population is 65 or above.
This number is projected to rise to approximately 1.5 billion by 2050. These factors are anticipated to raise the demand for Orthopedic Splints by augmenting their necessity in the Lower Extremity segment during the forecast period.
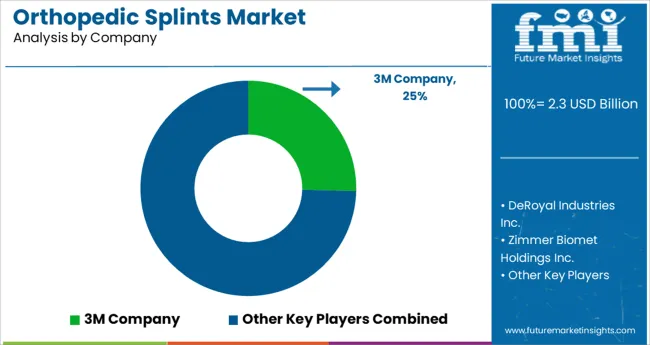
3M Company, DeRoyal Industries Inc., BSN Medical, Zimmer Biomet Holdings Inc., Medi GmbH & Co. KG, Orthosys, Breg Inc. (Orthofyx), United Medicare, Sam Medical, Essity, Stryker Corporation, DeRoyal Industries Inc., and Ottobock SE & Co. KGaA are among the key players driving the competitive landscape of the market. To expand their product portfolio and simultaneously capitalize on the growing market demand, many of these companies are adopting strategies such as mergers, acquisitions, and partnerships.
Recent Developments
By Product Type:
The global orthopedic splints market is estimated to be valued at USD 2.3 billion in 2025.
It is projected to reach USD 6.8 billion by 2035.
The market is expected to grow at a 11.5% CAGR between 2025 and 2035.
The key product types are plaster splints, fiberglass splints, tools & accessories and other product types.
upper extremity segment is expected to dominate with a 42.6% industry share in 2025.


Our Research Products

The "Full Research Suite" delivers actionable market intel, deep dives on markets or technologies, so clients act faster, cut risk, and unlock growth.

The Leaderboard benchmarks and ranks top vendors, classifying them as Established Leaders, Leading Challengers, or Disruptors & Challengers.

Locates where complements amplify value and substitutes erode it, forecasting net impact by horizon

We deliver granular, decision-grade intel: market sizing, 5-year forecasts, pricing, adoption, usage, revenue, and operational KPIs—plus competitor tracking, regulation, and value chains—across 60 countries broadly.

Spot the shifts before they hit your P&L. We track inflection points, adoption curves, pricing moves, and ecosystem plays to show where demand is heading, why it is changing, and what to do next across high-growth markets and disruptive tech

Real-time reads of user behavior. We track shifting priorities, perceptions of today’s and next-gen services, and provider experience, then pace how fast tech moves from trial to adoption, blending buyer, consumer, and channel inputs with social signals (#WhySwitch, #UX).

Partner with our analyst team to build a custom report designed around your business priorities. From analysing market trends to assessing competitors or crafting bespoke datasets, we tailor insights to your needs.
Supplier Intelligence
Discovery & Profiling
Capacity & Footprint
Performance & Risk
Compliance & Governance
Commercial Readiness
Who Supplies Whom
Scorecards & Shortlists
Playbooks & Docs
Category Intelligence
Definition & Scope
Demand & Use Cases
Cost Drivers
Market Structure
Supply Chain Map
Trade & Policy
Operating Norms
Deliverables
Buyer Intelligence
Account Basics
Spend & Scope
Procurement Model
Vendor Requirements
Terms & Policies
Entry Strategy
Pain Points & Triggers
Outputs
Pricing Analysis
Benchmarks
Trends
Should-Cost
Indexation
Landed Cost
Commercial Terms
Deliverables
Brand Analysis
Positioning & Value Prop
Share & Presence
Customer Evidence
Go-to-Market
Digital & Reputation
Compliance & Trust
KPIs & Gaps
Outputs
Full Research Suite comprises of:
Market outlook & trends analysis
Interviews & case studies
Strategic recommendations
Vendor profiles & capabilities analysis
5-year forecasts
8 regions and 60+ country-level data splits
Market segment data splits
12 months of continuous data updates
DELIVERED AS:
PDF EXCEL ONLINE
Orthotic Devices, Splints & Orthopedic Braces Market Analysis - Trends & Forecast 2024 to 2034
Orthopedic Bone Defect Repair Materials Market Size and Share Forecast Outlook 2025 to 2035
Orthopedic Artificial Bone Defect Repair Materials Market Size and Share Forecast Outlook 2025 to 2035
Orthopedic Titanium Plate with Loop Market Size and Share Forecast Outlook 2025 to 2035
Orthopedic Prosthetics Market Size and Share Forecast Outlook 2025 to 2035
Orthopedic Braces and Support Market Forecast and Outlook 2025 to 2035
Orthopedic Power Tools Market Size and Share Forecast Outlook 2025 to 2035
Orthopedic Contract Manufacturing Market Size and Share Forecast Outlook 2025 to 2035
Orthopedic Digit Implants Market Size and Share Forecast Outlook 2025 to 2035
Orthopedic Prosthetic Device Market Analysis - Size, Share, and Forecast Outlook 2025 to 2035
Orthopedic Software Market Size and Share Forecast Outlook 2025 to 2035
Orthopedic Navigation Systems Market Analysis – Trends, Growth & Forecast 2025 to 2035
Orthopedic Trauma Device Market Trends - Size, Share & Forecast 2025 to 2035
Orthopedic Insole Market Analysis – Size & Industry Trends 2025–2035
Orthopedic Shoes Market Growth – Trends & Forecast 2025 to 2035
Orthopedic Oncology Market Growth - Trends & Forecast 2025 to 2035
A Global Brand Share Analysis for Orthopedic Insole Market
Orthopedic Consumables Market Trends – Industry Growth & Forecast 2024 to 2034
3D Orthopedic Scanning Systems Market
Smart Orthopedic Implants Market

Thank you!
You will receive an email from our Business Development Manager. Please be sure to check your SPAM/JUNK folder too.
Chat With
MaRIA