The orthopedic prosthetic device market is estimated to be valued at USD 2.4 billion in 2025 and is projected to reach USD 3.8 billion by 2035, registering a compound annual growth rate (CAGR) of 4.8%. The market adds an absolute dollar opportunity of USD 1.4 billion over the forecast period. This reflects 1.58 times growth at a compound annual growth rate of 4.8%.
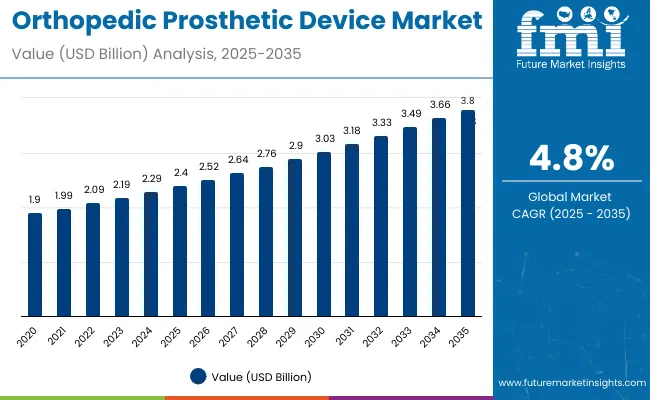
| Metric | Value |
|---|---|
| Market Size in 2025 | USD 2.4 billion |
| Market Size in 2035 | USD 3.8 billion |
| CAGR (2025 to 2035) | 4.8% |
The market's evolution is expected to be shaped by increasing cases of limb loss, technological advancements in bionic and lightweight prosthetics, and rising healthcare investments supporting better patient rehabilitation outcomes.
By 2030, the market reaches nearly USD 3.03 billion, highlighting steady mid-term growth. This trend reflects sustained global demand as prosthetic devices become more technologically advanced and accessible, especially in emerging economies. Over the 2025 to 2035 period, the sector is poised to achieve an absolute growth of about USD 1.44 billion, underscoring consistent patient reliance on customized, advanced prosthetic devices and continuous innovation aimed at improving comfort, functionality, and patient lifestyle worldwide.
Leading companies such as Zimmer Biomet, Össur hf., Stryker Corporation, and Blatchford Groupare consolidating their positions by strengthening product portfolios and advancing next-generation orthopedic prosthetic technologies. Their focus includes electric-powered prosthetics, microprocessor-controlled limbs, and IoT-enabled devices that enhance functionality, comfort, and patient outcomes. By investing in innovation, customization, and cost-effective solutions, these players are expanding market penetration across developed healthcare systems and emerging regions.
The market holds a critical position in the broader medical devices sector and captures demanddriven by rising incidences of limb loss due to accidents, chronic diseases, and sports injuries. Lower extremity prosthetics, accounting for over 50% of product usage, remain central to patient mobility and rehabilitation efforts. This sector contributes substantially to healthcare advancements, driven by continuous technology improvements and increasing access to prosthetic services worldwide.
The market is evolving with advanced electric-powered devices, smart sensors, and 3D-printed customized components that enhance precision, durability, and user comfort. Companies are expanding portfolios with smarter, lightweight, and energy-efficient prosthetics aimed at improving long-term patient mobility and lifestyle. Strategic collaborations with hospitals, rehabilitation centers, and healthcare providers are reshaping accessibility, positioning advanced orthopedic prosthetic systems as essential solutions for diverse patient populations globally.
The orthopedic prosthetic device market is experiencing steady growth due to a convergence of several key factors. Primarily, the rising incidence of limb loss resulting from road accidents, chronic illnesses such as diabetes and vascular diseases, and an aging global population is driving demand for prosthetic devices. As healthcare infrastructure improves in emerging markets, accessibility to prosthetic care is expanding, further increasing the patient base.
Technological advancements are another significant growth driver. The development of electric-powered prosthetics with microprocessor control, IoT-enabled features, and customizable components enhances device functionality, comfort, and patient outcomes. These innovations attract a broader population, including active individuals and athletes seeking higher-performance prosthetics.
Additionally, increased investments by both public and private sectors in specialized prosthetic clinics offer customized solutions that meet individual patient needs, fueling market expansion. The growing awareness of rehabilitation and quality of life benefits also encourages adoption.
The market is segmented by product, technology, and region. By product, the market is categorized into upper extremity prosthetics, lower extremity prosthetics, sockets, and others (orthopedic supportive devices and miscellaneous prosthetic components). Based on technology, the market is divided into conventional, electric-powered, and hybrid orthopedic prosthetics. Regionally, the market is classified into North America, Latin America, Western Europe, Eastern Europe, South Asia and Pacific, East Asia, and the Middle East & Africa.
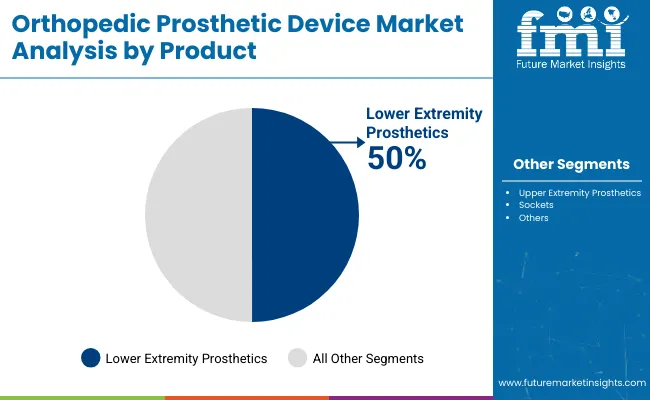
The lower extremity prosthetics segment is the most lucrative, commanding over 50% of the total market share. This dominance is driven primarily by the high prevalence of lower limb amputations worldwide, often caused by diabetes, peripheral arterial disease, trauma, and vascular disorders. These conditions disproportionately affect aging populations and individuals in both developed and emerging regions, fueling demand for advanced lower limb prosthetic solutions. The lower extremity segment benefits from continuous technological innovations such as microprocessor-controlled knees, energy-storing feet, and lightweight materials that enhance mobility and reduce fatigue, making these devices highly sought-after by patients aiming to regain functional independence.
Moreover, reimbursement policies and government healthcare initiatives are more favorable towards lower limb prosthetics, further boosting adoption rates. Prosthetic clinics and rehabilitation centers prioritize this segment due to its significant impact on patient quality of life and mobility restoration. Meanwhile, upper extremity prosthetics, sockets, and other products, although growing, hold comparatively smaller shares, making lower extremity prosthetics the clear market leader in both value and growth potential.
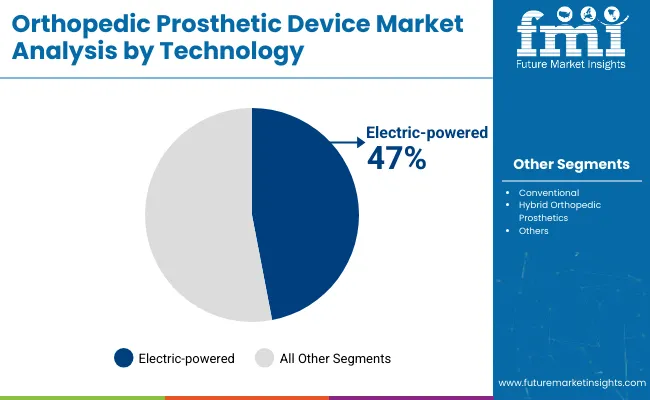
The electric-powered segment is the most lucrative technology category in the market, holding about 47% share in 2025. These advanced prosthetic devices are equipped with microprocessor-controlled joints, smart sensors, and IoT capabilities, offering superior functionality, adaptability, and comfort compared to traditional systems. They provide users with enhanced mobility and natural movement, significantly improving quality of life and user satisfaction. The integration of cutting-edge technologies enables real-time adjustments to gait and motion, reducing fatigue and increasing precision for complex activities.
This segment appeals strongly to patients seeking high-performance prosthetics and drives higher adoption rates due to growing awareness and technological advancements. Prosthetic clinics play a key role in popularizing electric-powered devices by providing customized fittings and ongoing support. The willingness of patients and healthcare providers to invest in these state-of-the-art prosthetics further accelerates market growth. Innovations continue to make electric-powered prosthetics more accessible and effective, solidifying their dominant position in the orthopedic prosthetic device market. This robust growth is expected to continue as technology evolves.
The market from 2025 to 2035 is driven by increasing incidences of limb loss due to diabetes, trauma, and vascular diseases, affecting both pediatric and elderly populations globally. Advancements in technology, including electric-powered prosthetics with microprocessor controls, smart sensors, and IoT integration, are enhancing device functionality, comfort, and patient outcomes, encouraging wider adoption. Growing awareness among healthcare providers and patients about the benefits of advanced prosthetics, coupled with expanding healthcare infrastructure and prosthetic clinics worldwide, supports market expansion.
Health Awareness and Clinical Innovation Boost Orthopedic Prosthetic Device Market Growth
Rising awareness about mobility restoration and rehabilitation benefits fuels demand for orthopedic prosthetic devices. Technological innovations like microprocessor knees and adaptive sensors allow personalized gait adjustment, reducing fatigue and improving quality of life. Early diagnosis through advanced imaging also aids timely prosthetic fitting. Enhanced insurance reimbursement policies in developed nations and healthcare reforms in emerging countries further increase adoption. The integration of tele-orthotics and remote monitoring enhances patient care and device customization.
Innovation and Sustainability Expanding Orthopedic Prosthetic Device Market Opportunities
Continuous innovation drives market opportunities beyond traditional prosthetics. Developments in 3D printed custom devices, AI-enabled sensors, and energy-efficient power sources improve product performance and durability. Manufacturers focus on sustainable materials and eco-friendly manufacturing processes to meet regulatory standards and consumer preferences. Smart prosthetic systems with real-time feedback and remote diagnostics cater to personalized needs and optimize long-term outcomes. Collaborative efforts between technology firms, healthcare providers, and regulatory bodies ensure quality and accessibility, positioning the market for robust growth globally.
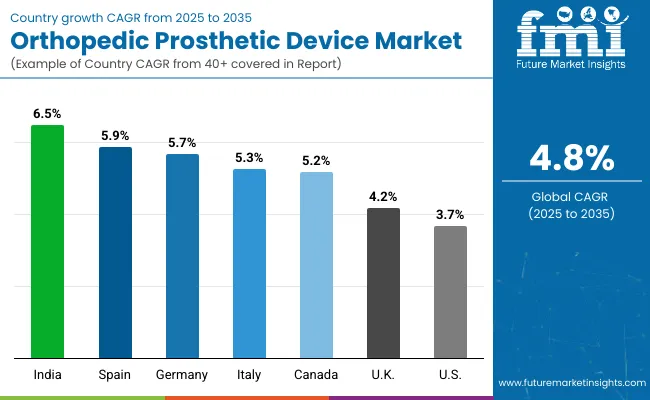
| Countries | CAGR (%) |
|---|---|
| India | 6.5% |
| Spain | 5.9% |
| Germany | 5.7% |
| Italy | 5.3% |
| Canada | 5.2% |
| United Kingdom | 4.2% |
| United States | 3.7% |
The market exhibits varied growth rates across key countries, reflecting diverse healthcare dynamics and technological adoption patterns. India leads with the highest CAGR of 6.5%, driven by a large diabetic population, rising injury cases, and expanding healthcare access in rural areas. Spain follows closely at 5.9%, leveraging its aging population and 3D printing adoption for personalized prosthetics. Germany’s market grows at 5.7%, supported by sustainable material use and advanced digital fitting technologies.
Italy’s growth rate of 5.3% reflects increasing clinical research and government funding for rehabilitation services. Canada, with a 5.2% CAGR, benefits from tele-orthotics and AI-enabled devices expanding access to remote populations. The UK grows at 4.2%, fueled by NHS-backed digital orthopedics programs and rising chronic disease prevalence. The USA, despite being a technology leader, has the lowest CAGR of 3.7%, reflecting a mature market with steady innovation adoption.
The report covers an in-depth analysis of 40+ countries; seven top-performing OECD countries are highlighted below.
Revenue from orthopedic prosthetic devices in India expands rapidly, registering a CAGR of 6.5%. This growth is driven by increasing cases of diabetes-related lower limb amputations and road accident injuries. Government programs and healthcare initiatives improve prosthetic access, particularly in rural and underserved areas. Local manufacturing efforts are rising, focusing on cost-effective and modular devices for broader affordability. Additionally, collaboration with global technology providers enhances product quality and innovation. Patients’ awareness about the benefits of advanced prosthetics is increasing, supported by prosthetic clinics expanding their services. The market also benefits from growing investments in research and development, making India a key emerging market in this sector.
Revenue from orthopedic prosthetic devices in Spain grows steadily with a CAGR of 5.9%. The aging population and increased sports-related injuries drive demand for both upper and lower extremity prosthetics. Technological adoption, particularly 3D printing for customized components, is gaining momentum in the region. Healthcare reimbursement policies are supportive, encouraging the use of advanced prosthetic devices. Emerging startups are focusing on innovative lightweight prosthetics, improving patient comfort and mobility. Urban and rural patients alike are gaining better access to prosthetic care due to improved distribution channels. Strong research institutions enhance product innovation and clinical application.
Revenue from orthopedic prosthetic devices in Germany grows at a CAGR of 5.7%, driven by focus on high-technology solutions and sustainability. The country is a pioneer in using carbon fiber and recyclable materials to create durable and eco-friendly prosthetics. Digital tools enable more precise fittings and alignments, enhancing patient comfort and increasing adoption. Reimbursement systems are well-established, providing accessibility to advanced devices. Industry clusters promote strong collaboration between manufacturers, healthcare providers, and research institutions. The German market is also marked by high R&D investments, fostering continuous innovation in prosthetic technologies.
Revenue from orthopedic prosthetic devices in Italy expands at a CAGR of 5.3%, shaped by a rapidly aging populationand rising clinical research adoption. Advanced manufacturing techniques such as 3D printing allow personalized prosthetics, meeting complex patient-specific needs. Public and private investments support healthcare infrastructure, facilitating better rehabilitation and prosthetic access. Innovation hubs in Italy foster collaborations between academia and industry, accelerating product development. Patient education campaigns raise awareness, encouraging wider acceptance. Government policies support reimbursement and affordability, enabling consistent market growth.
Demand for orthopedic prosthetic devices in Canada grows at a CAGR of 5.2%, boosted by tele-orthotics expanding prosthetic services in remote regions. Investments in AI-enabled and sensor-integrated prosthetics improve device functionality. Government programs prioritize affordability and access, streamlining patient care with advanced technologies. Collaboration between clinics and manufacturers enhances user support and customization. Insurance schemes increasingly cover next-generation prosthetics, lowering cost barriers. Rehabilitation centers leverage telehealth platforms for continuous patient monitoring and adjustment. Canada represents a growing hub for integrating technology with healthcare services in prosthetics.
Demand for orthopedic prosthetic devices in the USA grows at a CAGR of 3.7% and remains a global leaderin advanced prosthetic technologies. It benefits from comprehensive insurance coverage and early adoption of innovations like myoelectric and robotic prosthetics. High research and development investment fosters frequent product launches and device improvement. The healthcare system’s emphasis on rehabilitation and mobility further drives demand. The presence of major global companies and skilled clinical professionals supports sustained growth. Consumer awareness about prosthetic advancements also increases adoption and patient satisfaction. The USA continues to serve as a benchmark for technology and healthcare integration in prosthetics.
Demand for orthopedic prosthetic devices in the UK grows at a CAGR of 4.2%, driven by NHS-backed programs promoting digital orthopedics and rehabilitation services. Increasing chronic disease prevalence leading to amputations is expanding the patient base. The NHS integrates digital tools like 3D printing into prosthetic manufacturing, enhancing fit and functionality. Public-private partnerships support clinical research and new technology adoption. Patient education campaigns improve commitment to rehabilitation and prosthetic use. Regional accessibility improves with expanding rehabilitation centers and specialized clinics across the country.
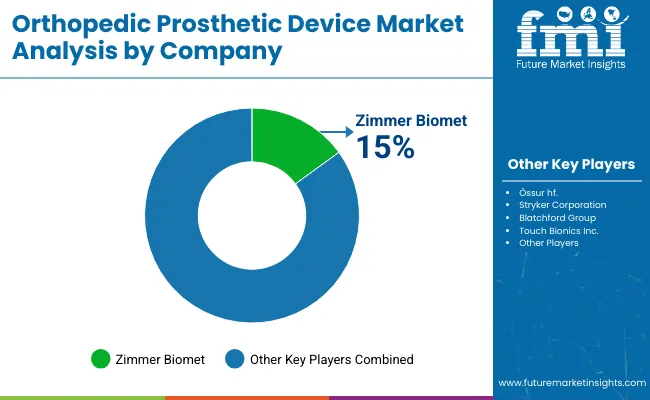
The competitive landscape is characterized by a mix of well-established global companies and innovative startups, driving robust competition through continuous research and development. Major players such as Zimmer Biomet, Össur hf., Stryker Corporation, and Blatchford Groupdominate the market, leveraging extensive product portfolios and advanced technologies to maintain leadership positions. These companies invest heavily in innovation, focusing on electric-powered prosthetics, microprocessor-controlled joints, and IoT-enabled devices that enhance patient mobility and comfort.
Strategic collaborations with healthcare providers and prosthetic clinics enhance market reach and customer support, while mergers and acquisitions expand technological capabilities and geographic presence. Emerging firms specialize in niche products such as 3D-printed customized limbs and hybrid prosthetics, fostering innovation in design and material science.
| Items | Values |
|---|---|
| Quantitative Units (2025) | USD 2.4 billion |
| Product Type | Lower Extremity Prosthetics, Upper Extremity Prosthetics, Sockets, Other Products |
| Technology Type | Electric-Powered, Conventional, Hybrid Orthopedic Prosthetics |
| Regions Covered | North America, Europe, Asia Pacific, Latin America, Middle East & Africa |
| Countries Covered | United States, Canada, United Kingdom, Germany, France, India, China, Japan, South Korea, Brazil, Australia, and 40+ countries |
| Key Companies Profiled | Hanger Inc, Otto Bock HealthCare GmbH, Össur hf., Boston Orthotics & Prosthetics, Arm Dynamics, Inc, Steeper Group, and Trulife . |
| Additional Attributes | Revenue by product and technology type, adoption of electric-powered and microprocessor-controlled prosthetics, expansion of prosthetic clinics, advances in 3D printing and customized fittings, rising prevalence of limb loss due to chronic diseases and trauma, increasing elderly and diabetic population |
The global orthopedic prosthetic device market is estimated to be valued at USD 2.4 billion in 2025.
The market size for orthopedic prosthetic device is projected to reach USD 3.8 billion by 2035.
The orthopedic prosthetic device market is expected to grow at a 4.8% CAGR between 2025 and 2035.
The lower extremity prosthetics segment is projected to lead in the orthopedic prosthetic device market with 50% market share in 2025.
In terms of technology, electric-powered prosthetics segment to command 47% share in the orthopedic prosthetic device market in 2025.


Full Research Suite comprises of:
Market outlook & trends analysis
Interviews & case studies
Strategic recommendations
Vendor profiles & capabilities analysis
5-year forecasts
8 regions and 60+ country-level data splits
Market segment data splits
12 months of continuous data updates
DELIVERED AS:
PDF EXCEL ONLINE
Orthopedic Braces and Support Market Forecast and Outlook 2025 to 2035
Orthopedic Power Tools Market Size and Share Forecast Outlook 2025 to 2035
Orthopedic Contract Manufacturing Market Size and Share Forecast Outlook 2025 to 2035
Orthopedic Digit Implants Market Size and Share Forecast Outlook 2025 to 2035
Orthopedic Splints Market Size and Share Forecast Outlook 2025 to 2035
Orthopedic Software Market Size and Share Forecast Outlook 2025 to 2035
Orthopedic Navigation Systems Market Analysis – Trends, Growth & Forecast 2025 to 2035
Orthopedic Insole Market Analysis – Size & Industry Trends 2025–2035
Orthopedic Shoes Market Growth – Trends & Forecast 2025 to 2035
Orthopedic Oncology Market Growth - Trends & Forecast 2025 to 2035
A Global Brand Share Analysis for Orthopedic Insole Market
Orthopedic Consumables Market Trends – Industry Growth & Forecast 2024 to 2034
Orthopedic Trauma Device Market Trends - Size, Share & Forecast 2025 to 2035
Orthopedic Prosthetics Market Size and Share Forecast Outlook 2025 to 2035
3D Orthopedic Scanning Systems Market
Smart Orthopedic Implants Market
Canine Orthopedic Implants Market Size and Share Forecast Outlook 2025 to 2035
Veterinary Orthopedic Drills Market Size and Share Forecast Outlook 2025 to 2035
Veterinary Orthopedic Market Overview – Trends, Applications & Forecast 2024-2034
Veterinary Orthopedic Injectable Drug Market

Thank you!
You will receive an email from our Business Development Manager. Please be sure to check your SPAM/JUNK folder too.
Chat With
MaRIA