Orthopedic Power Tools Market Analysis from 2025 to 2035

The orthopedic power tools market is exhibiting steady expansion, driven by the increasing volume of orthopedic procedures and the evolution of surgical techniques that demand precision, efficiency, and control. Industry announcements and surgical equipment manufacturers' reports have indicated that orthopedic centers and hospitals are increasingly investing in high-performance power tools to enhance surgical outcomes and reduce operating time.

Rising geriatric populations and a growing prevalence of musculoskeletal conditions, including fractures, arthritis, and sports injuries, have contributed to the steady rise in orthopedic surgeries globally. Additionally, technological advancements in motor efficiency, ergonomic tool design, and modular configurations are supporting the shift toward next-generation tools that improve procedural accuracy.

Healthcare providers are also favoring tools that support streamlined sterilization workflows and reduce cross-contamination risks, especially in high-volume surgical environments. Moving forward, the market is expected to benefit from innovations in battery technology, smart surgical platforms, and growing investments in ambulatory surgical centers. Segmental growth is being led by Large Bone Orthopedic Power Tools in product usage, Reusable Power Orthopedic Tools in modality preference, and Battery-powered Systems in technology adoption.
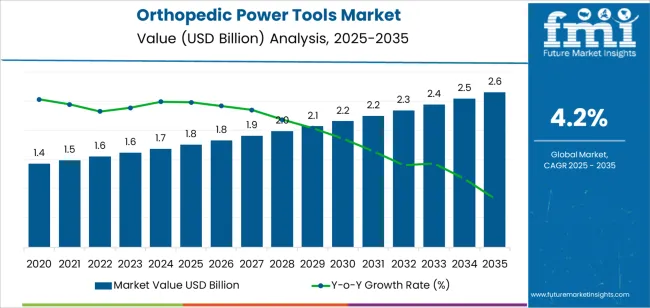
Quick Stats for Orthopedic Power Tools Market

  • Orthopedic Power Tools Market Industry Value (2025): USD 1.8 billion
  • Orthopedic Power Tools Market Forecast Value (2035): USD 2.6 billion
  • Orthopedic Power Tools Market Forecast CAGR: 4.2%
  • Leading Segment in Orthopedic Power Tools Market in 2025: Large Bone Orthopedic Power Tools (29.0%)
  • Key Growth Region in Orthopedic Power Tools Market: North America, Asia-Pacific, Europe
  • Top Key Players in Orthopedic Power Tools Market: Zimmer Biomet, Misonix, DePuy Synthes, Medtronic Plc, ConMed Corporation, B. Braun Melsungen AG, Johnson & Johnson, Stryker Corporation, De Soutter Medical, AlloTech Co. Ltd.

Orthopedic Power Tools Market Market Value Analysis

Metric Value
Orthopedic Power Tools Market Estimated Value in (2025 E) USD 1.8 billion
Orthopedic Power Tools Market Forecast Value in (2035 F) USD 2.6 billion
Forecast CAGR (2025 to 2035) 4.2%

Segmental Analysis

The market is segmented by Product, Modality, Technology, and End User and region. By Product, the market is divided into Large Bone Orthopedic Power Tools, Small Bone Orthopedic Power Tools, and High-Speed Orthopedic Power Tools. In terms of Modality, the market is classified into Reusable Power Orthopedic Tools and Single Use Orthopedic Power Tools. Based on Technology, the market is segmented into Battery-powered Systems, Electric-powered Systems, and Pneumatic-powered Systems. By End User, the market is divided into Hospitals, Ambulatory Surgical Centers, and Orthopedic Clinics. Regionally, the market is classified into North America, Latin America, Western Europe, Eastern Europe, Balkan & Baltic Countries, Russia & Belarus, Central Asia, East Asia, South Asia & Pacific, and the Middle East & Africa.
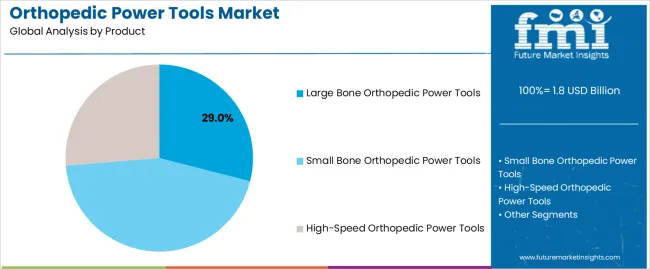
Insights into the Product Segment: Large Bone Orthopedic Power Tools

Orthopedic Power Tools Market Analysis By Product

The Large Bone Orthopedic Power Tools segment is projected to contribute 29.0% of the orthopedic power tools market revenue in 2025, maintaining its lead among product categories. This dominance has been shaped by the high demand for tools capable of handling complex and high-force orthopedic procedures such as joint replacement, femoral and tibial osteotomies, and trauma fixation.

Clinical usage data and surgical practice updates have shown that large bone procedures typically require powerful, torque-driven tools capable of cutting through dense skeletal structures with precision. Surgeons have favored this segment for its durability, adaptability to interchangeable attachments, and compatibility with advanced orthopedic implants.

Furthermore, as total hip and knee arthroplasties continue to rise in both hospital and outpatient settings, the need for reliable large bone tools has remained strong. Investment in this segment by manufacturers has led to continuous improvements in device weight, power-to-size ratio, and surgeon ergonomics, ensuring its continued relevance across a range of orthopedic subspecialties.
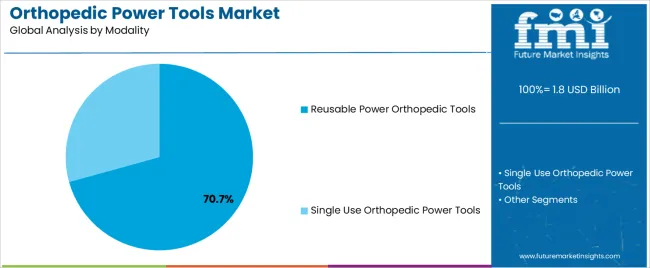
Insights into the Modality Segment: Reusable Power Orthopedic Tools

Orthopedic Power Tools Market Analysis By Modality

The Reusable Power Orthopedic Tools segment is expected to hold 70.7% of the orthopedic power tools market revenue in 2025, securing its position as the leading modality. Growth in this segment has been attributed to cost-efficiency over the long term, as reusable tools are engineered for extended use through multiple surgical cycles.

Hospitals and surgical centers have prioritized reusable tools to reduce per-case expenditure while maintaining consistency in performance. Manufacturer disclosures and surgical equipment tenders have confirmed that these tools are often preferred for their durability, adaptability across various procedures, and established sterilization protocols.

Additionally, the growing focus on environmental sustainability in healthcare has encouraged providers to reduce medical waste, thereby further supporting the adoption of reusable tools. Although initial capital investment is higher, the ability to amortize costs over time and the availability of service contracts for maintenance and repair have solidified the segment’s leading role in operating room procurement strategies.
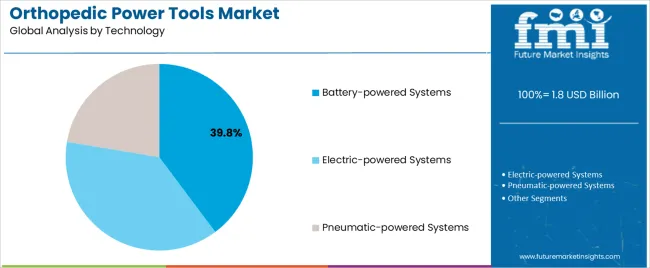
Insights into the Technology Segment: Battery-powered Systems

Orthopedic Power Tools Market Analysis By Technology

The Battery-powered Systems segment is anticipated to capture 39.8% of the orthopedic power tools market revenue in 2025, emerging as the dominant technology type. This growth has been driven by the increasing clinical preference for mobility, reduced setup complexity, and operational flexibility in surgical environments.

Technological advancements have enabled battery-powered systems to match the torque and performance standards of traditional pneumatic tools while offering greater freedom of movement and reduced dependence on external power sources. Surgeon feedback and operating room optimization studies have emphasized the value of cordless tools in improving workflow efficiency and minimizing the risk of cable-related contamination.

Furthermore, ongoing innovation in lithium-ion battery technology has improved charge retention, reduced charging time, and extended device runtime, addressing previous limitations of battery-powered devices. As healthcare systems aim to enhance surgical productivity and reduce turnaround times, the Battery-powered Systems segment is expected to maintain its upward trajectory, especially in high-volume orthopedic centers and ambulatory surgical units.

Orthopedic Power Tools Market Growth Factors

The rising prevalence of orthopedic disorders such as osteoarthritis, osteoporosis, and fractures due to accidents or sports injuries has contributed to the demand for orthopedic power tools. There has been a steady increase in the number of orthopedic surgeries performed worldwide, including joint replacement surgeries, spine surgeries, and trauma surgeries. This surge in surgical procedures necessitates the use of advanced tools and equipment, including orthopedic power tools, thereby fueling industry growth.

Stringent regulations governing the manufacturing and sale of medical devices have ensured product quality, safety, and efficacy. Regulatory bodies play a crucial role in assessing and approving orthopedic power tools, instilling confidence among healthcare professionals and patients and fostering industry growth. The integration of robotics and automation into orthopedic surgery is a significant trend.

Robotic-assisted orthopedic surgery offers increased precision, accuracy, and consistency in procedures such as joint replacements and spinal surgeries. These systems work in conjunction with orthopedic power tools to enhance surgical outcomes.

The adoption of 3D printing technology in orthopedic surgery is revolutionizing the design and manufacturing of implants, instruments, and surgical guides. Orthopedic power tools are increasingly being utilized in conjunction with 3D-printed components to achieve optimal surgical outcomes. This trend allows for rapid prototyping, customization, and complex geometries that were previously unattainable with traditional manufacturing methods.

Wireless orthopedic power tools equipped with Bluetooth or Wi-Fi connectivity are gaining traction. These tools enable seamless communication with other surgical devices, imaging systems, and electronic health records, streamlining workflow efficiency and enhancing surgical collaboration. Wireless power tools offer greater mobility and maneuverability in the operating room.

There is a growing demand for portable and handheld orthopedic power tools that offer flexibility and ease of use in various surgical settings, including operating rooms, ambulatory surgical centers, and clinics. Manufacturers are focusing on developing lightweight and ergonomic tools that optimize surgeon comfort and dexterity during procedures.

With growing environmental concerns, there is a shift towards sustainable and eco-friendly solutions in the healthcare industry, including orthopedic power tools. Manufacturers are exploring recyclable materials, energy-efficient manufacturing processes, and eco-conscious packaging to reduce the environmental footprint of their products. This trend aligns with the broader sustainability initiatives within the healthcare sector.

Country-wise Analysis

Healthcare Infrastructures and Technological Advancement in Orthopedic Power Tools to Drive Demand in the United States

The United States boasts a robust market for orthopedic power tools primarily due to its advanced healthcare infrastructure and a high prevalence of orthopedic conditions. The demand is further fueled by the country's large aging population, which necessitates an increasing number of orthopedic surgeries such as joint replacements and spinal procedures.

The United States is characterized by a strong emphasis on technological innovation, leading to the adoption of cutting-edge tools like robotic-assisted surgical systems. These factors contribute to a highly competitive market landscape, with leading orthopedic surgical device manufacturers vying to cater to the evolving needs of healthcare providers and patients.

Innovative Solutions for Musculoskeletal Health Key Drivers of Orthopedic Power Tools Growth in the United Kingdom

In the United Kingdom, the demand for orthopedic power tools is driven by the rising prevalence of musculoskeletal disorders and a focus on cost analysis of orthopedic surgical tools in healthcare solutions to drive the market. The country's healthcare system emphasizes efficiency and value for money, influencing the adoption of orthopedic power tools that offer superior performance while contributing to streamlined surgical procedures.

Collaborations between academic institutions and industry players also play a significant role in driving innovation in surgical power tools for orthopedics in the United Kingdom. Moreover, regulatory frameworks promoting patient safety and product quality shape the dynamics of the orthopedic power tools market in the United Kingdom.

Rapid Healthcare Infrastructure Development and Government Initiatives Boost Demand for Orthopedic Power Tools in China

In China orthopedic power tools is experiencing rapid growth fueled by demographic shifts, expanding healthcare infrastructure, and increasing healthcare expenditure. The country's aging population and changing lifestyle patterns contribute to a rising incidence of orthopedic conditions, driving the demand for surgical interventions and advanced power tools.

Government initiatives to improve healthcare access and quality further catalyze market growth, as does the growing disposable income and willingness to invest in high-quality healthcare services. Partnerships between domestic and international players facilitate technology transfer and innovation in the Chinese orthopedic power tools market, leading to a dynamic and competitive landscape.

Category-wise Insights

Technological Effect Is Generating Demand for Small Bone Orthopedic Power Tools

Small bone orthopedic power tools are playing a crucial role in the growth of the orthopedic power tools. These specialized tools are designed for precision and efficiency in surgeries involving smaller bones, such as those in the hands, feet, and facial regions. The growing prevalence of conditions like carpal tunnel syndrome, fractures, and arthritis has increased the demand for surgeries that require these precise tools. The use of small bone power tools allows surgeons to perform delicate procedures with greater accuracy, improving patient outcomes and reducing recovery times.

Technological advancements have led to the development of more ergonomic and user-friendly bone surgery tools. These innovations include improved battery life, lightweight designs, and enhanced maneuverability, which make them more appealing to surgeons. The ability to perform minimally invasive procedures with these tools is another significant factor driving their adoption. Minimally invasive techniques result in smaller incisions, less tissue damage, and faster patient recovery, making them increasingly popular in orthopedic surgeries.

The rise in sports injuries and age-related bone conditions is also contributing to the growth of the small bone orthopedic power tools. As the population ages, the need for orthopedic surgeries, particularly those involving small bones, continues to increase. The growing trend of outpatient and ambulatory surgical centers favors the use of compact and efficient tools that can be easily transported and used in various settings.

Surge in Electric-Powder Fuels Demand for Advanced Orthopedic Power Tools

Electric-powered systems are significantly enhancing the growth of the orthopedic power tools market. These systems offer several advantages over traditional pneumatic tools, making them increasingly popular among orthopedic surgeons. One key benefit is the consistent and reliable power output, which ensures more precise and efficient surgical procedures.

This precision is critical in orthopedic surgeries, where accuracy can significantly impact patient outcomes. Electric-powered tools are also typically lighter and more ergonomic, reducing surgeon fatigue during lengthy operations and improving overall efficiency.

The reduced noise and vibration levels of electric tools enhance the surgical environment, allowing for better focus and less distraction. This improvement in the working conditions can lead to better surgical results and increased adoption of these tools. Electric-powered systems often come with advanced features such as variable speed controls and integrated safety mechanisms, providing surgeons with greater control and reducing the risk of complications.

The advancements in battery technology have also contributed to the growth of electric-powered orthopedic tools. Modern batteries provide longer operational times and quicker recharging capabilities, ensuring that tools are always ready for use. These technological improvements make electric-powered systems more reliable and practical for busy surgical environments. The overall trend towards automation and precision in surgery aligns well with the benefits offered by electric-powered systems, ensuring their continued growth in the orthopedic power tools industry.
Competitive Landscape

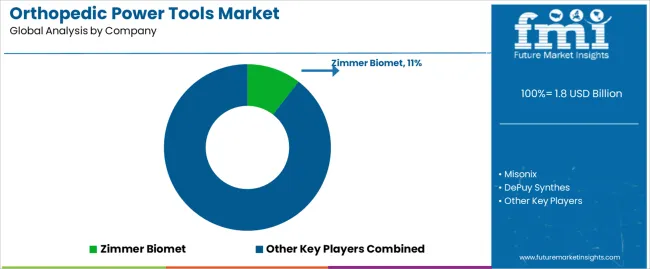
Orthopedic Power Tools Market Analysis By Company

Leading companies in orthopedic power tools market collaborate between research institutions, and healthcare providers has led to the development of innovative orthopedic power tools tailored to meet the specific needs of surgeons and patients. These collaborations facilitate the exchange of knowledge, expertise, and resources, driving market growth through the introduction of cutting-edge technologies.

Key Market Developments

  • In January 2025, Stryker saw its new products and Mako ortho surgical robot contribute to a solid finish for 2025, boosting expectations for 2025.
  • In February 2025, Zimmer Biomet Holdings, Inc. announced that its ROSA ® Shoulder System has received FDA clearance for robotic-assisted shoulder replacement. The ROSA Shoulder is the first robotic shoulder replacement system in the world, and is part of the ROSA® Robotics portfolio that also includes the ROSA® Knee System and the ROSA® Hip System.

Orthopedic Power Tools Market by Category

By Product:

In terms of product, the market encompasses small bone orthopedic power tools, large bone orthopedic power tools, and high-speed orthopedic power tools.

By Modality:

Modality types used in orthopedic power tools are categorized into single use orthopedic power tools and reusable power orthopedic tools.

By Technology:

Based on technology the market is segmented into pneumatic-powered systems, electric-powered systems and battery-powered systems.

By End-User:

In terms of end user, the market is segmented into hospitals, ambulatory surgical centre and orthopedic clinics

By Region:

In terms of region, the industry is divided into North America, Latin America, Western Europe, South Asia, East Asia, Eastern Europe and Middle East and Africa.

Frequently Asked Questions

How big is the orthopedic power tools market in 2025?

The global orthopedic power tools market is estimated to be valued at USD 1.8 billion in 2025.

What will be the size of orthopedic power tools market in 2035?

The market size for the orthopedic power tools market is projected to reach USD 2.6 billion by 2035.

How much will be the orthopedic power tools market growth between 2025 and 2035?

The orthopedic power tools market is expected to grow at a 4.2% CAGR between 2025 and 2035.

What are the key product types in the orthopedic power tools market?

The key product types in orthopedic power tools market are large bone orthopedic power tools, small bone orthopedic power tools and high-speed orthopedic power tools.

Which modality segment to contribute significant share in the orthopedic power tools market in 2025?

In terms of modality, reusable power orthopedic tools segment to command 70.7% share in the orthopedic power tools market in 2025.

Table of Content

  1. Executive Summary
    • Global Market Outlook
    • Demand to side Trends
    • Supply to side Trends
    • Technology Roadmap Analysis
    • Analysis and Recommendations
  2. Market Overview
    • Market Coverage / Taxonomy
    • Market Definition / Scope / Limitations
  3. Market Background
    • Market Dynamics
      • Drivers
      • Restraints
      • Opportunity
      • Trends
    • Scenario Forecast
      • Demand in Optimistic Scenario
      • Demand in Likely Scenario
      • Demand in Conservative Scenario
    • Opportunity Map Analysis
    • Product Life Cycle Analysis
    • Supply Chain Analysis
    • Investment Feasibility Matrix
    • Value Chain Analysis
    • PESTLE and Porter’s Analysis
    • Regulatory Landscape
    • Regional Parent Market Outlook
    • Production and Consumption Statistics
    • Import and Export Statistics
  4. Global Market Analysis 2020 to 2024 and Forecast, 2025 to 2035
    • Historical Market Size Value (USD Million) Analysis, 2020 to 2024
    • Current and Future Market Size Value (USD Million) Projections, 2025 to 2035
      • Y to o to Y Growth Trend Analysis
      • Absolute $ Opportunity Analysis
  5. Global Market Pricing Analysis 2020 to 2024 and Forecast 2025 to 2035
  6. Global Market Analysis 2020 to 2024 and Forecast 2025 to 2035, By Product
    • Introduction / Key Findings
    • Historical Market Size Value (USD Million) Analysis By Product , 2020 to 2024
    • Current and Future Market Size Value (USD Million) Analysis and Forecast By Product , 2025 to 2035
      • Large Bone Orthopedic Power Tools
      • Small Bone Orthopedic Power Tools
      • High-Speed Orthopedic Power Tools
    • Y to o to Y Growth Trend Analysis By Product , 2020 to 2024
    • Absolute $ Opportunity Analysis By Product , 2025 to 2035
  7. Global Market Analysis 2020 to 2024 and Forecast 2025 to 2035, By Modality
    • Introduction / Key Findings
    • Historical Market Size Value (USD Million) Analysis By Modality, 2020 to 2024
    • Current and Future Market Size Value (USD Million) Analysis and Forecast By Modality, 2025 to 2035
      • Reusable Power Orthopedic Tools
      • Single Use Orthopedic Power Tools
    • Y to o to Y Growth Trend Analysis By Modality, 2020 to 2024
    • Absolute $ Opportunity Analysis By Modality, 2025 to 2035
  8. Global Market Analysis 2020 to 2024 and Forecast 2025 to 2035, By Technology
    • Introduction / Key Findings
    • Historical Market Size Value (USD Million) Analysis By Technology, 2020 to 2024
    • Current and Future Market Size Value (USD Million) Analysis and Forecast By Technology, 2025 to 2035
      • Battery-powered Systems
      • Electric-powered Systems
      • Pneumatic-powered Systems
    • Y to o to Y Growth Trend Analysis By Technology, 2020 to 2024
    • Absolute $ Opportunity Analysis By Technology, 2025 to 2035
  9. Global Market Analysis 2020 to 2024 and Forecast 2025 to 2035, By End User
    • Introduction / Key Findings
    • Historical Market Size Value (USD Million) Analysis By End User, 2020 to 2024
    • Current and Future Market Size Value (USD Million) Analysis and Forecast By End User, 2025 to 2035
      • Hospitals
      • Ambulatory Surgical Centers
      • Orthopedic Clinics
    • Y to o to Y Growth Trend Analysis By End User, 2020 to 2024
    • Absolute $ Opportunity Analysis By End User, 2025 to 2035
  10. Global Market Analysis 2020 to 2024 and Forecast 2025 to 2035, By Region
    • Introduction
    • Historical Market Size Value (USD Million) Analysis By Region, 2020 to 2024
    • Current Market Size Value (USD Million) Analysis and Forecast By Region, 2025 to 2035
      • North America
      • Latin America
      • Western Europe
      • Eastern Europe
      • East Asia
      • South Asia and Pacific
      • Middle East & Africa
    • Market Attractiveness Analysis By Region
  11. North America Market Analysis 2020 to 2024 and Forecast 2025 to 2035, By Country
    • Historical Market Size Value (USD Million) Trend Analysis By Market Taxonomy, 2020 to 2024
    • Market Size Value (USD Million) Forecast By Market Taxonomy, 2025 to 2035
      • By Country
        • USA
        • Canada
        • Mexico
      • By Product
      • By Modality
      • By Technology
      • By End User
    • Market Attractiveness Analysis
      • By Country
      • By Product
      • By Modality
      • By Technology
      • By End User
    • Key Takeaways
  12. Latin America Market Analysis 2020 to 2024 and Forecast 2025 to 2035, By Country
    • Historical Market Size Value (USD Million) Trend Analysis By Market Taxonomy, 2020 to 2024
    • Market Size Value (USD Million) Forecast By Market Taxonomy, 2025 to 2035
      • By Country
        • Brazil
        • Chile
        • Rest of Latin America
      • By Product
      • By Modality
      • By Technology
      • By End User
    • Market Attractiveness Analysis
      • By Country
      • By Product
      • By Modality
      • By Technology
      • By End User
    • Key Takeaways
  13. Western Europe Market Analysis 2020 to 2024 and Forecast 2025 to 2035, By Country
    • Historical Market Size Value (USD Million) Trend Analysis By Market Taxonomy, 2020 to 2024
    • Market Size Value (USD Million) Forecast By Market Taxonomy, 2025 to 2035
      • By Country
        • Germany
        • UK
        • Italy
        • Spain
        • France
        • Nordic
        • BENELUX
        • Rest of Western Europe
      • By Product
      • By Modality
      • By Technology
      • By End User
    • Market Attractiveness Analysis
      • By Country
      • By Product
      • By Modality
      • By Technology
      • By End User
    • Key Takeaways
  14. Eastern Europe Market Analysis 2020 to 2024 and Forecast 2025 to 2035, By Country
    • Historical Market Size Value (USD Million) Trend Analysis By Market Taxonomy, 2020 to 2024
    • Market Size Value (USD Million) Forecast By Market Taxonomy, 2025 to 2035
      • By Country
        • Russia
        • Poland
        • Hungary
        • Balkan & Baltic
        • Rest of Eastern Europe
      • By Product
      • By Modality
      • By Technology
      • By End User
    • Market Attractiveness Analysis
      • By Country
      • By Product
      • By Modality
      • By Technology
      • By End User
    • Key Takeaways
  15. East Asia Market Analysis 2020 to 2024 and Forecast 2025 to 2035, By Country
    • Historical Market Size Value (USD Million) Trend Analysis By Market Taxonomy, 2020 to 2024
    • Market Size Value (USD Million) Forecast By Market Taxonomy, 2025 to 2035
      • By Country
        • China
        • Japan
        • South Korea
      • By Product
      • By Modality
      • By Technology
      • By End User
    • Market Attractiveness Analysis
      • By Country
      • By Product
      • By Modality
      • By Technology
      • By End User
    • Key Takeaways
  16. South Asia and Pacific Market Analysis 2020 to 2024 and Forecast 2025 to 2035, By Country
    • Historical Market Size Value (USD Million) Trend Analysis By Market Taxonomy, 2020 to 2024
    • Market Size Value (USD Million) Forecast By Market Taxonomy, 2025 to 2035
      • By Country
        • India
        • ASEAN
        • Australia & New Zealand
        • Rest of South Asia and Pacific
      • By Product
      • By Modality
      • By Technology
      • By End User
    • Market Attractiveness Analysis
      • By Country
      • By Product
      • By Modality
      • By Technology
      • By End User
    • Key Takeaways
  17. Middle East & Africa Market Analysis 2020 to 2024 and Forecast 2025 to 2035, By Country
    • Historical Market Size Value (USD Million) Trend Analysis By Market Taxonomy, 2020 to 2024
    • Market Size Value (USD Million) Forecast By Market Taxonomy, 2025 to 2035
      • By Country
        • Kingdom of Saudi Arabia
        • Other GCC Countries
        • Turkiye
        • South Africa
        • Other African Union
        • Rest of Middle East & Africa
      • By Product
      • By Modality
      • By Technology
      • By End User
    • Market Attractiveness Analysis
      • By Country
      • By Product
      • By Modality
      • By Technology
      • By End User
    • Key Takeaways
  18. Key Countries Market Analysis
    • USA
      • Pricing Analysis
      • Market Share Analysis, 2024
        • By Product
        • By Modality
        • By Technology
        • By End User
    • Canada
      • Pricing Analysis
      • Market Share Analysis, 2024
        • By Product
        • By Modality
        • By Technology
        • By End User
    • Mexico
      • Pricing Analysis
      • Market Share Analysis, 2024
        • By Product
        • By Modality
        • By Technology
        • By End User
    • Brazil
      • Pricing Analysis
      • Market Share Analysis, 2024
        • By Product
        • By Modality
        • By Technology
        • By End User
    • Chile
      • Pricing Analysis
      • Market Share Analysis, 2024
        • By Product
        • By Modality
        • By Technology
        • By End User
    • Germany
      • Pricing Analysis
      • Market Share Analysis, 2024
        • By Product
        • By Modality
        • By Technology
        • By End User
    • UK
      • Pricing Analysis
      • Market Share Analysis, 2024
        • By Product
        • By Modality
        • By Technology
        • By End User
    • Italy
      • Pricing Analysis
      • Market Share Analysis, 2024
        • By Product
        • By Modality
        • By Technology
        • By End User
    • Spain
      • Pricing Analysis
      • Market Share Analysis, 2024
        • By Product
        • By Modality
        • By Technology
        • By End User
    • France
      • Pricing Analysis
      • Market Share Analysis, 2024
        • By Product
        • By Modality
        • By Technology
        • By End User
    • India
      • Pricing Analysis
      • Market Share Analysis, 2024
        • By Product
        • By Modality
        • By Technology
        • By End User
    • ASEAN
      • Pricing Analysis
      • Market Share Analysis, 2024
        • By Product
        • By Modality
        • By Technology
        • By End User
    • Australia & New Zealand
      • Pricing Analysis
      • Market Share Analysis, 2024
        • By Product
        • By Modality
        • By Technology
        • By End User
    • China
      • Pricing Analysis
      • Market Share Analysis, 2024
        • By Product
        • By Modality
        • By Technology
        • By End User
    • Japan
      • Pricing Analysis
      • Market Share Analysis, 2024
        • By Product
        • By Modality
        • By Technology
        • By End User
    • South Korea
      • Pricing Analysis
      • Market Share Analysis, 2024
        • By Product
        • By Modality
        • By Technology
        • By End User
    • Russia
      • Pricing Analysis
      • Market Share Analysis, 2024
        • By Product
        • By Modality
        • By Technology
        • By End User
    • Poland
      • Pricing Analysis
      • Market Share Analysis, 2024
        • By Product
        • By Modality
        • By Technology
        • By End User
    • Hungary
      • Pricing Analysis
      • Market Share Analysis, 2024
        • By Product
        • By Modality
        • By Technology
        • By End User
    • Kingdom of Saudi Arabia
      • Pricing Analysis
      • Market Share Analysis, 2024
        • By Product
        • By Modality
        • By Technology
        • By End User
    • Turkiye
      • Pricing Analysis
      • Market Share Analysis, 2024
        • By Product
        • By Modality
        • By Technology
        • By End User
    • South Africa
      • Pricing Analysis
      • Market Share Analysis, 2024
        • By Product
        • By Modality
        • By Technology
        • By End User
  19. Market Structure Analysis
    • Competition Dashboard
    • Competition Benchmarking
    • Market Share Analysis of Top Players
      • By Regional
      • By Product
      • By Modality
      • By Technology
      • By End User
  20. Competition Analysis
    • Competition Deep Dive
      • Zimmer Biomet
        • Overview
        • Product Portfolio
        • Profitability by Market Segments (Product/Age /Sales Channel/Region)
        • Sales Footprint
        • Strategy Overview
          • Marketing Strategy
          • Product Strategy
          • Channel Strategy
      • Misonix
      • DePuy Synthes
      • Medtronic Plc
      • ConMed Corporation
      • B. Braun Melsungen AG
      • Johnson & Johnson
      • Stryker Corporation
      • De Soutter Medical
      • AlloTech Co. Ltd.
  21. Assumptions & Acronyms Used
  22. Research Methodology

List of Tables

  • Table 1: Global Market Value (USD Million) Forecast by Region, 2020 to 2035
  • Table 2: Global Market Value (USD Million) Forecast by Product , 2020 to 2035
  • Table 3: Global Market Value (USD Million) Forecast by Modality, 2020 to 2035
  • Table 4: Global Market Value (USD Million) Forecast by Technology, 2020 to 2035
  • Table 5: Global Market Value (USD Million) Forecast by End User, 2020 to 2035
  • Table 6: North America Market Value (USD Million) Forecast by Country, 2020 to 2035
  • Table 7: North America Market Value (USD Million) Forecast by Product , 2020 to 2035
  • Table 8: North America Market Value (USD Million) Forecast by Modality, 2020 to 2035
  • Table 9: North America Market Value (USD Million) Forecast by Technology, 2020 to 2035
  • Table 10: North America Market Value (USD Million) Forecast by End User, 2020 to 2035
  • Table 11: Latin America Market Value (USD Million) Forecast by Country, 2020 to 2035
  • Table 12: Latin America Market Value (USD Million) Forecast by Product , 2020 to 2035
  • Table 13: Latin America Market Value (USD Million) Forecast by Modality, 2020 to 2035
  • Table 14: Latin America Market Value (USD Million) Forecast by Technology, 2020 to 2035
  • Table 15: Latin America Market Value (USD Million) Forecast by End User, 2020 to 2035
  • Table 16: Western Europe Market Value (USD Million) Forecast by Country, 2020 to 2035
  • Table 17: Western Europe Market Value (USD Million) Forecast by Product , 2020 to 2035
  • Table 18: Western Europe Market Value (USD Million) Forecast by Modality, 2020 to 2035
  • Table 19: Western Europe Market Value (USD Million) Forecast by Technology, 2020 to 2035
  • Table 20: Western Europe Market Value (USD Million) Forecast by End User, 2020 to 2035
  • Table 21: Eastern Europe Market Value (USD Million) Forecast by Country, 2020 to 2035
  • Table 22: Eastern Europe Market Value (USD Million) Forecast by Product , 2020 to 2035
  • Table 23: Eastern Europe Market Value (USD Million) Forecast by Modality, 2020 to 2035
  • Table 24: Eastern Europe Market Value (USD Million) Forecast by Technology, 2020 to 2035
  • Table 25: Eastern Europe Market Value (USD Million) Forecast by End User, 2020 to 2035
  • Table 26: East Asia Market Value (USD Million) Forecast by Country, 2020 to 2035
  • Table 27: East Asia Market Value (USD Million) Forecast by Product , 2020 to 2035
  • Table 28: East Asia Market Value (USD Million) Forecast by Modality, 2020 to 2035
  • Table 29: East Asia Market Value (USD Million) Forecast by Technology, 2020 to 2035
  • Table 30: East Asia Market Value (USD Million) Forecast by End User, 2020 to 2035
  • Table 31: South Asia and Pacific Market Value (USD Million) Forecast by Country, 2020 to 2035
  • Table 32: South Asia and Pacific Market Value (USD Million) Forecast by Product , 2020 to 2035
  • Table 33: South Asia and Pacific Market Value (USD Million) Forecast by Modality, 2020 to 2035
  • Table 34: South Asia and Pacific Market Value (USD Million) Forecast by Technology, 2020 to 2035
  • Table 35: South Asia and Pacific Market Value (USD Million) Forecast by End User, 2020 to 2035
  • Table 36: Middle East & Africa Market Value (USD Million) Forecast by Country, 2020 to 2035
  • Table 37: Middle East & Africa Market Value (USD Million) Forecast by Product , 2020 to 2035
  • Table 38: Middle East & Africa Market Value (USD Million) Forecast by Modality, 2020 to 2035
  • Table 39: Middle East & Africa Market Value (USD Million) Forecast by Technology, 2020 to 2035
  • Table 40: Middle East & Africa Market Value (USD Million) Forecast by End User, 2020 to 2035

List of Figures

  • Figure 1: Global Market Pricing Analysis
  • Figure 2: Global Market Value (USD Million) Forecast 2020-2035
  • Figure 3: Global Market Value Share and BPS Analysis by Product , 2025 and 2035
  • Figure 4: Global Market Y to o to Y Growth Comparison by Product , 2025-2035
  • Figure 5: Global Market Attractiveness Analysis by Product
  • Figure 6: Global Market Value Share and BPS Analysis by Modality, 2025 and 2035
  • Figure 7: Global Market Y to o to Y Growth Comparison by Modality, 2025-2035
  • Figure 8: Global Market Attractiveness Analysis by Modality
  • Figure 9: Global Market Value Share and BPS Analysis by Technology, 2025 and 2035
  • Figure 10: Global Market Y to o to Y Growth Comparison by Technology, 2025-2035
  • Figure 11: Global Market Attractiveness Analysis by Technology
  • Figure 12: Global Market Value Share and BPS Analysis by End User, 2025 and 2035
  • Figure 13: Global Market Y to o to Y Growth Comparison by End User, 2025-2035
  • Figure 14: Global Market Attractiveness Analysis by End User
  • Figure 15: Global Market Value (USD Million) Share and BPS Analysis by Region, 2025 and 2035
  • Figure 16: Global Market Y to o to Y Growth Comparison by Region, 2025-2035
  • Figure 17: Global Market Attractiveness Analysis by Region
  • Figure 18: North America Market Incremental Dollar Opportunity, 2025-2035
  • Figure 19: Latin America Market Incremental Dollar Opportunity, 2025-2035
  • Figure 20: Western Europe Market Incremental Dollar Opportunity, 2025-2035
  • Figure 21: Eastern Europe Market Incremental Dollar Opportunity, 2025-2035
  • Figure 22: East Asia Market Incremental Dollar Opportunity, 2025-2035
  • Figure 23: South Asia and Pacific Market Incremental Dollar Opportunity, 2025-2035
  • Figure 24: Middle East & Africa Market Incremental Dollar Opportunity, 2025-2035
  • Figure 25: North America Market Value Share and BPS Analysis by Country, 2025 and 2035
  • Figure 26: North America Market Value Share and BPS Analysis by Product , 2025 and 2035
  • Figure 27: North America Market Y to o to Y Growth Comparison by Product , 2025-2035
  • Figure 28: North America Market Attractiveness Analysis by Product
  • Figure 29: North America Market Value Share and BPS Analysis by Modality, 2025 and 2035
  • Figure 30: North America Market Y to o to Y Growth Comparison by Modality, 2025-2035
  • Figure 31: North America Market Attractiveness Analysis by Modality
  • Figure 32: North America Market Value Share and BPS Analysis by Technology, 2025 and 2035
  • Figure 33: North America Market Y to o to Y Growth Comparison by Technology, 2025-2035
  • Figure 34: North America Market Attractiveness Analysis by Technology
  • Figure 35: North America Market Value Share and BPS Analysis by End User, 2025 and 2035
  • Figure 36: North America Market Y to o to Y Growth Comparison by End User, 2025-2035
  • Figure 37: North America Market Attractiveness Analysis by End User
  • Figure 38: Latin America Market Value Share and BPS Analysis by Country, 2025 and 2035
  • Figure 39: Latin America Market Value Share and BPS Analysis by Product , 2025 and 2035
  • Figure 40: Latin America Market Y to o to Y Growth Comparison by Product , 2025-2035
  • Figure 41: Latin America Market Attractiveness Analysis by Product
  • Figure 42: Latin America Market Value Share and BPS Analysis by Modality, 2025 and 2035
  • Figure 43: Latin America Market Y to o to Y Growth Comparison by Modality, 2025-2035
  • Figure 44: Latin America Market Attractiveness Analysis by Modality
  • Figure 45: Latin America Market Value Share and BPS Analysis by Technology, 2025 and 2035
  • Figure 46: Latin America Market Y to o to Y Growth Comparison by Technology, 2025-2035
  • Figure 47: Latin America Market Attractiveness Analysis by Technology
  • Figure 48: Latin America Market Value Share and BPS Analysis by End User, 2025 and 2035
  • Figure 49: Latin America Market Y to o to Y Growth Comparison by End User, 2025-2035
  • Figure 50: Latin America Market Attractiveness Analysis by End User
  • Figure 51: Western Europe Market Value Share and BPS Analysis by Country, 2025 and 2035
  • Figure 52: Western Europe Market Value Share and BPS Analysis by Product , 2025 and 2035
  • Figure 53: Western Europe Market Y to o to Y Growth Comparison by Product , 2025-2035
  • Figure 54: Western Europe Market Attractiveness Analysis by Product
  • Figure 55: Western Europe Market Value Share and BPS Analysis by Modality, 2025 and 2035
  • Figure 56: Western Europe Market Y to o to Y Growth Comparison by Modality, 2025-2035
  • Figure 57: Western Europe Market Attractiveness Analysis by Modality
  • Figure 58: Western Europe Market Value Share and BPS Analysis by Technology, 2025 and 2035
  • Figure 59: Western Europe Market Y to o to Y Growth Comparison by Technology, 2025-2035
  • Figure 60: Western Europe Market Attractiveness Analysis by Technology
  • Figure 61: Western Europe Market Value Share and BPS Analysis by End User, 2025 and 2035
  • Figure 62: Western Europe Market Y to o to Y Growth Comparison by End User, 2025-2035
  • Figure 63: Western Europe Market Attractiveness Analysis by End User
  • Figure 64: Eastern Europe Market Value Share and BPS Analysis by Country, 2025 and 2035
  • Figure 65: Eastern Europe Market Value Share and BPS Analysis by Product , 2025 and 2035
  • Figure 66: Eastern Europe Market Y to o to Y Growth Comparison by Product , 2025-2035
  • Figure 67: Eastern Europe Market Attractiveness Analysis by Product
  • Figure 68: Eastern Europe Market Value Share and BPS Analysis by Modality, 2025 and 2035
  • Figure 69: Eastern Europe Market Y to o to Y Growth Comparison by Modality, 2025-2035
  • Figure 70: Eastern Europe Market Attractiveness Analysis by Modality
  • Figure 71: Eastern Europe Market Value Share and BPS Analysis by Technology, 2025 and 2035
  • Figure 72: Eastern Europe Market Y to o to Y Growth Comparison by Technology, 2025-2035
  • Figure 73: Eastern Europe Market Attractiveness Analysis by Technology
  • Figure 74: Eastern Europe Market Value Share and BPS Analysis by End User, 2025 and 2035
  • Figure 75: Eastern Europe Market Y to o to Y Growth Comparison by End User, 2025-2035
  • Figure 76: Eastern Europe Market Attractiveness Analysis by End User
  • Figure 77: East Asia Market Value Share and BPS Analysis by Country, 2025 and 2035
  • Figure 78: East Asia Market Value Share and BPS Analysis by Product , 2025 and 2035
  • Figure 79: East Asia Market Y to o to Y Growth Comparison by Product , 2025-2035
  • Figure 80: East Asia Market Attractiveness Analysis by Product
  • Figure 81: East Asia Market Value Share and BPS Analysis by Modality, 2025 and 2035
  • Figure 82: East Asia Market Y to o to Y Growth Comparison by Modality, 2025-2035
  • Figure 83: East Asia Market Attractiveness Analysis by Modality
  • Figure 84: East Asia Market Value Share and BPS Analysis by Technology, 2025 and 2035
  • Figure 85: East Asia Market Y to o to Y Growth Comparison by Technology, 2025-2035
  • Figure 86: East Asia Market Attractiveness Analysis by Technology
  • Figure 87: East Asia Market Value Share and BPS Analysis by End User, 2025 and 2035
  • Figure 88: East Asia Market Y to o to Y Growth Comparison by End User, 2025-2035
  • Figure 89: East Asia Market Attractiveness Analysis by End User
  • Figure 90: South Asia and Pacific Market Value Share and BPS Analysis by Country, 2025 and 2035
  • Figure 91: South Asia and Pacific Market Value Share and BPS Analysis by Product , 2025 and 2035
  • Figure 92: South Asia and Pacific Market Y to o to Y Growth Comparison by Product , 2025-2035
  • Figure 93: South Asia and Pacific Market Attractiveness Analysis by Product
  • Figure 94: South Asia and Pacific Market Value Share and BPS Analysis by Modality, 2025 and 2035
  • Figure 95: South Asia and Pacific Market Y to o to Y Growth Comparison by Modality, 2025-2035
  • Figure 96: South Asia and Pacific Market Attractiveness Analysis by Modality
  • Figure 97: South Asia and Pacific Market Value Share and BPS Analysis by Technology, 2025 and 2035
  • Figure 98: South Asia and Pacific Market Y to o to Y Growth Comparison by Technology, 2025-2035
  • Figure 99: South Asia and Pacific Market Attractiveness Analysis by Technology
  • Figure 100: South Asia and Pacific Market Value Share and BPS Analysis by End User, 2025 and 2035
  • Figure 101: South Asia and Pacific Market Y to o to Y Growth Comparison by End User, 2025-2035
  • Figure 102: South Asia and Pacific Market Attractiveness Analysis by End User
  • Figure 103: Middle East & Africa Market Value Share and BPS Analysis by Country, 2025 and 2035
  • Figure 104: Middle East & Africa Market Value Share and BPS Analysis by Product , 2025 and 2035
  • Figure 105: Middle East & Africa Market Y to o to Y Growth Comparison by Product , 2025-2035
  • Figure 106: Middle East & Africa Market Attractiveness Analysis by Product
  • Figure 107: Middle East & Africa Market Value Share and BPS Analysis by Modality, 2025 and 2035
  • Figure 108: Middle East & Africa Market Y to o to Y Growth Comparison by Modality, 2025-2035
  • Figure 109: Middle East & Africa Market Attractiveness Analysis by Modality
  • Figure 110: Middle East & Africa Market Value Share and BPS Analysis by Technology, 2025 and 2035
  • Figure 111: Middle East & Africa Market Y to o to Y Growth Comparison by Technology, 2025-2035
  • Figure 112: Middle East & Africa Market Attractiveness Analysis by Technology
  • Figure 113: Middle East & Africa Market Value Share and BPS Analysis by End User, 2025 and 2035
  • Figure 114: Middle East & Africa Market Y to o to Y Growth Comparison by End User, 2025-2035
  • Figure 115: Middle East & Africa Market Attractiveness Analysis by End User
  • Figure 116: Global Market - Tier Structure Analysis
  • Figure 117: Global Market - Company Share Analysis
Dashboard
Dashboard
Dashboard
Dashboard
Dashboard
Dashboard

Full Research Suite comprises of:

Market outlook & trends analysis

Market outlook & trends analysis

Interviews & case studies

Interviews & case studies

Strategic recommendations

Strategic recommendations

Vendor profiles & capabilities analysis

Vendor profiles & capabilities analysis

5-year forecasts

5-year forecasts

8 regions and 60+ country-level data splits

8 regions and 60+ country-level data splits

Market segment data splits

Market segment data splits

12 months of continuous data updates

12 months of continuous data updates

DELIVERED AS:

PDF EXCEL ONLINE

Full Research Suite


$5000

$7500

$10000

Buy Report Now
Similar Industry Reports

Similar Industry Reports

Orthopedic Braces and Support Market

Orthopedic Braces and Support Market Forecast and Outlook 2025 to 2035

Orthopedic Contract Manufacturing Market

Orthopedic Contract Manufacturing Market Size and Share Forecast Outlook 2025 to 2035

Orthopedic Digit Implants Market

Orthopedic Digit Implants Market Size and Share Forecast Outlook 2025 to 2035

Orthopedic Prosthetic Device Market

Orthopedic Prosthetic Device Market Analysis - Size, Share, and Forecast Outlook 2025 to 2035

Orthopedic Splints Market

Orthopedic Splints Market Size and Share Forecast Outlook 2025 to 2035

Orthopedic Software Market

Orthopedic Software Market Size and Share Forecast Outlook 2025 to 2035

Orthopedic Navigation Systems Market

Orthopedic Navigation Systems Market Analysis – Trends, Growth & Forecast 2025 to 2035

Orthopedic Trauma Device Market

Orthopedic Trauma Device Market Trends - Size, Share & Forecast 2025 to 2035

Orthopedic Insole Market

Orthopedic Insole Market Analysis – Size & Industry Trends 2025–2035

Orthopedic Shoes Market

Orthopedic Shoes Market Growth – Trends & Forecast 2025 to 2035

Orthopedic Oncology Market

Orthopedic Oncology Market Growth - Trends & Forecast 2025 to 2035

Orthopedic Insole Market Share Analysis

A Global Brand Share Analysis for Orthopedic Insole Market

Orthopedic Consumables Market

Orthopedic Consumables Market Trends – Industry Growth & Forecast 2024 to 2034

Orthopedic Prosthetics Market

Orthopedic Prosthetics Market Analysis - Size, Share, and Forecast 2024 to 2034

3D Orthopedic Scanning Systems Market

3D Orthopedic Scanning Systems Market

Smart Orthopedic Implants Market

Smart Orthopedic Implants Market

Canine Orthopedic Implants Market

Canine Orthopedic Implants Market Size and Share Forecast Outlook 2025 to 2035

Veterinary Orthopedic Drills Market

Veterinary Orthopedic Drills Market Size and Share Forecast Outlook 2025 to 2035

Veterinary Orthopedic Market

Veterinary Orthopedic Market Overview – Trends, Applications & Forecast 2024-2034

Veterinary Orthopedic Injectable Drug Market

Veterinary Orthopedic Injectable Drug Market

Future Market Insights

Orthopedic Power Tools Market

Chat With MaRIA

Chat With

MaRIA

Hi There, I am MaRIA, Your Market Research Intelligence Assistant. How may I help you?