Lactation Support Supplements Market Size and Share Forecast Outlook 2025 to 2035

The global lactation support supplements market is valued at USD 1.7 billion in 2025 and is slated to reach USD 3.1 billion by 2035, reflecting a CAGR of 6.0%.
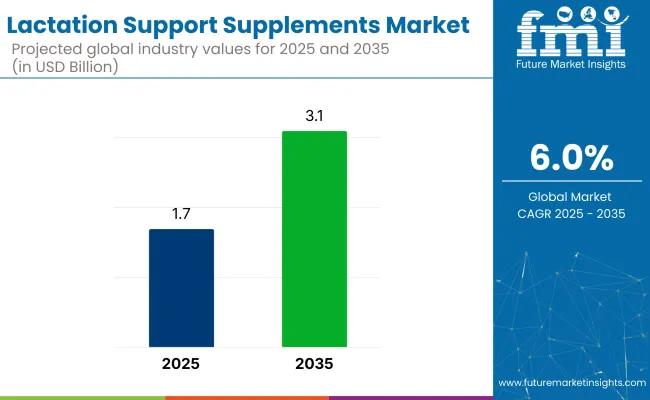
Quick Stats for Lactation Support Supplements Market

  • Market Value (2025): USD 1.7 billion
  • Forecast Value (2035): USD 3.1 billion
  • Forecast CAGR: 6.0%
  • Ingredient Type Leader in 2025: Herbal Supplements (46% Market Share)
  • Top Form Segment: Tablets/Capsules(40% Market Share in 2025)
  • Key Growth Region: East Asia (Japan is the fastest-growing market with 6.2% CAGR)

Lactation Support Supplements Market

Metric Value
2025 Market Size USD 1. 7 billion
2035 Market Size USD 3. 1 billion
CAGR (2025 to 2035) 6.0%

This growth is expected to be driven by increasing awareness of maternal health, rising breastfeeding promotion campaigns, and innovations in herbal lactation formulations. Additionally, demand will be supported by online pharmacy expansion, customized supplement programs, and integration of traditional herbs with modern supplement delivery formats.

Japan is projected to register a CAGR of 6.2%, driven by high per capita maternal health spending and a preference for traditional herbal formulations. The UK is expected to grow at a CAGR of 5.5% due to rising maternal health awareness and demand for organic supplements.

Germany will record a CAGR of 5.3%, supported by strong healthcare spending and preference for scientifically validated herbal products. Herbal supplements will dominate the ingredients segment with a 46% market share, while tablets/capsules will lead the form segment with a 40% share in 2025.

The lactation support supplements market holds a small but significant share within its parent markets. It accounts for approximately 4-5% of the overall food supplement and nutrition market, given its specialised focus on maternal health.

Within the maternal health supplements segment, it captures a larger share of around 15-20%, driven by the high demand for breastfeeding support. In the broader dietary supplements market, its share remains below 2%, as it serves a niche audience. However, its contribution to the healthcare and wellness market is growing steadily due to rising awareness and innovation in lactation-specific products worldwide.

Lactation Support Supplements Market Analysis by Top Investment Segments

The lactation support supplements market is segmented by ingredient type, form, distribution channel, and region. By ingredient type, the market is segmented into herbal supplements, vitamin & mineral supplements, and combination products. By form, it is classified into tablets/capsules, powders, liquids, gummies, and others, which include sprays, lozenges, chewable strips, effervescent tablets, amino acid-based supplements, and probiotic blends.

By distribution channel, it is divided into retail pharmacies, supermarkets/hypermarkets, specialty stores, online pharmacies, brand websites, and others, comprising direct sales via lactation consultants, hospital pharmacies, community health program distributions, multi-level marketing channels, and local co-operative outlets. By region, the market is analyzed across North America, Latin America, Western Europe, Eastern Europe, Balkans & Baltic, Russia & Belarus, Central Asia, East Asia, South Asia & Pacific, and Middle East & Africa.

Herbal Supplements to Lead the Ingredient Type Segment with 46% Market Share in 2025

Herbal supplements are projected to remain the most lucrative segment, accounting for 46% of the market share in 2025.
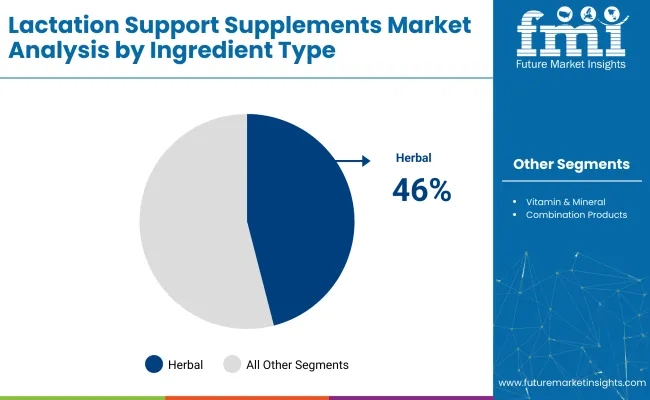
  • This dominance is driven by the rising preference for natural and plant-based ingredients among breastfeeding mothers, combined with lower regulatory barriers compared to synthetic alternatives.
  • Additionally, herbal supplements such as fenugreek, blessed thistle, and shatavari are widely accepted across cultures for their lactation-enhancing properties, supporting their sustained demand in the global market.

Lactation Support Supplements Market By Ingredient Type

Tablets/Capsules to Lead the Form Segment with 40% Market Share by 2035

Tablets/capsules are expected to be the most lucrative segment, holding around 40% of the market share by 2035.
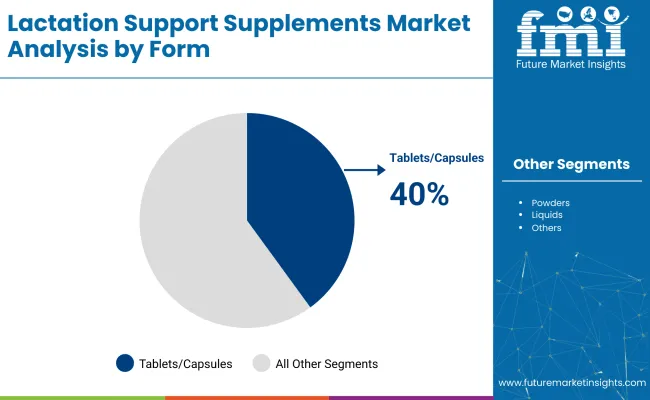
  • This preference is driven by their longer shelf life, easy storage, and convenient consumption, which appeal to busy breastfeeding mothers seeking reliable daily supplementation.
  • Additionally, tablets and capsules ensure ingredient stability, reduce wastage, and enable precise dosage, making them the preferred choice for both manufacturers and consumers within the lactation support supplements market.

Lactation Support Supplements Market By Form

Online Pharmacies to Lead the Distribution Channel Segment with 28% Market Share by 2035

Online pharmacies are projected to be the most lucrative segment, holding approximately 28% of the market share by 2035.

  • This strong share is driven by the increasing preference for convenient home delivery, easy access to detailed product information, and the availability of customer reviews that build trust among mothers.
  • Additionally, online pharmacies offering subscription services and personalised recommendations further strengthen their position as the preferred distribution channel for lactation support supplements globally.

Top Lactation Support Supplements Market Dynamics

The global lactation support supplements market is growing steadily, driven by increasing awareness of maternal health, rising demand for natural lactation-enhancing supplements, and innovations in herbal formulations with convenient delivery formats.

Recent Trends in the Lactation Support Supplements Market

  • Manufacturers are introducing customised supplements tailored to different breastfeeding stages.
  • Traditional herbs are being integrated with modern supplement formats like gummies and drinks.
  • Online pharmacies are expanding rapidly with subscription-based lactation support programs.
  • Clean-label certifications and organic formulations are gaining popularity among consumers.
  • Companies are investing in R&D to develop probiotic-enhanced and multi-ingredient lactation supplements.

Challenges in theLactation Support Supplements Market
  • Limited clinical validation for some traditional herbal ingredients hinders wider acceptance.
  • Stringent regulations in certain countries delay product approvals and launches.
  • Rising raw material costs are increasing production expenses for manufacturers.
  • Intense competition from local and international brands affects market share stability.

Analyzing Top Countries Producing and Distributing Lactation Support Supplements

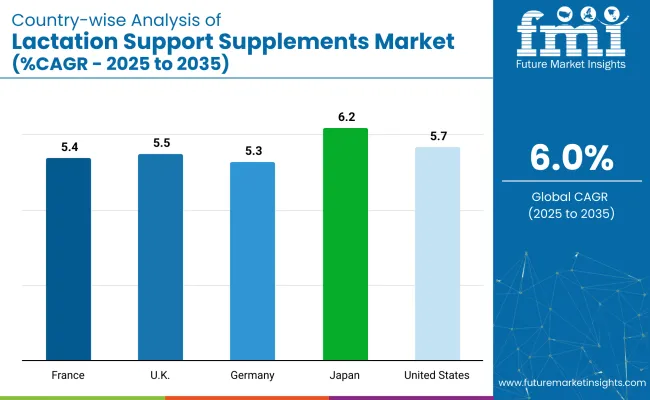
Country Wise Analysis Of Lactation Support Supplements Market

Among the top countries, Japan is projected to record the highest growth rate with a CAGR of 6.2%, driven by high maternal health spending and preference for traditional herbal supplements. The USA follows with a CAGR of 5.7%, supported by its mature supplements industry and strong research capabilities.

The UK is expected to grow at 5.5%, aided by government initiatives and demand for organic products, while France will record a CAGR of 5.4%, driven by consumer preference for natural supplements. Germany has the slowest growth among these countries at 5.3%, despite strong healthcare spending and product validation.

The report covers an in-depth analysis of 40+ countries; five top-performing OECD countries are highlighted below.

USA Lactation Support Supplements Market Analysis

The USA lactation support supplements market is projected to grow at a CAGR of 5.7% during the forecast period.

  • High demand driven by advanced consumer education.
  • Presence of leading companies like Nestlé Health Science and Perrigo.
  • Strong distribution networks through retail and online pharmacies.
  • Innovation in probiotic and organic lactation supplement formulations.

Lactation Support Supplements Demand Analysis in the UK

Sales of lactation support supplements in the UK are expected to register a CAGR of 5.5% during the forecast period.

  • Increasing adoption of herbal lactation supplements.
  • Regulations promoting high product quality standards.
  • Rising investments in organic supplement production.
  • Companies focusing on personalised lactation support programs.

Lactation Support Supplements Demand Analysis in Germany

Sales of lactation support supplementsin Germany are anticipated to grow at a CAGR of 5.3% during the forecast period.

  • Preference for scientifically validated herbal supplements.
  • Expansion of supermarkets and specialty store distribution.
  • Strong regulatory framework ensuring product safety.
  • Leading companies investing in probiotic lactation formulations.

France Lactation Support Supplements Market Analysis

France's lactation support supplements revenue is projected to grow at a CAGR of 5.4% during 2025-2035.

  • Rising demand for fenugreek-based lactation supplements.
  • Expansion of brand websites and online pharmacy sales.
  • Companies launching multi-ingredient combination products.
  • Increasing awareness campaigns on maternal nutrition.

Japan Lactation Support Supplements Market Analysis

The lactation support supplements revenue in Japan is forecasted to expand at a CAGR of 6.2% during the forecast period.

  • Preference for herbs like shatavari and blessed thistle in supplements.
  • Strong distribution networks through pharmacies and e-commerce.
  • Rising popularity of gummies and drink mix formats.
  • Leading companies focusing on clean-label and organic certifications.

Leading Lactation Support SupplementManufacturers and Suppliers 

The market is moderately fragmented, with competition among tier-one companies such as Fairhaven Health, UpSpring, Motherlove, Majka, and Legendairy Milk, alongside many regional and niche brands. Top companies compete through pricing strategies, product innovation, clean-label certifications, partnerships, and international expansion initiatives to strengthen their market position.

Companies such as Fairhaven Health and UpSpring focus on innovative formulations combining traditional herbs with modern delivery formats like powders, capsules, and probiotic blends. Strategies adopted include expansion of online sales channels, development of personalised lactation programs, and acquisitions to broaden product portfolios.

Recent Lactation Support Supplements Industry News

  • In April 2024, iHerb, LLC. announced the launch of Mommy's Bliss Lactation Hydration Drink Tablets to expand their product portfolio.
  • In February 2024, Bobbie, a mom-founded pediatric nutrition company, announced its expansion beyond infant formula with the launch of two organic infant supplements: Vitamin D Drops and Probiotic Drops.

Lactation Support Supplements Market Report Scope

Report Attributes Details
Current Total Market Size (2025) USD 1.7 billion
Projected Market Size (2035) USD 3.1 billion
CAGR (2025 to 2035) 6.0%
Base Year for Estimation 2024
Historical Period 2020 to 2024
Projections Period 2024 to 2035
Market Analysis Parameters Revenue in USD billions/Volume in Metric Tons
By Ingredient Type Herbal Supplements, Vitamin & Mineral Supplements, and Combination Products
By Form Tablets/Capsules, Powders, Liquids, Gummies, Others (Sprays, Lozenges, Chewable Strips, Effervescent Tablets)
By Distribution Channel Retail Pharmacies, Supermarkets/Hypermarkets, Specialty Stores, Online Pharmacies, Brand Websites, Others (Direct Sales Through Lactation Consultants, Hospital Pharmacies, Community Health Program Distributions, and Multi-Level Marketing Channels)
Regions Covered North America, Latin America, Western Europe, Eastern Europe, East Asia, South Asia & Pacific, Middle East & Africa
Countries Covered United States, Canada, United Kingdom, Germany, France, China, Japan, South Korea, Brazil, Australia
Key Players Fairhaven Health, UpSpring, Motherlove, Majka, Legendairy Milk, Pink Stork, Happy Family Organics, Naturelo, Earth Mama, Wellements, Metagenics, Nature's Way, Solgar, Freemie, and Milkful
Additional Attributes Dollar sales by value, market share analysis by region, and country-wise analysis

Key Segments

By Ingredient Type:

As per Ingredient Type, the industry has been categorized into Herbal Supplements, Vitamin & Mineral Supplements and Combination Products.

By Form:

As per Form, the industry has been categorized into Tablets / Capsules, Powders, Liquids, Gummies and Others.

By Distribution Channel:

As per Distribution Channel, the industry has been categorized into Retail Pharmacies, Supermarkets / Hypermarkets, Specialty Stores, Online Pharmacies, Brand Websites and Others.

By Region:

Industry analysis has been carried out in key countries of North America, Latin America, Western Europe Eastern Europe, Balkans & Baltic, Russia & Belarus, Central Asia, East Asia, South Asia & Pacific and Middle East & Africa.

Table of Content

  1. Executive Summary
    • Global Market Outlook
    • Demand-side Trends
    • Supply-side Trends
    • Technology Roadmap Analysis
    • Analysis and Recommendations
  2. Market Overview
    • Market Coverage / Taxonomy
    • Market Definition / Scope / Limitations
  3. Market Background
    • Market Dynamics
      • Drivers
      • Restraints
      • Opportunity
      • Trends
    • Scenario Forecast
      • Demand in Optimistic Scenario
      • Demand in Likely Scenario
      • Demand in Conservative Scenario
    • Opportunity Map Analysis
    • Product Life Cycle Analysis
    • Supply Chain Analysis
      • Supply Side Participants and their Roles
        • Producers
        • Mid-Level Participants (Traders/ Agents/ Brokers)
        • Wholesalers and Distributors
      • Value Added and Value Created at Node in the Supply Chain
      • List of Raw Material Suppliers
      • List of Existing and Potential Buyers
    • Investment Feasibility Matrix
    • Value Chain Analysis
      • Profit Margin Analysis
      • Wholesalers and Distributors
      • Retailers
    • PESTLE and Porter’s Analysis
    • Regulatory Landscape
      • By Key Regions
      • By Key Countries
    • Regional Parent Market Outlook
    • Production and Consumption Statistics
    • Import and Export Statistics
  4. Global Market Analysis 2020 to 2024 and Forecast, 2025 to 2035
    • Historical Market Size Value (USD Billion) & Volume (Metric Tons) Analysis, 2020 to 2024
    • Current and Future Market Size Value (USD Billion) & Volume (Metric Tons) Projections, 2025 to 2035
      • Y-o-Y Growth Trend Analysis
      • Absolute $ Opportunity Analysis
  5. Global Market Pricing Analysis 2020 to 2024 and Forecast 2025 to 2035
  6. Global Market Analysis 2020 to 2024 and Forecast 2025 to 2035, By Ingredient Type
    • Introduction / Key Findings
    • Historical Market Size Value (USD Billion) & Volume (Metric Tons) Analysis By Ingredient Type, 2020 to 2024
    • Current and Future Market Size Value (USD Billion) & Volume (Metric Tons) Analysis and Forecast By Ingredient Type, 2025 to 2035
      • Herbal Supplements
      • Vitamin & Mineral Supplements
      • Combination Products
    • Y-o-Y Growth Trend Analysis By Ingredient Type, 2020 to 2024
    • Absolute $ Opportunity Analysis By Ingredient Type, 2025 to 2035
  7. Global Market Analysis 2020 to 2024 and Forecast 2025 to 2035, By Form
    • Introduction / Key Findings
    • Historical Market Size Value (USD Billion) & Volume (Metric Tons) Analysis By Form, 2020 to 2024
    • Current and Future Market Size Value (USD Billion) & Volume (Metric Tons) Analysis and Forecast By Form, 2025 to 2035
      • Tablets / Capsules
      • Powders
      • Liquids
      • Gummies
      • Others
        • Sprays
        • Lozenges
        • Chewable Strips
        • Effervescent Tablets
    • Y-o-Y Growth Trend Analysis By Form, 2020 to 2024
    • Absolute $ Opportunity Analysis By Form, 2025 to 2035
  8. Global Market Analysis 2020 to 2024 and Forecast 2025 to 2035, By Distribution Channel
    • Introduction / Key Findings
    • Historical Market Size Value (USD Billion) & Volume (Metric Tons) Analysis By Distribution Channel, 2020 to 2024
    • Current and Future Market Size Value (USD Billion) & Volume (Metric Tons) Analysis and Forecast By Distribution Channel, 2025 to 2035
      • Retail Pharmacies
      • Supermarkets / Hypermarkets
      • Specialty Stores
      • Online Pharmacies
      • Brand Websites
      • Others
        • Lactation Consultants
        • Hospital Pharmacies
        • Community Health Program Distributions
        • Multi-level Marketing Channels
    • Y-o-Y Growth Trend Analysis By Distribution Channel, 2020 to 2024
    • Absolute $ Opportunity Analysis By Distribution Channel, 2025 to 2035
  9. Global Market Analysis 2020 to 2024 and Forecast 2025 to 2035, By Region
    • Introduction
    • Historical Market Size Value (USD Billion) & Volume (Metric Tons) Analysis By Region, 2020 to 2024
    • Current Market Size Value (USD Billion) & Volume (Metric Tons) Analysis and Forecast By Region, 2025 to 2035
      • USA
      • Latin America
      • Western Europe
      • Eastern Europe
      • East Asia
      • South Asia & Pacific
      • Middle East and Africa
    • Market Attractiveness Analysis By Region
  10. USA Market Analysis 2020 to 2024 and Forecast 2025 to 2035, By Country
    • Historical Market Size Value (USD Billion) & Volume (Metric Tons) Trend Analysis By Market Taxonomy, 2020 to 2024
    • Market Size Value (USD Billion) & Volume (Metric Tons) Forecast By Market Taxonomy, 2025 to 2035
      • By Country
        • Canada
        • Brazil
        • Mexico
        • Argentina
      • By Ingredient Type
      • By Form
      • By Distribution Channel
    • Market Attractiveness Analysis
      • By Country
      • By Ingredient Type
      • By Form
      • By Distribution Channel
    • Key Takeaways
  11. Latin America Market Analysis 2020 to 2024 and Forecast 2025 to 2035, By Country
    • Historical Market Size Value (USD Billion) & Volume (Metric Tons) Trend Analysis By Market Taxonomy, 2020 to 2024
    • Market Size Value (USD Billion) & Volume (Metric Tons) Forecast By Market Taxonomy, 2025 to 2035
      • By Country
        • Brazil
        • Argentina
        • Rest of LATAM
      • By Ingredient Type
      • By Form
      • By Distribution Channel
    • Market Attractiveness Analysis
      • By Country
      • By Ingredient Type
      • By Form
      • By Distribution Channel
    • Key Takeaways
  12. Western Europe Market Analysis 2020 to 2024 and Forecast 2025 to 2035, By Country
    • Historical Market Size Value (USD Billion) & Volume (Metric Tons) Trend Analysis By Market Taxonomy, 2020 to 2024
    • Market Size Value (USD Billion) & Volume (Metric Tons) Forecast By Market Taxonomy, 2025 to 2035
      • By Country
        • Germany
        • Italy
        • France
        • UK
        • Spain
        • BENELUX
        • Nordic
        • Rest of W.Europe
      • By Ingredient Type
      • By Form
      • By Distribution Channel
    • Market Attractiveness Analysis
      • By Country
      • By Ingredient Type
      • By Form
      • By Distribution Channel
    • Key Takeaways
  13. Eastern Europe Market Analysis 2020 to 2024 and Forecast 2025 to 2035, By Country
    • Historical Market Size Value (USD Billion) & Volume (Metric Tons) Trend Analysis By Market Taxonomy, 2020 to 2024
    • Market Size Value (USD Billion) & Volume (Metric Tons) Forecast By Market Taxonomy, 2025 to 2035
      • By Country
        • Russia
        • Hungary
        • Poland
        • Balkan & Baltics
        • Rest of E. Europe
      • By Ingredient Type
      • By Form
      • By Distribution Channel
    • Market Attractiveness Analysis
      • By Country
      • By Ingredient Type
      • By Form
      • By Distribution Channel
    • Key Takeaways
  14. East Asia Market Analysis 2020 to 2024 and Forecast 2025 to 2035, By Country
    • Historical Market Size Value (USD Billion) & Volume (Metric Tons) Trend Analysis By Market Taxonomy, 2020 to 2024
    • Market Size Value (USD Billion) & Volume (Metric Tons) Forecast By Market Taxonomy, 2025 to 2035
      • By Country
        • China
        • Japan
        • South Korea
      • By Ingredient Type
      • By Form
      • By Distribution Channel
    • Market Attractiveness Analysis
      • By Country
      • By Ingredient Type
      • By Form
      • By Distribution Channel
    • Key Takeaways
  15. South Asia & Pacific Market Analysis 2020 to 2024 and Forecast 2025 to 2035, By Country
    • Historical Market Size Value (USD Billion) & Volume (Metric Tons) Trend Analysis By Market Taxonomy, 2020 to 2024
    • Market Size Value (USD Billion) & Volume (Metric Tons) Forecast By Market Taxonomy, 2025 to 2035
      • By Country
        • India
        • Australia & New Zealand
        • ASEAN
        • Rest of SAP
      • By Ingredient Type
      • By Form
      • By Distribution Channel
    • Market Attractiveness Analysis
      • By Country
      • By Ingredient Type
      • By Form
      • By Distribution Channel
    • Key Takeaways
  16. Middle East and Africa Market Analysis 2020 to 2024 and Forecast 2025 to 2035, By Country
    • Historical Market Size Value (USD Billion) & Volume (Metric Tons) Trend Analysis By Market Taxonomy, 2020 to 2024
    • Market Size Value (USD Billion) & Volume (Metric Tons) Forecast By Market Taxonomy, 2025 to 2035
      • By Country
        • GCC Countries
        • Northern Africa
        • South Africa
        • Turkiye
        • Rest of MEA
      • By Ingredient Type
      • By Form
      • By Distribution Channel
    • Market Attractiveness Analysis
      • By Country
      • By Ingredient Type
      • By Form
      • By Distribution Channel
    • Key Takeaways
  17. Key Countries Market Analysis
    • USA
      • Pricing Analysis
      • Market Share Analysis, 2024
        • By Ingredient Type
        • By Form
        • By Distribution Channel
    • Canada
      • Pricing Analysis
      • Market Share Analysis, 2024
        • By Ingredient Type
        • By Form
        • By Distribution Channel
    • Brazil
      • Pricing Analysis
      • Market Share Analysis, 2024
        • By Ingredient Type
        • By Form
        • By Distribution Channel
    • Mexico
      • Pricing Analysis
      • Market Share Analysis, 2024
        • By Ingredient Type
        • By Form
        • By Distribution Channel
    • Argentina
      • Pricing Analysis
      • Market Share Analysis, 2024
        • By Ingredient Type
        • By Form
        • By Distribution Channel
  18. Market Structure Analysis
    • Competition Dashboard
    • Competition Benchmarking
    • Market Share Analysis of Top Players
      • By Regional
      • By Ingredient Type
      • By Form
      • By Distribution Channel
  19. Competition Analysis
    • Competition Deep Dive
      • Fairhaven Health
        • Overview
        • Product Portfolio
        • Profitability by Market Segments (Product/Age /Sales Channel/Region)
        • Sales Footprint
        • Strategy Overview
          • Marketing Strategy
          • Product Strategy
          • Channel Strategy
      • UpSpring
        • Overview
        • Product Portfolio
        • Profitability by Market Segments (Product/Age /Sales Channel/Region)
        • Sales Footprint
        • Strategy Overview
          • Marketing Strategy
          • Product Strategy
          • Channel Strategy
      • Motherlove
        • Overview
        • Product Portfolio
        • Profitability by Market Segments (Product/Age /Sales Channel/Region)
        • Sales Footprint
        • Strategy Overview
          • Marketing Strategy
          • Product Strategy
          • Channel Strategy
      • Majka
        • Overview
        • Product Portfolio
        • Profitability by Market Segments (Product/Age /Sales Channel/Region)
        • Sales Footprint
        • Strategy Overview
          • Marketing Strategy
          • Product Strategy
          • Channel Strategy
      • Legendairy Milk
        • Overview
        • Product Portfolio
        • Profitability by Market Segments (Product/Age /Sales Channel/Region)
        • Sales Footprint
        • Strategy Overview
          • Marketing Strategy
          • Product Strategy
          • Channel Strategy
      • Pink Stork
        • Overview
        • Product Portfolio
        • Profitability by Market Segments (Product/Age /Sales Channel/Region)
        • Sales Footprint
        • Strategy Overview
          • Marketing Strategy
          • Product Strategy
          • Channel Strategy
      • Happy Family Organics
        • Overview
        • Product Portfolio
        • Profitability by Market Segments (Product/Age /Sales Channel/Region)
        • Sales Footprint
        • Strategy Overview
          • Marketing Strategy
          • Product Strategy
          • Channel Strategy
      • Naturelo
        • Overview
        • Product Portfolio
        • Profitability by Market Segments (Product/Age /Sales Channel/Region)
        • Sales Footprint
        • Strategy Overview
          • Marketing Strategy
          • Product Strategy
          • Channel Strategy
      • Earth Mama
        • Overview
        • Product Portfolio
        • Profitability by Market Segments (Product/Age /Sales Channel/Region)
        • Sales Footprint
        • Strategy Overview
          • Marketing Strategy
          • Product Strategy
          • Channel Strategy
      • Wellements
        • Overview
        • Product Portfolio
        • Profitability by Market Segments (Product/Age /Sales Channel/Region)
        • Sales Footprint
        • Strategy Overview
          • Marketing Strategy
          • Product Strategy
          • Channel Strategy
      • Metagenics
        • Overview
        • Product Portfolio
        • Profitability by Market Segments (Product/Age /Sales Channel/Region)
        • Sales Footprint
        • Strategy Overview
          • Marketing Strategy
          • Product Strategy
          • Channel Strategy
      • Nature's Way
        • Overview
        • Product Portfolio
        • Profitability by Market Segments (Product/Age /Sales Channel/Region)
        • Sales Footprint
        • Strategy Overview
          • Marketing Strategy
          • Product Strategy
          • Channel Strategy
      • Solgar
        • Overview
        • Product Portfolio
        • Profitability by Market Segments (Product/Age /Sales Channel/Region)
        • Sales Footprint
        • Strategy Overview
          • Marketing Strategy
          • Product Strategy
          • Channel Strategy
      • Freemie
        • Overview
        • Product Portfolio
        • Profitability by Market Segments (Product/Age /Sales Channel/Region)
        • Sales Footprint
        • Strategy Overview
          • Marketing Strategy
          • Product Strategy
          • Channel Strategy
      • Milkful
        • Overview
        • Product Portfolio
        • Profitability by Market Segments (Product/Age /Sales Channel/Region)
        • Sales Footprint
        • Strategy Overview
          • Marketing Strategy
          • Product Strategy
          • Channel Strategy
  20. Assumptions & Acronyms Used
  21. Research Methodology

List of Tables

  • Table 1: Global Market Value (USD Billion) Forecast by Region, 2020-2035
  • Table 2: Global Market Volume (Metric Tons) Forecast by Region, 2020-2035
  • Table 3: Global Market Value (USD Billion) Forecast by Ingredient Type, 2020-2035
  • Table 4: Global Market Volume (Metric Tons) Forecast by Ingredient Type, 2020-2035
  • Table 5: Global Market Value (USD Billion) Forecast by Form, 2020-2035
  • Table 6: Global Market Volume (Metric Tons) Forecast by Form, 2020-2035
  • Table 7: Global Market Value (USD Billion) Forecast by Distribution Channel, 2020-2035
  • Table 8: Global Market Volume (Metric Tons) Forecast by Distribution Channel, 2020-2035
  • Table 9: USA Market Value (USD Billion) Forecast by Country, 2020-2035
  • Table 10: USA Market Volume (Metric Tons) Forecast by Country, 2020-2035
  • Table 11: USA Market Value (USD Billion) Forecast by Ingredient Type, 2020-2035
  • Table 12: USA Market Volume (Metric Tons) Forecast by Ingredient Type, 2020-2035
  • Table 13: USA Market Value (USD Billion) Forecast by Form, 2020-2035
  • Table 14: USA Market Volume (Metric Tons) Forecast by Form, 2020-2035
  • Table 15: USA Market Value (USD Billion) Forecast by Distribution Channel, 2020-2035
  • Table 16: USA Market Volume (Metric Tons) Forecast by Distribution Channel, 2020-2035
  • Table 17: Latin America Market Value (USD Billion) Forecast by Country, 2020-2035
  • Table 18: Latin America Market Volume (Metric Tons) Forecast by Country, 2020-2035
  • Table 19: Latin America Market Value (USD Billion) Forecast by Ingredient Type, 2020-2035
  • Table 20: Latin America Market Volume (Metric Tons) Forecast by Ingredient Type, 2020-2035
  • Table 21: Latin America Market Value (USD Billion) Forecast by Form, 2020-2035
  • Table 22: Latin America Market Volume (Metric Tons) Forecast by Form, 2020-2035
  • Table 23: Latin America Market Value (USD Billion) Forecast by Distribution Channel, 2020-2035
  • Table 24: Latin America Market Volume (Metric Tons) Forecast by Distribution Channel, 2020-2035
  • Table 25: Western Europe Market Value (USD Billion) Forecast by Country, 2020-2035
  • Table 26: Western Europe Market Volume (Metric Tons) Forecast by Country, 2020-2035
  • Table 27: Western Europe Market Value (USD Billion) Forecast by Ingredient Type, 2020-2035
  • Table 28: Western Europe Market Volume (Metric Tons) Forecast by Ingredient Type, 2020-2035
  • Table 29: Western Europe Market Value (USD Billion) Forecast by Form, 2020-2035
  • Table 30: Western Europe Market Volume (Metric Tons) Forecast by Form, 2020-2035
  • Table 31: Western Europe Market Value (USD Billion) Forecast by Distribution Channel, 2020-2035
  • Table 32: Western Europe Market Volume (Metric Tons) Forecast by Distribution Channel, 2020-2035
  • Table 33: Eastern Europe Market Value (USD Billion) Forecast by Country, 2020-2035
  • Table 34: Eastern Europe Market Volume (Metric Tons) Forecast by Country, 2020-2035
  • Table 35: Eastern Europe Market Value (USD Billion) Forecast by Ingredient Type, 2020-2035
  • Table 36: Eastern Europe Market Volume (Metric Tons) Forecast by Ingredient Type, 2020-2035
  • Table 37: Eastern Europe Market Value (USD Billion) Forecast by Form, 2020-2035
  • Table 38: Eastern Europe Market Volume (Metric Tons) Forecast by Form, 2020-2035
  • Table 39: Eastern Europe Market Value (USD Billion) Forecast by Distribution Channel, 2020-2035
  • Table 40: Eastern Europe Market Volume (Metric Tons) Forecast by Distribution Channel, 2020-2035
  • Table 41: East Asia Market Value (USD Billion) Forecast by Country, 2020-2035
  • Table 42: East Asia Market Volume (Metric Tons) Forecast by Country, 2020-2035
  • Table 43: East Asia Market Value (USD Billion) Forecast by Ingredient Type, 2020-2035
  • Table 44: East Asia Market Volume (Metric Tons) Forecast by Ingredient Type, 2020-2035
  • Table 45: East Asia Market Value (USD Billion) Forecast by Form, 2020-2035
  • Table 46: East Asia Market Volume (Metric Tons) Forecast by Form, 2020-2035
  • Table 47: East Asia Market Value (USD Billion) Forecast by Distribution Channel, 2020-2035
  • Table 48: East Asia Market Volume (Metric Tons) Forecast by Distribution Channel, 2020-2035
  • Table 49: South Asia & Pacific Market Value (USD Billion) Forecast by Country, 2020-2035
  • Table 50: South Asia & Pacific Market Volume (Metric Tons) Forecast by Country, 2020-2035
  • Table 51: South Asia & Pacific Market Value (USD Billion) Forecast by Ingredient Type, 2020-2035
  • Table 52: South Asia & Pacific Market Volume (Metric Tons) Forecast by Ingredient Type, 2020-2035
  • Table 53: South Asia & Pacific Market Value (USD Billion) Forecast by Form, 2020-2035
  • Table 54: South Asia & Pacific Market Volume (Metric Tons) Forecast by Form, 2020-2035
  • Table 55: South Asia & Pacific Market Value (USD Billion) Forecast by Distribution Channel, 2020-2035
  • Table 56: South Asia & Pacific Market Volume (Metric Tons) Forecast by Distribution Channel, 2020-2035
  • Table 57: Middle East and Africa Market Value (USD Billion) Forecast by Country, 2020-2035
  • Table 58: Middle East and Africa Market Volume (Metric Tons) Forecast by Country, 2020-2035
  • Table 59: Middle East and Africa Market Value (USD Billion) Forecast by Ingredient Type, 2020-2035
  • Table 60: Middle East and Africa Market Volume (Metric Tons) Forecast by Ingredient Type, 2020-2035
  • Table 61: Middle East and Africa Market Value (USD Billion) Forecast by Form, 2020-2035
  • Table 62: Middle East and Africa Market Volume (Metric Tons) Forecast by Form, 2020-2035
  • Table 63: Middle East and Africa Market Value (USD Billion) Forecast by Distribution Channel, 2020-2035
  • Table 64: Middle East and Africa Market Volume (Metric Tons) Forecast by Distribution Channel, 2020-2035

List of Figures

  • Figure 1: Global Market Volume (Metric Tons) Forecast 2020-2035
  • Figure 2: Global Market Pricing Analysis
  • Figure 3: Global Market Value (USD Billion) Forecast 2020-2035
  • Figure 4: Global Market Value Share and BPS Analysis by Ingredient Type, 2025 and 2035
  • Figure 5: Global Market Y-o-Y Growth Comparison by Ingredient Type, 2025-2035
  • Figure 6: Global Market Attractiveness Analysis by Ingredient Type
  • Figure 7: Global Market Value Share and BPS Analysis by Form, 2025 and 2035
  • Figure 8: Global Market Y-o-Y Growth Comparison by Form, 2025-2035
  • Figure 9: Global Market Attractiveness Analysis by Form
  • Figure 10: Global Market Value Share and BPS Analysis by Distribution Channel, 2025 and 2035
  • Figure 11: Global Market Y-o-Y Growth Comparison by Distribution Channel, 2025-2035
  • Figure 12: Global Market Attractiveness Analysis by Distribution Channel
  • Figure 13: Global Market Value (USD Billion) Share and BPS Analysis by Region, 2025 and 2035
  • Figure 14: Global Market Y-o-Y Growth Comparison by Region, 2025-2035
  • Figure 15: Global Market Attractiveness Analysis by Region
  • Figure 16: USA Market Incremental $ Opportunity, 2025-2035
  • Figure 17: Latin America Market Incremental $ Opportunity, 2025-2035
  • Figure 18: Western Europe Market Incremental $ Opportunity, 2025-2035
  • Figure 19: Eastern Europe Market Incremental $ Opportunity, 2025-2035
  • Figure 20: East Asia Market Incremental $ Opportunity, 2025-2035
  • Figure 21: South Asia & Pacific Market Incremental $ Opportunity, 2025-2035
  • Figure 22: Middle East and Africa Market Incremental $ Opportunity, 2025-2035
  • Figure 23: USA Market Value Share and BPS Analysis by Country, 2025 and 2035
  • Figure 24: USA Market Value Share and BPS Analysis by Ingredient Type, 2025 and 2035
  • Figure 25: USA Market Y-o-Y Growth Comparison by Ingredient Type, 2025-2035
  • Figure 26: USA Market Attractiveness Analysis by Ingredient Type
  • Figure 27: USA Market Value Share and BPS Analysis by Form, 2025 and 2035
  • Figure 28: USA Market Y-o-Y Growth Comparison by Form, 2025-2035
  • Figure 29: USA Market Attractiveness Analysis by Form
  • Figure 30: USA Market Value Share and BPS Analysis by Distribution Channel, 2025 and 2035
  • Figure 31: USA Market Y-o-Y Growth Comparison by Distribution Channel, 2025-2035
  • Figure 32: USA Market Attractiveness Analysis by Distribution Channel
  • Figure 33: Latin America Market Value Share and BPS Analysis by Country, 2025 and 2035
  • Figure 34: Latin America Market Value Share and BPS Analysis by Ingredient Type, 2025 and 2035
  • Figure 35: Latin America Market Y-o-Y Growth Comparison by Ingredient Type, 2025-2035
  • Figure 36: Latin America Market Attractiveness Analysis by Ingredient Type
  • Figure 37: Latin America Market Value Share and BPS Analysis by Form, 2025 and 2035
  • Figure 38: Latin America Market Y-o-Y Growth Comparison by Form, 2025-2035
  • Figure 39: Latin America Market Attractiveness Analysis by Form
  • Figure 40: Latin America Market Value Share and BPS Analysis by Distribution Channel, 2025 and 2035
  • Figure 41: Latin America Market Y-o-Y Growth Comparison by Distribution Channel, 2025-2035
  • Figure 42: Latin America Market Attractiveness Analysis by Distribution Channel
  • Figure 43: Western Europe Market Value Share and BPS Analysis by Country, 2025 and 2035
  • Figure 44: Western Europe Market Value Share and BPS Analysis by Ingredient Type, 2025 and 2035
  • Figure 45: Western Europe Market Y-o-Y Growth Comparison by Ingredient Type, 2025-2035
  • Figure 46: Western Europe Market Attractiveness Analysis by Ingredient Type
  • Figure 47: Western Europe Market Value Share and BPS Analysis by Form, 2025 and 2035
  • Figure 48: Western Europe Market Y-o-Y Growth Comparison by Form, 2025-2035
  • Figure 49: Western Europe Market Attractiveness Analysis by Form
  • Figure 50: Western Europe Market Value Share and BPS Analysis by Distribution Channel, 2025 and 2035
  • Figure 51: Western Europe Market Y-o-Y Growth Comparison by Distribution Channel, 2025-2035
  • Figure 52: Western Europe Market Attractiveness Analysis by Distribution Channel
  • Figure 53: Eastern Europe Market Value Share and BPS Analysis by Country, 2025 and 2035
  • Figure 54: Eastern Europe Market Value Share and BPS Analysis by Ingredient Type, 2025 and 2035
  • Figure 55: Eastern Europe Market Y-o-Y Growth Comparison by Ingredient Type, 2025-2035
  • Figure 56: Eastern Europe Market Attractiveness Analysis by Ingredient Type
  • Figure 57: Eastern Europe Market Value Share and BPS Analysis by Form, 2025 and 2035
  • Figure 58: Eastern Europe Market Y-o-Y Growth Comparison by Form, 2025-2035
  • Figure 59: Eastern Europe Market Attractiveness Analysis by Form
  • Figure 60: Eastern Europe Market Value Share and BPS Analysis by Distribution Channel, 2025 and 2035
  • Figure 61: Eastern Europe Market Y-o-Y Growth Comparison by Distribution Channel, 2025-2035
  • Figure 62: Eastern Europe Market Attractiveness Analysis by Distribution Channel
  • Figure 63: East Asia Market Value Share and BPS Analysis by Country, 2025 and 2035
  • Figure 64: East Asia Market Value Share and BPS Analysis by Ingredient Type, 2025 and 2035
  • Figure 65: East Asia Market Y-o-Y Growth Comparison by Ingredient Type, 2025-2035
  • Figure 66: East Asia Market Attractiveness Analysis by Ingredient Type
  • Figure 67: East Asia Market Value Share and BPS Analysis by Form, 2025 and 2035
  • Figure 68: East Asia Market Y-o-Y Growth Comparison by Form, 2025-2035
  • Figure 69: East Asia Market Attractiveness Analysis by Form
  • Figure 70: East Asia Market Value Share and BPS Analysis by Distribution Channel, 2025 and 2035
  • Figure 71: East Asia Market Y-o-Y Growth Comparison by Distribution Channel, 2025-2035
  • Figure 72: East Asia Market Attractiveness Analysis by Distribution Channel
  • Figure 73: South Asia & Pacific Market Value Share and BPS Analysis by Country, 2025 and 2035
  • Figure 74: South Asia & Pacific Market Value Share and BPS Analysis by Ingredient Type, 2025 and 2035
  • Figure 75: South Asia & Pacific Market Y-o-Y Growth Comparison by Ingredient Type, 2025-2035
  • Figure 76: South Asia & Pacific Market Attractiveness Analysis by Ingredient Type
  • Figure 77: South Asia & Pacific Market Value Share and BPS Analysis by Form, 2025 and 2035
  • Figure 78: South Asia & Pacific Market Y-o-Y Growth Comparison by Form, 2025-2035
  • Figure 79: South Asia & Pacific Market Attractiveness Analysis by Form
  • Figure 80: South Asia & Pacific Market Value Share and BPS Analysis by Distribution Channel, 2025 and 2035
  • Figure 81: South Asia & Pacific Market Y-o-Y Growth Comparison by Distribution Channel, 2025-2035
  • Figure 82: South Asia & Pacific Market Attractiveness Analysis by Distribution Channel
  • Figure 83: Middle East and Africa Market Value Share and BPS Analysis by Country, 2025 and 2035
  • Figure 84: Middle East and Africa Market Value Share and BPS Analysis by Ingredient Type, 2025 and 2035
  • Figure 85: Middle East and Africa Market Y-o-Y Growth Comparison by Ingredient Type, 2025-2035
  • Figure 86: Middle East and Africa Market Attractiveness Analysis by Ingredient Type
  • Figure 87: Middle East and Africa Market Value Share and BPS Analysis by Form, 2025 and 2035
  • Figure 88: Middle East and Africa Market Y-o-Y Growth Comparison by Form, 2025-2035
  • Figure 89: Middle East and Africa Market Attractiveness Analysis by Form
  • Figure 90: Middle East and Africa Market Value Share and BPS Analysis by Distribution Channel, 2025 and 2035
  • Figure 91: Middle East and Africa Market Y-o-Y Growth Comparison by Distribution Channel, 2025-2035
  • Figure 92: Middle East and Africa Market Attractiveness Analysis by Distribution Channel
  • Figure 93: Global Market - Tier Structure Analysis
  • Figure 94: Global Market - Company Share Analysis

Frequently Asked Questions

What is the lactation support supplements market size in 2025?

The global market is valued at USD 1.7 billion in 2025.

What is the projected market size of lactation support supplements by 2035?

The market is forecasted to reach USD 3.1 billion by 2035.

Which segment leads the lactation supplements market by ingredient type?

Herbal supplements lead with a 46% market share in 2025.

What is the expected CAGR of the lactation support supplements market from 2025 to 2035?

The market is expected to grow at a CAGR of 6.0% during the forecast period.

Which country is expected to record the highest CAGR in the lactation support supplements market?

Japan is projected to register the highest CAGR of 6.2% from 2025 to 2035.

Explore Similar Insights

Future Market Insights

Lactation Support Supplements Market