Organ Support Supplements Market Size and Share Forecast Outlook 2025 to 2035

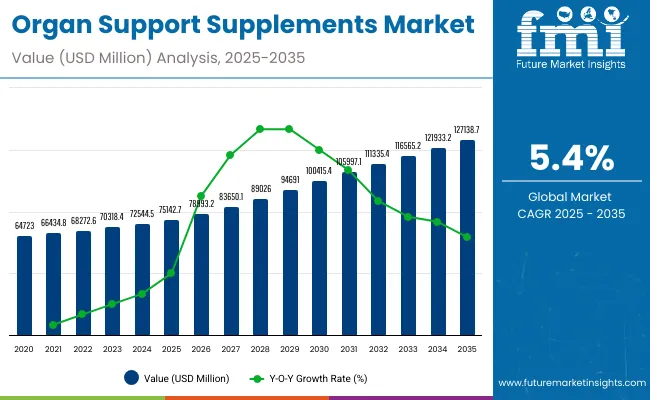
The global Organ Support Supplements Market is projected to reach a valuation of USD 75,142.7 million by 2025 and USD 127,138.7 million by 2035. This reflects a decade-long expansion of USD 51,996.0 million between 2025 and 2035. The market is anticipated to grow at a compound annual growth rate (CAGR) of 5.4%, representing a 1.69X increase over the ten-year period.
Quick Stats for Organ Support Supplements Market

  • Industry Value (2025): USD 75,142.7 million
  • Forecast Value (2035): USD 127,138.7 million
  • Forecast CAGR: 5.4%
  • Leading Segment in 2025 (Supplement Type): Liver Support Supplements (32.0% market share)
  • Key Growth Region: Asia Pacific and North America
  • Top Key Players: Amway, Herbalife Nutrition, Nestlé Health Science, Bayer AG, GNC Holdings, NOW Foods, Nature’s Bounty (Nestlé), Swisse Wellness, Pharmavite, Thorne HealthTech

Organ Support Supplements Market

Metric Value
Industry Size (2025E) USD 75,142.7 million
Industry Value (2035F) USD 127,138.7 million
CAGR (2025 to 2035) 5.4%

During the first five-year window from 2025 to 2030, the total market size is estimated to expand from USD 75,142.7 million to approximately USD 100,415.4 million, adding USD 25272.7 million, which accounts for 48.6% of the total decade growth.

Within this period, Liver Support Supplements will remain the leading category, sustaining close to 32% share of the global market, driven by rising incidences of fatty liver disease, alcohol-related conditions, and detoxification trends. Gut Health Supplements are projected to capture nearly one-fifth of demand, while Brain and Cognitive Supplements will steadily expand, supported by the growing focus on mental wellness and aging populations.

The second half of the decade, from 2030 to 2035, contributes an incremental USD 26,723.28 million, equal to 51.4% of the total growth, as the market advances from USD 100,415.4 million to 127,138.7 million. Growth during this stage is propelled by the mass-market availability of functional beverages, gummies, and shots, which align with consumer preference for convenient formats.

By 2035, Liver Support Supplements and Gut Health Supplements together are expected to capture more than half of the global share, while Kidney and Cognitive Health Supplements gain further traction. E-commerce channels will reinforce this expansion, surpassing 28% of sales share, particularly in high-growth regions such as South Korea, India, and Brazil.

From 2020 to 2024, the overall Organ Support Supplements Market expanded from USD 64,723.0 million to USD 72,544.5 million. Leading companies such as Amway, Herbalife Nutrition, Nestlé Health Science, Bayer AG, and GNC Holdings, along with other innovators, collectively account for a significant portion of global revenues through organ-specific formulations and science-backed product launches.

Key strategies deployed by these players include portfolio expansion in liver, gut, and cognitive health supplements, development of convenient formats such as gummies, shots, and functional beverages, and omnichannel distribution that integrates e-commerce with retail pharmacies and health & wellness stores. These initiatives are strengthening brand visibility and consumer trust in preventive healthcare.

In 2025, the market is projected to reach approximately USD 75,142.7 million, driven by the shift from general wellness supplements toward organ-targeted solutions. Growth will be propelled by rising demand for liver and gut health supplements, which together capture more than half of global share, as well as increased consumer focus on brain and cognitive support linked to mental wellness and aging. End users particularly chronic disease patients and geriatric populations are increasingly adopting supplements across capsules, powders, and functional beverage formats.

At the same time, e-commerce channels, already contributing 28% of global sales, are accelerating adoption by providing personalized product recommendations and subscription-based delivery models. This trend reflects the broader transition toward preventive, convenient, and scientifically validated supplementation practices across both developed and emerging markets.

Why Is This Market Growing?

The Organ Support Supplements Market is experiencing strong growth as consumer’s worldwide face increasing demand for preventive health solutions, organ-specific wellness, and healthy aging. Major growth drivers include the rising global prevalence of liver disorders, kidney complications, cardiovascular issues, and digestive imbalances, along with heightened awareness of cognitive health. Product innovation in formats such as capsules, functional beverages, gummies, and shots makes supplementation more convenient, supporting wider adoption across multiple demographics.

Advancements in scientifically backed formulations and the integration of supplements into chronic disease management and post-treatment recovery improve consumer outcomes, strengthen compliance, and broaden applications. The shift toward personalized supplementation and the growing influence of digital health platforms and e-commerce are further accelerating uptake by enabling tailored recommendations and direct-to-consumer accessibility.

The pandemic reinforced the importance of immune resilience and long-term organ health, driving both preventive users and patients with chronic conditions toward consistent supplement use. In regions with expanding healthcare access particularly in the USA, Europe, South Korea, India, and Brazil rising disposable incomes, improved product availability, and increasing professional recommendations are fueling demand for organ support supplements that combine safety, efficacy, and consumer convenience.

Segmental Analysis

The market is segmented by supplement type, formulation type, application, and sales channel. Supplement types include Liver Support Supplements, Kidney Health Supplements, Heart Health Supplements, Lung Support Supplements, Brain & Cognitive Support Supplements, Gut Health Supplements, and Others. Application classification covers General Wellness, Athletes & Fitness Seekers, Chronic Disease Patients, Post-treatment Recovery, and Geriatric (65 Years and Above.

Based on formulation type, the segmentation includes Capsules/Tablets, Powders, Tinctures, Gummies, Functional Beverages, and Shots. Sales channel segmentation spans Retail Pharmacies, Drug Stores, Health & Wellness Stores, Hypermarkets and Supermarkets, and E-commerce/Online Sales. Regionally, the scope includes North America, Latin America, Western and Eastern Europe, East Asia, South Asia & Pacific, and the Middle East & Africa, with market performance shaped by differences in healthcare awareness, supplement penetration rates, and evolving regulatory frameworks.
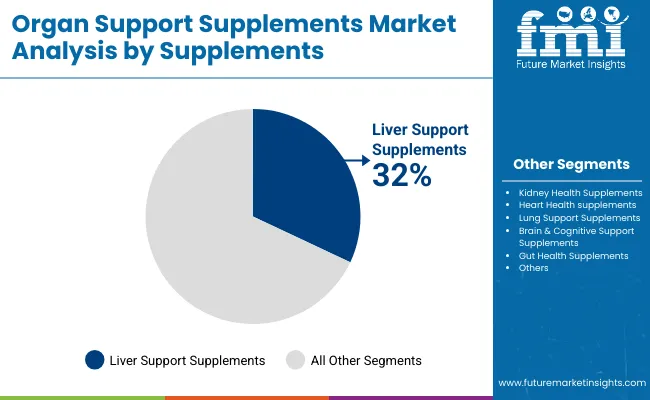
Insights into the Supplement Segment with Liver Support Supplements Leading in Market Share

Organ Support Supplements Market By Supplements

Supplements Market Share (%)
Liver Support Supplements 32.0%
Kidney Health Supplements 13.3%
Heart Health supplements 4.1%
Lung Support Supplements 2.9%
Brain & Cognitive Support Supplements 11.5%
Gut Health Supplements 19.2%
Others 17.0%

Liver Support Supplements are expected to retain a dominant position, contributing 32.0% to the market in 2025, owing to their ability to address liver detoxification, fatty liver conditions, and alcohol-related health concerns. Their adoption has been driven by the global rise in lifestyle-related disorders and the increasing consumer awareness of liver function as a cornerstone of overall wellness. These supplements are increasingly preferred due to their capacity to support detox processes, improve digestion, and enhance energy metabolism.

Healthcare practitioners and wellness providers are recommending liver-specific formulations as part of preventive healthcare regimens, particularly for individuals with high exposure to processed foods, medications, and alcohol consumption. Industry adoption has also been supported by advancements in herbal formulations, clinically backed ingredients, and delivery innovations such as capsules, functional beverages, and gummies. Collectively, these factors have solidified the position of liver support products over other categories, making them the most widely consumed supplement type in the global organ support market.
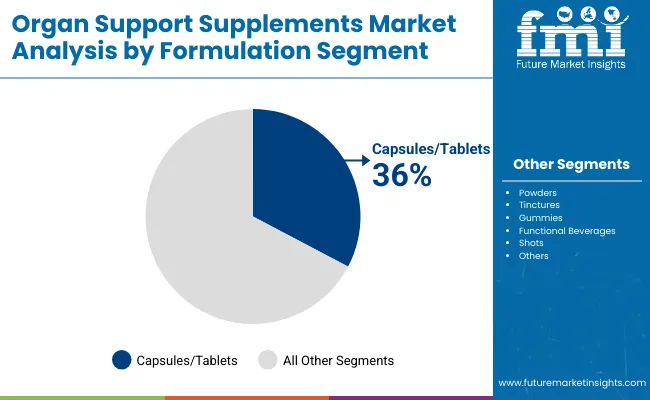
Insights into the Formulation Segment with Capsules/Tablets Dominating the Demand

Organ Support Supplements Market By Formulation

Formulation Segment Market Share (%)
Capsules/Tablets 36.00%
Powders 18.00%
Tinctures 8.00%
Gummies 12.00%
Functional Beverages 15.00%
Shots 11.00%

Capsules/Tablets have emerged as the leading formulation type, projected to hold around 36.0% of the market in 2025, driven by their convenience, dosage accuracy, and broad consumer acceptance. The increasing adoption of this format stems from its ability to provide consistent efficacy, easy storage, and affordability across diverse supplement categories.

Healthcare professionals frequently recommend capsules and tablets, reinforcing consumer trust and compliance. Rising awareness of preventive health, combined with product innovations such as improved coatings and extended-release formulations, is further fueling demand. Their widespread availability through retail pharmacies, health stores, and e-commerce platforms ensures strong penetration. The growing elderly population and chronic disease burden also support continued reliance on capsules and tablets, cementing their position over newer formats like gummies, beverages, and shots.
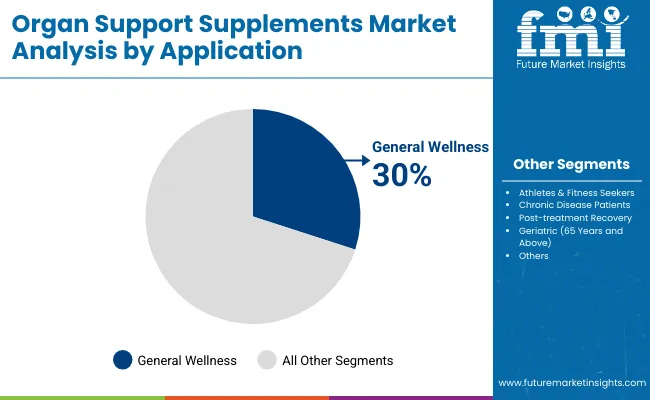
Insights into the Application Segment with Highest Adoption in General Wellness

Organ Support Supplements Market By Application

Application Market Share (%)
General Wellness 30.00%
Athletes & Fitness Seekers 16.00%
Chronic Disease Patients 25.00%
Post-treatment Recovery 14.00%
Geriatric (65 Years and Above) 15.00%

General Wellness is expected to remain the largest application segment, contributing around 30.0% of the market in 2025, driven by rising consumer focus on preventive health and daily nutrition. A significant share of supplement usage is directed toward maintaining overall organ health, where consistency, affordability, and accessibility are key priorities. The adoption of supplements in this segment is reinforced by their role in supporting liver, gut, and cognitive functions as part of holistic wellness routines.

Increasing product innovation in capsules, functional beverages, and gummies is making general wellness supplements more appealing across diverse consumer groups. Expanding availability through e-commerce, pharmacies, and health stores further supports market growth. Additionally, rising disposable incomes and growing health awareness in both developed and emerging regions are cementing the dominance of general wellness applications as the primary driver for organ support supplement adoption globally.
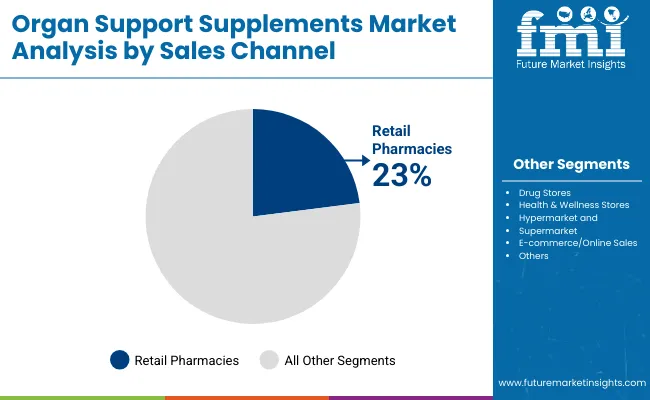
Insights into the Sales Channel Segment with Highest Adoption in E-commerce/Online Sales

Organ Support Supplements Market By Sales

Sales Channel Market Share (%)
Retail Pharmacies 23.00%
Drug Stores 14.00%
Health & Wellness Stores 19.00%
Hypermarket and Supermarket 16.00%
E-commerce/Online Sales 28.00%

E-commerce/Online Sales are expected to remain the largest distribution channel, contributing around 28.0% of the market in 2025, driven by their critical role in offering convenience, accessibility, and personalized shopping experiences. A significant portion of supplement purchases now takes place online, where speed, variety, and subscription-based models are key adoption factors. The growing presence of wellness-focused digital platforms and direct-to-consumer brands has reinforced the dominance of online sales channels.

The adoption of e-commerce in supplement distribution is further strengthened by targeted marketing strategies, consumer reviews, and seamless home delivery, which collectively enhance trust and repeat purchasing. Expanding product availability through online pharmacies, brand-owned websites, and marketplaces is enabling wider reach, particularly in younger demographics and tech-savvy regions. Additionally, rising digital health awareness and the global shift toward convenience-driven shopping are cementing the position of e-commerce/online sales as the primary growth engine for organ support supplement adoption worldwide.

What are the Drivers, Restraints, and Key Trends of the Organ Support Supplements Market?

Rising Preventive Health Awareness and Targeted Organ Support Demand

The most significant growth driver in the Organ Support Supplements Market is the increasing consumer shift toward preventive healthcare and organ-specific nutrition. Rising incidences of lifestyle-related disorders, including fatty liver disease, kidney complications, cardiovascular issues, and digestive imbalances, are compelling individuals to adopt supplements as part of daily wellness routines. Categories such as liver support (32% share) and gut health (19.2% share) are at the forefront of this demand, supported by growing clinical research linking organ health to overall longevity.

Supplement adoption is further reinforced by the expansion of e-commerce platforms and digital health tools, which allow brands to offer personalized recommendations, subscription models, and rapid delivery. Healthcare professionals are increasingly endorsing organ-specific formulations as part of holistic treatment regimens, strengthening their role in chronic disease management and post-treatment recovery. Collectively, these factors are driving higher consumption of organ support supplements across both developed and emerging economies.

Regulatory Complexity and Trust Barriers in Supplement Adoption

Despite the rising demand, regulatory variation and product credibility concerns remain significant restraints in the global market. Supplement categories are regulated differently across regions ranging from FDA oversight in the USA to EFSA guidelines in Europe and diverse local standards in Asia creating inconsistencies in product approvals and labeling. This often complicates cross-border expansion for multinational brands. Additionally, consumer skepticism related to efficacy claims, product safety, and counterfeit risks acts as a barrier to adoption.

Price sensitivity in emerging markets further restricts uptake of premium formulations such as advanced functional beverages or clinically validated cognitive health products. Retail pharmacies and healthcare professionals often remain cautious in recommending products that lack strong clinical evidence or standardized certification. These challenges collectively slow market penetration in regions where regulatory clarity and consumer education are less established.

Convergence of Supplements with Functional Foods and Digital Wellness Ecosystems

A rapidly emerging trend is the integration of organ support supplements with functional food and digital health ecosystems. Consumers are increasingly seeking supplements in lifestyle-friendly formats such as gummies, shots, and functional beverages, rather than traditional tablets, fueling cross-category innovation. Major companies like Nestlé Health Science and Bayer AG are embedding supplements into broader nutritional wellness portfolios, aligning with dietary products and fitness platforms to create holistic health solutions.

Parallel to this, e-commerce and wellness apps are enabling personalized supplement plans using AI-driven health tracking and diagnostic tools, shifting procurement decisions toward customized, subscription-based solutions. The convergence of supplements with digital ecosystems and functional nutrition is redefining consumer engagement, transforming organ support supplements from standalone products into integrated components of preventive healthcare pathways. This trend is expected to accelerate adoption, particularly in digitally mature regions such as North America, Europe, and South Korea.
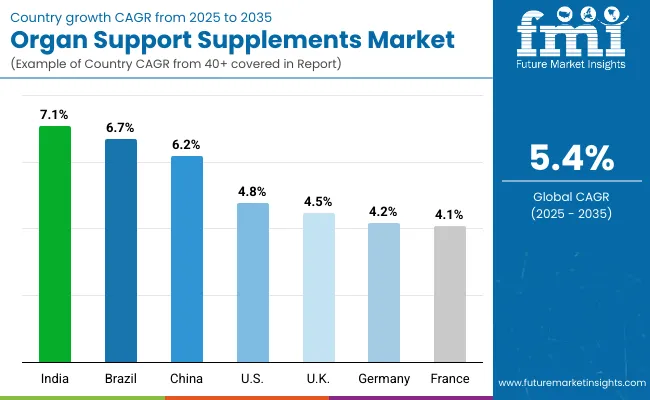
Analysis of Organ Support Supplements Market by Key Countries

Organ Support Supplements Market By Country

Asia Pacific is emerging as the fastest-growing region in the Organ Support Supplements Market, projected to grow at a CAGR of 6.6% between 2025 and 2035, with India expanding at 7.1% CAGR and China at 6.2% CAGR. Growth is driven by rising healthcare awareness, increasing disposable incomes, and greater adoption of preventive nutrition in urban populations. India is seeing strong uptake due to the rising burden of lifestyle-related diseases and expansion of digital health platforms promoting supplement use.

In China, government initiatives supporting nutrition and wellness, along with expanding e-commerce penetration, are accelerating adoption. South Korea stands out with a 6.5% CAGR, supported by consumer preference for innovative formulations such as functional beverages and shots. Collectively, Asia Pacific’s momentum is reinforced by demographic shifts, higher healthcare spending, and digital retail channels.

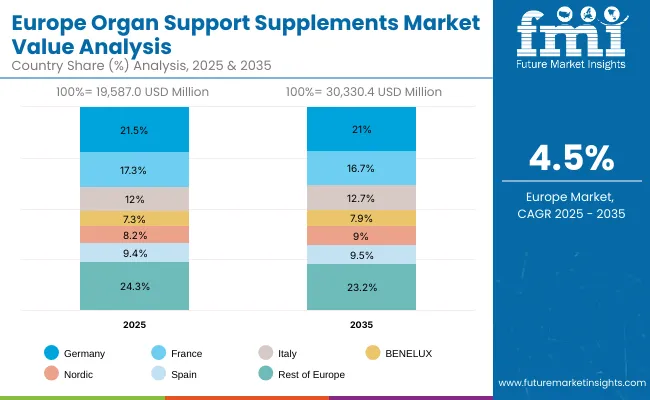
Europe is expected to grow steadily at a 4.3% CAGR through 2035. Germany is projected to expand at 4.2% CAGR, benefiting from strong adoption of liver and gut health supplements in preventive healthcare regimens.

France is estimated to grow at 4.1% CAGR, supported by product integration into mainstream retail and pharmacy networks, while the UK will expand at 4.5% CAGR, driven by online distribution and rising consumer awareness of organ-specific supplementation. Country-level revenue splits indicate Germany, the UK, and France will remain the largest markets, though France’s share is forecast to declinegradually from 17.3% in 2025 to 16.7% by 2035, reflecting strong competition across the product segment.

North America remains a mature but innovation-driven market, with the USA projected to grow at a 4.8% CAGR between 2025-2035. Growth is supported by increasing consumer demand for personalized supplements, subscription models, and functional formulations. Retail pharmacies and health & wellness stores continue to play a strong role, but e-commerce has rapidly become the leading channel, accounting for 28.0% of sales.

Adoption is further fueled by the high prevalence of chronic diseases and growing geriatric populations, where targeted organ support particularly liver, kidney, and cognitive supplements forms part of long-term care strategies. Market expansion is reinforced by product innovation, clinical validation efforts, and the integration of supplements into preventive health programs across healthcare providers and wellness practitioners.
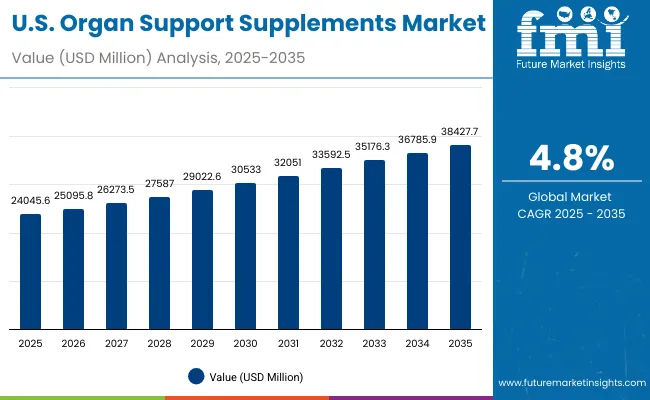
Sales Outlook for Organ Support Supplements in the United States

Organ Support Supplements Market Usa

The Organ Support Supplements Market in the USA is forecasted to grow at a 4.8% CAGR, primarily driven by rising consumer awareness of preventive healthcare and increasing adoption of gut, liver, and brain support supplements. Retail pharmacies and e-commerce platforms are driving penetration by offering wide accessibility and brand variety. The shift toward science-backed, functional formulations and clean-label supplements is further expanding consumer trust and adoption.
  • Retail pharmacies and health & wellness stores are becoming preferred channels for routine purchases of organ-specific supplements.
  • E-commerce platforms are accelerating market growth by targeting young, tech-savvy consumers and bundling subscription models for chronic disease patients.
  • Hospitals and specialty care providers are increasingly recommending kidney and liver support products to chronic and post-treatment recovery patients, strengthening clinical credibility.

Growth and Expansion Outlook for Organ Support Supplements Market in Europe

Organ Support Supplements Market Europe

The Organ Support Supplements Market in Europe is projected to grow at a 4.3% CAGR through 2035, supported by the region’s aging population, rising demand for cognitive and heart health products, and regulatory approval of herbal/natural formulations. Consumer preferences are shifting toward capsules, powders, and functional beverages with clinically validated claims.

  • Germany, the UK, and France account for the majority of Europe’s revenue, driven by established supplement brands and premiumization of formulations.
  • Pharmacies and drug stores are the dominant distribution channels, but online platforms are gaining traction, especially for niche categories like gut health and nootropics.
  • Elderly population growth is spurring demand for heart and brain support products, while athletes and fitness seekers increasingly adopt liver detox and kidney support supplements as part of recovery regimens.

Market Expansion Outlook for Organ Support Supplements Market in India

The Organ Support Supplements Market in India is expected to grow at a 7.1% CAGR, making it one of the fastest-growing markets globally. Growth is fueled by rising preventive healthcare awareness, expansion of nutraceutical retail networks, and increasing adoption of herbal and functional blends across Tier 1 and Tier 2 cities. Higher prevalence of chronic diseases, combined with AYUSH ministry-backed initiatives, is boosting the consumption of liver and kidney health supplements. Indian nutraceutical companies are actively launching affordable, region-specific formulations in capsule, powder, and functional beverage formats to meet evolving consumer preferences.

  • Private nutraceutical brands are introducing Ayurvedic and herbal-based liver support supplements to meet demand for detox and chronic care.
  • Medical teaching hospitals and wellness centers are recommending evidence-based kidney and gut health formulations for preventive care.
  • Chain pharmacies and e-commerce platforms in Tier 2 cities are scaling access by offering cost-effective supplement bundles and subscription models.

Sales Outlook for Organ Support Supplements Market in China

The Organ Support Supplements Market in China is projected to grow at a 6.2% CAGR through 2035, supported by strong government initiatives under the Healthy China 2030 plan. Rising consumer health consciousness, particularly in urban centers, is driving demand for clinically backed gut, liver, and cognitive supplements. Aging demographics and lifestyle-driven chronic conditions are further accelerating adoption of capsules, functional beverages, and gummies. Domestic players are strengthening production capacity while integrating Traditional Chinese Medicine (TCM)-inspired formulations with modern nutraceutical science to appeal to a broad consumer base.
  • Tier 1 city consumers are driving premium demand for scientifically validated gut microbiome and brain health supplements.
  • E-commerce platforms are bundling multi-supplement packs tailored to chronic disease patients and elderly populations.
  • Domestic nutraceutical companies are scaling herbal formulations into modern formats like gummies and shots to target younger demographics.

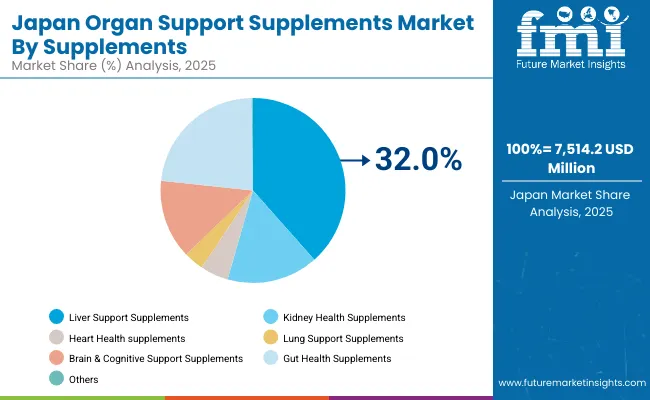
Growth Outlook of Organ Support Supplements Market in Japan

Organ Support Supplements Market Japan

The Organ Support Supplements Market in Japan is projected to reach USD 7,514.2 million in 2025, growing at a 3.8% CAGR through 2035. Liver, heart, and brain health supplements dominate the landscape, accounting for more than half of the segment share, driven by the country’s aging population and focus on cognitive longevity. Japan’s Food with Function Claims (FFC) regulatory framework ensures consumer confidence in clinically validated organ support products. Functional beverages and capsules are the most preferred formats, reflecting Japan’s demand for convenient and science-backed daily health solutions.
  • Japan holds 10% of the global market in 2025.
  • Heart and brain support supplements dominate due to high lifestyle-related disease burden and an elderly population.
  • Growth is driven by regulatory credibility under FFC and consumer trust in functional formulations.

Opportunity Analysis of South Korea in Organ Support Supplements Market

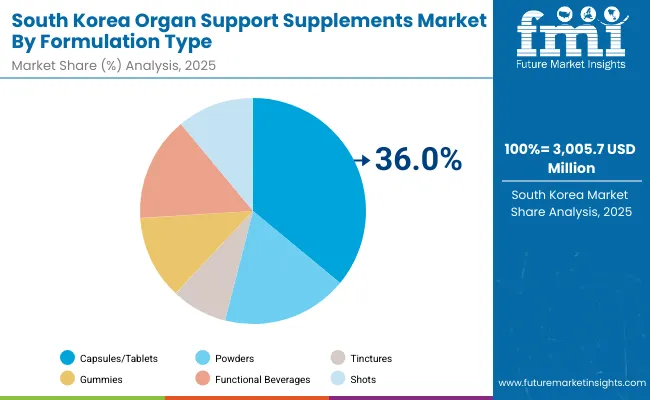
Organ Support Supplements Market South Korea

The Organ Support Supplements Market in South Korea is estimated at USD 3,005.7 million in 2025, with Capsules/Tablets holding 34.0% accounting for the largest revenue share. This dominance is driven by consumer preference for convenience and integration of supplements into daily diets. South Korea’s government-backed wellness initiatives and strong local innovation in nutraceuticals are accelerating demand for gut, brain, and liver health supplements. Younger demographics are adopting gummies and shots, while the aging population is driving steady consumption of cognitive and heart support products.
  • Market size for South Korea in 2025 is USD 3,005.7 million.
  • South Korea accounts for 4.0% of the global market.
  • Capsules and functional beverages dominate due to cultural integration of health drinks and daily supplement routines.

Competition Landscape

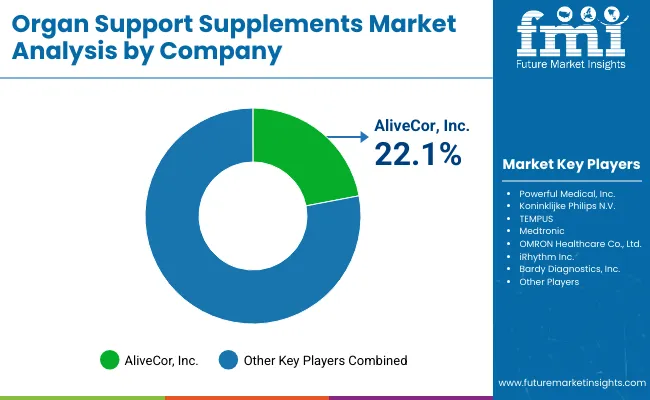
Organ Support Supplements Market By Company

The Organ Support Supplements market is moderately fragmented, with global leaders, established nutraceutical firms, and emerging wellness brands competing across categories such as liver, kidney, gut, brain, and heart health supplements. Industry leaders such as Amway (7.5% share), Herbalife Nutrition, and GNC Holdings maintain a strong foothold through extensive distribution networks, branded wellness ecosystems, and wide product portfolios.

These companies are expanding through direct-to-consumer (D2C) channels, personalized supplement packs, and e-commerce partnerships. Their strategies increasingly focus on clean-label claims, herbal/natural positioning, and clinical validation, enabling them to capture health-conscious consumers across demographics.

Established mid-sized players such as Nestlé Health Science, Bayer AG, NOW Foods, and Nature’s Bounty (Nestlé) cater to consumers seeking trusted and science-backed products. These firms are investing in clinical research, expanding into functional beverages and gummies, and offering targeted solutions for chronic disease prevention and geriatric health. Their presence in both retail pharmacies and digital marketplaces makes them highly relevant in mature economies like Europe and North America.

Emerging brands such as Swisse Wellness, Pharmavite (Nature Made), and Thorne HealthTech are carving out niches in premium, athlete-focused, and personalized nutrition categories. Their strength lies in customized formulations, subscription-based models, and digital health integration, including at-home diagnostics paired with supplement recommendations. Many are positioning themselves as lifestyle brands, appealing strongly to younger and fitness-oriented consumers in Asia-Pacific and Latin America.

As the market evolves, competitive differentiation is shifting from traditional capsule/tablet formats toward functional beverages, gummies, and personalized nutrition ecosystems. Companies focusing on evidence-based formulations, AI-driven personalization, and omnichannel engagement are expected to gain significant traction in the next decade.

Key Developments:

  • In Feb 2024, Herbalife launched theGLP-1 Nutrition Companion, a range of Classic and Vegan product combos in the USA and Puerto Rico. Designed for individuals on GLP-1 weight-loss medications, the combos deliver protein, fiber, and micronutrients to prevent malnutrition and support sustainable, long-term weight management.
  • In Jan 2024, Pharmavite, maker of NatureMade and subsidiary of Otsuka Holdings, acquired Bonafide Health for $425 million. The deal expands Pharmavite’s women’s health portfolio, complementing products like Equelle. Bonafide will continue operating independently, strengthening Pharmavite’s leadership in science-based nutraceuticals for menopause and aging-related health issues

Scope of the Report

Item Value
Market Value (2025) USD 75, 142.7 million
Supplement type Liver Support Supplements, Kidney Health Supplements, Heart Health Supplements, Lung Support Supplements, Brain & Cognitive Support Supplements, Gut Health Supplements, and Others
Application General Wellness, Athletes & Fitness Seekers, Chronic Disease Patients, Post-treatment Recovery, and Geriatric (65 Years and Above
formulation type Capsules/Tablets, Powders, Tinctures, Gummies, Functional Beverages, and Shots
Sales channel Retail Pharmacies, Drug Stores, Health & Wellness Stores, Hypermarkets and Supermarkets, and E-commerce/Online Sales
Regions Covered North America, Latin America, Western & Eastern Europe, East Asia, South Asia & Pacific, Middle East & Africa
Countries Covered USA, Brazil, China, India, Germany, France, UK etc.
Key Companies Profiled Amway, Herbalife Nutrition, GNC Holdings, Nestlé Health Science, Bayer AG, NOW Foods, Nature’s Bounty (Nestlé), Swisse Wellness, Pharmavite (Nature Made), Thorne HealthTech
Additional Attributes Dollar sales by application and regions, Adoption trends of Organ, Support Supplements, Rising demand in Biotech & Research-driven Nutrition, Growing demand across Pharmacies, E-commerce and Nutraceutical Manufacturing

Key Segments

By Supplements:

  • Liver Support Supplements
  • Kidney Health Supplements
  • Heart Health supplements
  • Lung Support Supplements
  • Brain & Cognitive Support Supplements
  • Gut Health Supplements
  • Others

By Formulation Type:

  • Capsules/Tablets
  • Powders
  • Tinctures
  • Gummies
  • Functional Beverages
  • Shots

By Application:

  • General Wellness
  • Athletes & Fitness Seekers
  • Chronic Disease Patients
  • Post-treatment Recovery
  • Geriatric (65 Years and Above)

By Sales Channel:

  • Retail Pharmacies
  • Drug Stores
  • Health & Wellness Stores
  • Hypermarket and Supermarket
  • E-commerce/Online Sales

By Region:

  • North America
  • Latin America
  • East Asia
  • South Asia & Pacific
  • Western Europe
  • Eastern Europe
  • Middle East & Africa

Table of Content

  1. Executive Summary
    • Global Market Outlook
    • Demand-side Trends
    • Supply-side Trends
    • Technology Roadmap Analysis
    • Analysis and Recommendations
  2. Market Overview
    • Market Coverage / Taxonomy
    • Market Definition / Scope / Limitations
  3. Market Background
    • Market Dynamics
      • Drivers
      • Restraints
      • Opportunity
      • Trends
    • Scenario Forecast
      • Demand in Optimistic Scenario
      • Demand in Likely Scenario
      • Demand in Conservative Scenario
    • Opportunity Map Analysis
    • Product Life Cycle Analysis
    • Supply Chain Analysis
      • Supply Side Participants and their Roles
        • Producers
        • Mid-Level Participants (Traders/ Agents/ Brokers)
        • Wholesalers and Distributors
      • Value Added and Value Created at Node in the Supply Chain
      • List of Raw Material Suppliers
      • List of Existing and Potential Buyer’s
    • Investment Feasibility Matrix
    • Value Chain Analysis
      • Profit Margin Analysis
      • Wholesalers and Distributors
      • Retailers
    • PESTLE and Porter’s Analysis
    • Regulatory Landscape
      • By Key Regions
      • By Key Countries
    • Regional Parent Market Outlook
    • Production and Consumption Statistics
    • Import and Export Statistics
  4. Global Market Analysis 2020 to 2024 and Forecast, 2025 to 2035
    • Historical Market Size Value (USD Million) & Volume (Units) Analysis, 2020 to 2024
    • Current and Future Market Size Value (USD Million) & Volume (Units) Projections, 2025 to 2035
      • Y-o-Y Growth Trend Analysis
      • Absolute $ Opportunity Analysis
  5. Global Market Analysis 2020 to 2024 and Forecast 2025 to 2035, By Supplements
    • Introduction / Key Findings
    • Historical Market Size Value (USD Million) & Volume (Units) Analysis By Supplements, 2020 to 2024
    • Current and Future Market Size Value (USD Million) & Volume (Units) Analysis and Forecast By Supplements, 2025 to 2035
      • Liver Support Supplements
      • Kidney Health Supplements
      • Heart Health supplements
      • Lung Support Supplements
      • Brain & Cognitive Support Supplements
      • Gut Health Supplements
      • Others
    • Y-o-Y Growth Trend Analysis By Supplements, 2020 to 2024
    • Absolute $ Opportunity Analysis By Supplements, 2025 to 2035
  6. Global Market Analysis 2020 to 2024 and Forecast 2025 to 2035, By Formulation Type
    • Introduction / Key Findings
    • Historical Market Size Value (USD Million) & Volume (Units) Analysis By Formulation Type, 2020 to 2024
    • Current and Future Market Size Value (USD Million) & Volume (Units) Analysis and Forecast By Formulation Type, 2025 to 2035
      • Capsules/Tablets
      • Powders
      • Tinctures
      • Gummies
      • Functional Beverages
      • Shots
    • Y-o-Y Growth Trend Analysis By Formulation Type, 2020 to 2024
    • Absolute $ Opportunity Analysis By Formulation Type, 2025 to 2035
  7. Global Market Analysis 2020 to 2024 and Forecast 2025 to 2035, By Application
    • Introduction / Key Findings
    • Historical Market Size Value (USD Million) & Volume (Units) Analysis By Application, 2020 to 2024
    • Current and Future Market Size Value (USD Million) & Volume (Units) Analysis and Forecast By Application, 2025 to 2035
      • General Wellness
      • Athletes & Fitness Seekers
      • Chronic Disease Patients
      • Post-treatment Recovery
      • Geriatric (65 Years and Above)
    • Y-o-Y Growth Trend Analysis By Application, 2020 to 2024
    • Absolute $ Opportunity Analysis By Application, 2025 to 2035
  8. Global Market Analysis 2020 to 2024 and Forecast 2025 to 2035, By Sales Channel
    • Introduction / Key Findings
    • Historical Market Size Value (USD Million) & Volume (Units) Analysis By Sales Channel, 2020 to 2024
    • Current and Future Market Size Value (USD Million) & Volume (Units) Analysis and Forecast By Sales Channel, 2025 to 2035
      • Retail Pharmacies
      • Drug Stores
      • Health & Wellness Stores
      • Hypermarket and Supermarket
      • E-commerce/Online Sales
    • Y-o-Y Growth Trend Analysis By Sales Channel, 2020 to 2024
    • Absolute $ Opportunity Analysis By Sales Channel, 2025 to 2035
  9. Global Market Analysis 2020 to 2024 and Forecast 2025 to 2035, By Region
    • Introduction
    • Historical Market Size Value (USD Million) & Volume (Units) Analysis By Region, 2020 to 2024
    • Current Market Size Value (USD Million) & Volume (Units) Analysis and Forecast By Region, 2025 to 2035
      • North America
      • Latin America
      • East Asia
      • South Asia & Pacific
      • Western Europe
      • Eastern Europe
      • Middle East & Africa
    • Market Attractiveness Analysis By Region
  10. North America Market Analysis 2020 to 2024 and Forecast 2025 to 2035, By Country
    • Historical Market Size Value (USD Million) & Volume (Units) Trend Analysis By Market Taxonomy, 2020 to 2024
    • Market Size Value (USD Million) & Volume (Units) Forecast By Market Taxonomy, 2025 to 2035
      • By Country
        • USA
        • Canada
        • Mexico
      • By Supplements
      • By Formulation Type
      • By Application
      • By Sales Channel
    • Market Attractiveness Analysis
      • By Country
      • By Supplements
      • By Formulation Type
      • By Application
      • By Sales Channel
    • Key Takeaways
  11. Latin America Market Analysis 2020 to 2024 and Forecast 2025 to 2035, By Country
    • Historical Market Size Value (USD Million) & Volume (Units) Trend Analysis By Market Taxonomy, 2020 to 2024
    • Market Size Value (USD Million) & Volume (Units) Forecast By Market Taxonomy, 2025 to 2035
      • By Country
        • Brazil
        • Argentina
        • Rest of Latin America
      • By Supplements
      • By Formulation Type
      • By Application
      • By Sales Channel
    • Market Attractiveness Analysis
      • By Country
      • By Supplements
      • By Formulation Type
      • By Application
      • By Sales Channel
    • Key Takeaways
  12. East Asia Market Analysis 2020 to 2024 and Forecast 2025 to 2035, By Country
    • Historical Market Size Value (USD Million) & Volume (Units) Trend Analysis By Market Taxonomy, 2020 to 2024
    • Market Size Value (USD Million) & Volume (Units) Forecast By Market Taxonomy, 2025 to 2035
      • By Country
        • China
        • Japan
        • South Korea
      • By Supplements
      • By Formulation Type
      • By Application
      • By Sales Channel
    • Market Attractiveness Analysis
      • By Country
      • By Supplements
      • By Formulation Type
      • By Application
      • By Sales Channel
    • Key Takeaways
  13. South Asia & Pacific Market Analysis 2020 to 2024 and Forecast 2025 to 2035, By Country
    • Historical Market Size Value (USD Million) & Volume (Units) Trend Analysis By Market Taxonomy, 2020 to 2024
    • Market Size Value (USD Million) & Volume (Units) Forecast By Market Taxonomy, 2025 to 2035
      • By Country
        • India
        • ASEAN Countries
        • Australia& New Zealand
        • Rest of South Asia
      • By Supplements
      • By Formulation Type
      • By Application
      • By Sales Channel
    • Market Attractiveness Analysis
      • By Country
      • By Supplements
      • By Formulation Type
      • By Application
      • By Sales Channel
    • Key Takeaways
  14. Western Europe Market Analysis 2020 to 2024 and Forecast 2025 to 2035, By Country
    • Historical Market Size Value (USD Million) & Volume (Units) Trend Analysis By Market Taxonomy, 2020 to 2024
    • Market Size Value (USD Million) & Volume (Units) Forecast By Market Taxonomy, 2025 to 2035
      • By Country
        • Germany
        • UK
        • France
        • Italy
        • Spain
        • BENELUX
        • Nordic Countries
        • Rest of Western Europe
      • By Supplements
      • By Formulation Type
      • By Application
      • By Sales Channel
    • Market Attractiveness Analysis
      • By Country
      • By Supplements
      • By Formulation Type
      • By Application
      • By Sales Channel
    • Key Takeaways
  15. Eastern Europe Market Analysis 2020 to 2024 and Forecast 2025 to 2035, By Country
    • Historical Market Size Value (USD Million) & Volume (Units) Trend Analysis By Market Taxonomy, 2020 to 2024
    • Market Size Value (USD Million) & Volume (Units) Forecast By Market Taxonomy, 2025 to 2035
      • By Country
        • Russia
        • Hungary
        • Poland
        • Rest of Eastern Europe
      • By Supplements
      • By Formulation Type
      • By Application
      • By Sales Channel
    • Market Attractiveness Analysis
      • By Country
      • By Supplements
      • By Formulation Type
      • By Application
      • By Sales Channel
    • Key Takeaways
  16. Middle East & Africa Market Analysis 2020 to 2024 and Forecast 2025 to 2035, By Country
    • Historical Market Size Value (USD Million) & Volume (Units) Trend Analysis By Market Taxonomy, 2020 to 2024
    • Market Size Value (USD Million) & Volume (Units) Forecast By Market Taxonomy, 2025 to 2035
      • By Country
        • Saudi Arabia
        • Türkiye
        • South Africa
        • Other African Union
        • Rest of Middle East & Africa
      • By Supplements
      • By Formulation Type
      • By Application
      • By Sales Channel
    • Market Attractiveness Analysis
      • By Country
      • By Supplements
      • By Formulation Type
      • By Application
      • By Sales Channel
    • Key Takeaways
  17. Key Countries Market Analysis
    • USA
      • Pricing Analysis
      • Market Share Analysis, 2024
        • By Supplements
        • By Formulation Type
        • By Application
        • By Sales Channel
    • Brazil
      • Pricing Analysis
      • Market Share Analysis, 2024
        • By Supplements
        • By Formulation Type
        • By Application
        • By Sales Channel
    • China
      • Pricing Analysis
      • Market Share Analysis, 2024
        • By Supplements
        • By Formulation Type
        • By Application
        • By Sales Channel
    • India
      • Pricing Analysis
      • Market Share Analysis, 2024
        • By Supplements
        • By Formulation Type
        • By Application
        • By Sales Channel
    • Europe
      • Pricing Analysis
      • Market Share Analysis, 2024
        • By Supplements
        • By Formulation Type
        • By Application
        • By Sales Channel
    • Germany
      • Pricing Analysis
      • Market Share Analysis, 2024
        • By Supplements
        • By Formulation Type
        • By Application
        • By Sales Channel
    • France
      • Pricing Analysis
      • Market Share Analysis, 2024
        • By Supplements
        • By Formulation Type
        • By Application
        • By Sales Channel
    • UK
      • Pricing Analysis
      • Market Share Analysis, 2024
        • By Supplements
        • By Formulation Type
        • By Application
        • By Sales Channel
  18. Market Structure Analysis
    • Competition Dashboard
    • Competition Benchmarking
    • Market Share Analysis of Top Players
      • By Regional
      • By Supplements
      • By Formulation Type
      • By Application
      • By Sales Channel
  19. Competition Analysis
    • Competition Deep Dive
      • Herbalife Nutrition
        • Overview
        • Product Portfolio
        • Profitability by Market Segments (Product/Age /Sales Channel/Region)
        • Sales Footprint
        • Strategy Overview
          • Marketing Strategy
          • Product Strategy
          • Channel Strategy
      • GNC Holdings
        • Overview
        • Product Portfolio
        • Profitability by Market Segments (Product/Age /Sales Channel/Region)
        • Sales Footprint
        • Strategy Overview
          • Marketing Strategy
          • Product Strategy
          • Channel Strategy
      • Nestlé Health Science
        • Overview
        • Product Portfolio
        • Profitability by Market Segments (Product/Age /Sales Channel/Region)
        • Sales Footprint
        • Strategy Overview
          • Marketing Strategy
          • Product Strategy
          • Channel Strategy
      • Bayer AG
        • Overview
        • Product Portfolio
        • Profitability by Market Segments (Product/Age /Sales Channel/Region)
        • Sales Footprint
        • Strategy Overview
          • Marketing Strategy
          • Product Strategy
          • Channel Strategy
      • NOW Foods
        • Overview
        • Product Portfolio
        • Profitability by Market Segments (Product/Age /Sales Channel/Region)
        • Sales Footprint
        • Strategy Overview
          • Marketing Strategy
          • Product Strategy
          • Channel Strategy
      • Nature’s Bounty (Nestlé)
        • Overview
        • Product Portfolio
        • Profitability by Market Segments (Product/Age /Sales Channel/Region)
        • Sales Footprint
        • Strategy Overview
          • Marketing Strategy
          • Product Strategy
          • Channel Strategy
      • Swisse Wellness
        • Overview
        • Product Portfolio
        • Profitability by Market Segments (Product/Age /Sales Channel/Region)
        • Sales Footprint
        • Strategy Overview
          • Marketing Strategy
          • Product Strategy
          • Channel Strategy
      • Pharmavite (Nature Made)
        • Overview
        • Product Portfolio
        • Profitability by Market Segments (Product/Age /Sales Channel/Region)
        • Sales Footprint
        • Strategy Overview
          • Marketing Strategy
          • Product Strategy
          • Channel Strategy
      • Thorne HealthTech
        • Overview
        • Product Portfolio
        • Profitability by Market Segments (Product/Age /Sales Channel/Region)
        • Sales Footprint
        • Strategy Overview
          • Marketing Strategy
          • Product Strategy
          • Channel Strategy
  20. Assumptions & Acronyms Used
  21. Research Methodology

List of Tables

  • Table 1: Global Market Value (USD Million) Forecast by Region, 2020-2035
  • Table 2: Global Market Volume (Units) Forecast by Region, 2020-2035
  • Table 3: Global Market Value (USD Million) Forecast by Supplements, 2020-2035
  • Table 4: Global Market Volume (Units) Forecast by Supplements, 2020-2035
  • Table 5: Global Market Value (USD Million) Forecast by Formulation Type, 2020-2035
  • Table 6: Global Market Volume (Units) Forecast by Formulation Type, 2020-2035
  • Table 7: Global Market Value (USD Million) Forecast by Application, 2020-2035
  • Table 8: Global Market Volume (Units) Forecast by Application, 2020-2035
  • Table 9: Global Market Value (USD Million) Forecast by Sales Channel, 2020-2035
  • Table 10: Global Market Volume (Units) Forecast by Sales Channel, 2020-2035
  • Table 11: North America Market Value (USD Million) Forecast by Country, 2020-2035
  • Table 12: North America Market Volume (Units) Forecast by Country, 2020-2035
  • Table 13: North America Market Value (USD Million) Forecast by Supplements, 2020-2035
  • Table 14: North America Market Volume (Units) Forecast by Supplements, 2020-2035
  • Table 15: North America Market Value (USD Million) Forecast by Formulation Type, 2020-2035
  • Table 16: North America Market Volume (Units) Forecast by Formulation Type, 2020-2035
  • Table 17: North America Market Value (USD Million) Forecast by Application, 2020-2035
  • Table 18: North America Market Volume (Units) Forecast by Application, 2020-2035
  • Table 19: North America Market Value (USD Million) Forecast by Sales Channel, 2020-2035
  • Table 20: North America Market Volume (Units) Forecast by Sales Channel, 2020-2035
  • Table 21: Latin America Market Value (USD Million) Forecast by Country, 2020-2035
  • Table 22: Latin America Market Volume (Units) Forecast by Country, 2020-2035
  • Table 23: Latin America Market Value (USD Million) Forecast by Supplements, 2020-2035
  • Table 24: Latin America Market Volume (Units) Forecast by Supplements, 2020-2035
  • Table 25: Latin America Market Value (USD Million) Forecast by Formulation Type, 2020-2035
  • Table 26: Latin America Market Volume (Units) Forecast by Formulation Type, 2020-2035
  • Table 27: Latin America Market Value (USD Million) Forecast by Application, 2020-2035
  • Table 28: Latin America Market Volume (Units) Forecast by Application, 2020-2035
  • Table 29: Latin America Market Value (USD Million) Forecast by Sales Channel, 2020-2035
  • Table 30: Latin America Market Volume (Units) Forecast by Sales Channel, 2020-2035
  • Table 31: East Asia Market Value (USD Million) Forecast by Country, 2020-2035
  • Table 32: East Asia Market Volume (Units) Forecast by Country, 2020-2035
  • Table 33: East Asia Market Value (USD Million) Forecast by Supplements, 2020-2035
  • Table 34: East Asia Market Volume (Units) Forecast by Supplements, 2020-2035
  • Table 35: East Asia Market Value (USD Million) Forecast by Formulation Type, 2020-2035
  • Table 36: East Asia Market Volume (Units) Forecast by Formulation Type, 2020-2035
  • Table 37: East Asia Market Value (USD Million) Forecast by Application, 2020-2035
  • Table 38: East Asia Market Volume (Units) Forecast by Application, 2020-2035
  • Table 39: East Asia Market Value (USD Million) Forecast by Sales Channel, 2020-2035
  • Table 40: East Asia Market Volume (Units) Forecast by Sales Channel, 2020-2035
  • Table 41: South Asia & Pacific Market Value (USD Million) Forecast by Country, 2020-2035
  • Table 42: South Asia & Pacific Market Volume (Units) Forecast by Country, 2020-2035
  • Table 43: South Asia & Pacific Market Value (USD Million) Forecast by Supplements, 2020-2035
  • Table 44: South Asia & Pacific Market Volume (Units) Forecast by Supplements, 2020-2035
  • Table 45: South Asia & Pacific Market Value (USD Million) Forecast by Formulation Type, 2020-2035
  • Table 46: South Asia & Pacific Market Volume (Units) Forecast by Formulation Type, 2020-2035
  • Table 47: South Asia & Pacific Market Value (USD Million) Forecast by Application, 2020-2035
  • Table 48: South Asia & Pacific Market Volume (Units) Forecast by Application, 2020-2035
  • Table 49: South Asia & Pacific Market Value (USD Million) Forecast by Sales Channel, 2020-2035
  • Table 50: South Asia & Pacific Market Volume (Units) Forecast by Sales Channel, 2020-2035
  • Table 51: Western Europe Market Value (USD Million) Forecast by Country, 2020-2035
  • Table 52: Western Europe Market Volume (Units) Forecast by Country, 2020-2035
  • Table 53: Western Europe Market Value (USD Million) Forecast by Supplements, 2020-2035
  • Table 54: Western Europe Market Volume (Units) Forecast by Supplements, 2020-2035
  • Table 55: Western Europe Market Value (USD Million) Forecast by Formulation Type, 2020-2035
  • Table 56: Western Europe Market Volume (Units) Forecast by Formulation Type, 2020-2035
  • Table 57: Western Europe Market Value (USD Million) Forecast by Application, 2020-2035
  • Table 58: Western Europe Market Volume (Units) Forecast by Application, 2020-2035
  • Table 59: Western Europe Market Value (USD Million) Forecast by Sales Channel, 2020-2035
  • Table 60: Western Europe Market Volume (Units) Forecast by Sales Channel, 2020-2035
  • Table 61: Eastern Europe  Market Value (USD Million) Forecast by Country, 2020-2035
  • Table 62: Eastern Europe  Market Volume (Units) Forecast by Country, 2020-2035
  • Table 63: Eastern Europe  Market Value (USD Million) Forecast by Supplements, 2020-2035
  • Table 64: Eastern Europe  Market Volume (Units) Forecast by Supplements, 2020-2035
  • Table 65: Eastern Europe  Market Value (USD Million) Forecast by Formulation Type, 2020-2035
  • Table 66: Eastern Europe  Market Volume (Units) Forecast by Formulation Type, 2020-2035
  • Table 67: Eastern Europe  Market Value (USD Million) Forecast by Application, 2020-2035
  • Table 68: Eastern Europe  Market Volume (Units) Forecast by Application, 2020-2035
  • Table 69: Eastern Europe  Market Value (USD Million) Forecast by Sales Channel, 2020-2035
  • Table 70: Eastern Europe  Market Volume (Units) Forecast by Sales Channel, 2020-2035
  • Table 71: Middle East & Africa Market Value (USD Million) Forecast by Country, 2020-2035
  • Table 72: Middle East & Africa Market Volume (Units) Forecast by Country, 2020-2035
  • Table 73: Middle East & Africa Market Value (USD Million) Forecast by Supplements, 2020-2035
  • Table 74: Middle East & Africa Market Volume (Units) Forecast by Supplements, 2020-2035
  • Table 75: Middle East & Africa Market Value (USD Million) Forecast by Formulation Type, 2020-2035
  • Table 76: Middle East & Africa Market Volume (Units) Forecast by Formulation Type, 2020-2035
  • Table 77: Middle East & Africa Market Value (USD Million) Forecast by Application, 2020-2035
  • Table 78: Middle East & Africa Market Volume (Units) Forecast by Application, 2020-2035
  • Table 79: Middle East & Africa Market Value (USD Million) Forecast by Sales Channel, 2020-2035
  • Table 80: Middle East & Africa Market Volume (Units) Forecast by Sales Channel, 2020-2035

List of Figures

  • Figure 1: Global Market Value (USD Million) by Supplements, 2025-2035
  • Figure 2: Global Market Value (USD Million) by Formulation Type, 2025-2035
  • Figure 3: Global Market Value (USD Million) by Application, 2025-2035
  • Figure 4: Global Market Value (USD Million) by Sales Channel, 2025-2035
  • Figure 5: Global Market Value (USD Million) by Region, 2025-2035
  • Figure 6: Global Market Value (USD Million) Analysis by Region, 2020-2035
  • Figure 7: Global Market Volume (Units) Analysis by Region, 2020-2035
  • Figure 8: Global Market Value Share (%) and BPS Analysis by Region, 2025-2035
  • Figure 9: Global Market Y-o-Y Growth (%) Projections by Region, 2025-2035
  • Figure 10: Global Market Value (USD Million) Analysis by Supplements, 2020-2035
  • Figure 11: Global Market Volume (Units) Analysis by Supplements, 2020-2035
  • Figure 12: Global Market Value Share (%) and BPS Analysis by Supplements, 2025-2035
  • Figure 13: Global Market Y-o-Y Growth (%) Projections by Supplements, 2025-2035
  • Figure 14: Global Market Value (USD Million) Analysis by Formulation Type, 2020-2035
  • Figure 15: Global Market Volume (Units) Analysis by Formulation Type, 2020-2035
  • Figure 16: Global Market Value Share (%) and BPS Analysis by Formulation Type, 2025-2035
  • Figure 17: Global Market Y-o-Y Growth (%) Projections by Formulation Type, 2025-2035
  • Figure 18: Global Market Value (USD Million) Analysis by Application, 2020-2035
  • Figure 19: Global Market Volume (Units) Analysis by Application, 2020-2035
  • Figure 20: Global Market Value Share (%) and BPS Analysis by Application, 2025-2035
  • Figure 21: Global Market Y-o-Y Growth (%) Projections by Application, 2025-2035
  • Figure 22: Global Market Value (USD Million) Analysis by Sales Channel, 2020-2035
  • Figure 23: Global Market Volume (Units) Analysis by Sales Channel, 2020-2035
  • Figure 24: Global Market Value Share (%) and BPS Analysis by Sales Channel, 2025-2035
  • Figure 25: Global Market Y-o-Y Growth (%) Projections by Sales Channel, 2025-2035
  • Figure 26: Global Market Attractiveness by Supplements, 2025-2035
  • Figure 27: Global Market Attractiveness by Formulation Type, 2025-2035
  • Figure 28: Global Market Attractiveness by Application, 2025-2035
  • Figure 29: Global Market Attractiveness by Sales Channel, 2025-2035
  • Figure 30: Global Market Attractiveness by Region, 2025-2035
  • Figure 31: North America Market Value (USD Million) by Supplements, 2025-2035
  • Figure 32: North America Market Value (USD Million) by Formulation Type, 2025-2035
  • Figure 33: North America Market Value (USD Million) by Application, 2025-2035
  • Figure 34: North America Market Value (USD Million) by Sales Channel, 2025-2035
  • Figure 35: North America Market Value (USD Million) by Country, 2025-2035
  • Figure 36: North America Market Value (USD Million) Analysis by Country, 2020-2035
  • Figure 37: North America Market Volume (Units) Analysis by Country, 2020-2035
  • Figure 38: North America Market Value Share (%) and BPS Analysis by Country, 2025-2035
  • Figure 39: North America Market Y-o-Y Growth (%) Projections by Country, 2025-2035
  • Figure 40: North America Market Value (USD Million) Analysis by Supplements, 2020-2035
  • Figure 41: North America Market Volume (Units) Analysis by Supplements, 2020-2035
  • Figure 42: North America Market Value Share (%) and BPS Analysis by Supplements, 2025-2035
  • Figure 43: North America Market Y-o-Y Growth (%) Projections by Supplements, 2025-2035
  • Figure 44: North America Market Value (USD Million) Analysis by Formulation Type, 2020-2035
  • Figure 45: North America Market Volume (Units) Analysis by Formulation Type, 2020-2035
  • Figure 46: North America Market Value Share (%) and BPS Analysis by Formulation Type, 2025-2035
  • Figure 47: North America Market Y-o-Y Growth (%) Projections by Formulation Type, 2025-2035
  • Figure 48: North America Market Value (USD Million) Analysis by Application, 2020-2035
  • Figure 49: North America Market Volume (Units) Analysis by Application, 2020-2035
  • Figure 50: North America Market Value Share (%) and BPS Analysis by Application, 2025-2035
  • Figure 51: North America Market Y-o-Y Growth (%) Projections by Application, 2025-2035
  • Figure 52: North America Market Value (USD Million) Analysis by Sales Channel, 2020-2035
  • Figure 53: North America Market Volume (Units) Analysis by Sales Channel, 2020-2035
  • Figure 54: North America Market Value Share (%) and BPS Analysis by Sales Channel, 2025-2035
  • Figure 55: North America Market Y-o-Y Growth (%) Projections by Sales Channel, 2025-2035
  • Figure 56: North America Market Attractiveness by Supplements, 2025-2035
  • Figure 57: North America Market Attractiveness by Formulation Type, 2025-2035
  • Figure 58: North America Market Attractiveness by Application, 2025-2035
  • Figure 59: North America Market Attractiveness by Sales Channel, 2025-2035
  • Figure 60: North America Market Attractiveness by Country, 2025-2035
  • Figure 61: Latin America Market Value (USD Million) by Supplements, 2025-2035
  • Figure 62: Latin America Market Value (USD Million) by Formulation Type, 2025-2035
  • Figure 63: Latin America Market Value (USD Million) by Application, 2025-2035
  • Figure 64: Latin America Market Value (USD Million) by Sales Channel, 2025-2035
  • Figure 65: Latin America Market Value (USD Million) by Country, 2025-2035
  • Figure 66: Latin America Market Value (USD Million) Analysis by Country, 2020-2035
  • Figure 67: Latin America Market Volume (Units) Analysis by Country, 2020-2035
  • Figure 68: Latin America Market Value Share (%) and BPS Analysis by Country, 2025-2035
  • Figure 69: Latin America Market Y-o-Y Growth (%) Projections by Country, 2025-2035
  • Figure 70: Latin America Market Value (USD Million) Analysis by Supplements, 2020-2035
  • Figure 71: Latin America Market Volume (Units) Analysis by Supplements, 2020-2035
  • Figure 72: Latin America Market Value Share (%) and BPS Analysis by Supplements, 2025-2035
  • Figure 73: Latin America Market Y-o-Y Growth (%) Projections by Supplements, 2025-2035
  • Figure 74: Latin America Market Value (USD Million) Analysis by Formulation Type, 2020-2035
  • Figure 75: Latin America Market Volume (Units) Analysis by Formulation Type, 2020-2035
  • Figure 76: Latin America Market Value Share (%) and BPS Analysis by Formulation Type, 2025-2035
  • Figure 77: Latin America Market Y-o-Y Growth (%) Projections by Formulation Type, 2025-2035
  • Figure 78: Latin America Market Value (USD Million) Analysis by Application, 2020-2035
  • Figure 79: Latin America Market Volume (Units) Analysis by Application, 2020-2035
  • Figure 80: Latin America Market Value Share (%) and BPS Analysis by Application, 2025-2035
  • Figure 81: Latin America Market Y-o-Y Growth (%) Projections by Application, 2025-2035
  • Figure 82: Latin America Market Value (USD Million) Analysis by Sales Channel, 2020-2035
  • Figure 83: Latin America Market Volume (Units) Analysis by Sales Channel, 2020-2035
  • Figure 84: Latin America Market Value Share (%) and BPS Analysis by Sales Channel, 2025-2035
  • Figure 85: Latin America Market Y-o-Y Growth (%) Projections by Sales Channel, 2025-2035
  • Figure 86: Latin America Market Attractiveness by Supplements, 2025-2035
  • Figure 87: Latin America Market Attractiveness by Formulation Type, 2025-2035
  • Figure 88: Latin America Market Attractiveness by Application, 2025-2035
  • Figure 89: Latin America Market Attractiveness by Sales Channel, 2025-2035
  • Figure 90: Latin America Market Attractiveness by Country, 2025-2035
  • Figure 91: East Asia Market Value (USD Million) by Supplements, 2025-2035
  • Figure 92: East Asia Market Value (USD Million) by Formulation Type, 2025-2035
  • Figure 93: East Asia Market Value (USD Million) by Application, 2025-2035
  • Figure 94: East Asia Market Value (USD Million) by Sales Channel, 2025-2035
  • Figure 95: East Asia Market Value (USD Million) by Country, 2025-2035
  • Figure 96: East Asia Market Value (USD Million) Analysis by Country, 2020-2035
  • Figure 97: East Asia Market Volume (Units) Analysis by Country, 2020-2035
  • Figure 98: East Asia Market Value Share (%) and BPS Analysis by Country, 2025-2035
  • Figure 99: East Asia Market Y-o-Y Growth (%) Projections by Country, 2025-2035
  • Figure 100: East Asia Market Value (USD Million) Analysis by Supplements, 2020-2035
  • Figure 101: East Asia Market Volume (Units) Analysis by Supplements, 2020-2035
  • Figure 102: East Asia Market Value Share (%) and BPS Analysis by Supplements, 2025-2035
  • Figure 103: East Asia Market Y-o-Y Growth (%) Projections by Supplements, 2025-2035
  • Figure 104: East Asia Market Value (USD Million) Analysis by Formulation Type, 2020-2035
  • Figure 105: East Asia Market Volume (Units) Analysis by Formulation Type, 2020-2035
  • Figure 106: East Asia Market Value Share (%) and BPS Analysis by Formulation Type, 2025-2035
  • Figure 107: East Asia Market Y-o-Y Growth (%) Projections by Formulation Type, 2025-2035
  • Figure 108: East Asia Market Value (USD Million) Analysis by Application, 2020-2035
  • Figure 109: East Asia Market Volume (Units) Analysis by Application, 2020-2035
  • Figure 110: East Asia Market Value Share (%) and BPS Analysis by Application, 2025-2035
  • Figure 111: East Asia Market Y-o-Y Growth (%) Projections by Application, 2025-2035
  • Figure 112: East Asia Market Value (USD Million) Analysis by Sales Channel, 2020-2035
  • Figure 113: East Asia Market Volume (Units) Analysis by Sales Channel, 2020-2035
  • Figure 114: East Asia Market Value Share (%) and BPS Analysis by Sales Channel, 2025-2035
  • Figure 115: East Asia Market Y-o-Y Growth (%) Projections by Sales Channel, 2025-2035
  • Figure 116: East Asia Market Attractiveness by Supplements, 2025-2035
  • Figure 117: East Asia Market Attractiveness by Formulation Type, 2025-2035
  • Figure 118: East Asia Market Attractiveness by Application, 2025-2035
  • Figure 119: East Asia Market Attractiveness by Sales Channel, 2025-2035
  • Figure 120: East Asia Market Attractiveness by Country, 2025-2035
  • Figure 121: South Asia & Pacific Market Value (USD Million) by Supplements, 2025-2035
  • Figure 122: South Asia & Pacific Market Value (USD Million) by Formulation Type, 2025-2035
  • Figure 123: South Asia & Pacific Market Value (USD Million) by Application, 2025-2035
  • Figure 124: South Asia & Pacific Market Value (USD Million) by Sales Channel, 2025-2035
  • Figure 125: South Asia & Pacific Market Value (USD Million) by Country, 2025-2035
  • Figure 126: South Asia & Pacific Market Value (USD Million) Analysis by Country, 2020-2035
  • Figure 127: South Asia & Pacific Market Volume (Units) Analysis by Country, 2020-2035
  • Figure 128: South Asia & Pacific Market Value Share (%) and BPS Analysis by Country, 2025-2035
  • Figure 129: South Asia & Pacific Market Y-o-Y Growth (%) Projections by Country, 2025-2035
  • Figure 130: South Asia & Pacific Market Value (USD Million) Analysis by Supplements, 2020-2035
  • Figure 131: South Asia & Pacific Market Volume (Units) Analysis by Supplements, 2020-2035
  • Figure 132: South Asia & Pacific Market Value Share (%) and BPS Analysis by Supplements, 2025-2035
  • Figure 133: South Asia & Pacific Market Y-o-Y Growth (%) Projections by Supplements, 2025-2035
  • Figure 134: South Asia & Pacific Market Value (USD Million) Analysis by Formulation Type, 2020-2035
  • Figure 135: South Asia & Pacific Market Volume (Units) Analysis by Formulation Type, 2020-2035
  • Figure 136: South Asia & Pacific Market Value Share (%) and BPS Analysis by Formulation Type, 2025-2035
  • Figure 137: South Asia & Pacific Market Y-o-Y Growth (%) Projections by Formulation Type, 2025-2035
  • Figure 138: South Asia & Pacific Market Value (USD Million) Analysis by Application, 2020-2035
  • Figure 139: South Asia & Pacific Market Volume (Units) Analysis by Application, 2020-2035
  • Figure 140: South Asia & Pacific Market Value Share (%) and BPS Analysis by Application, 2025-2035
  • Figure 141: South Asia & Pacific Market Y-o-Y Growth (%) Projections by Application, 2025-2035
  • Figure 142: South Asia & Pacific Market Value (USD Million) Analysis by Sales Channel, 2020-2035
  • Figure 143: South Asia & Pacific Market Volume (Units) Analysis by Sales Channel, 2020-2035
  • Figure 144: South Asia & Pacific Market Value Share (%) and BPS Analysis by Sales Channel, 2025-2035
  • Figure 145: South Asia & Pacific Market Y-o-Y Growth (%) Projections by Sales Channel, 2025-2035
  • Figure 146: South Asia & Pacific Market Attractiveness by Supplements, 2025-2035
  • Figure 147: South Asia & Pacific Market Attractiveness by Formulation Type, 2025-2035
  • Figure 148: South Asia & Pacific Market Attractiveness by Application, 2025-2035
  • Figure 149: South Asia & Pacific Market Attractiveness by Sales Channel, 2025-2035
  • Figure 150: South Asia & Pacific Market Attractiveness by Country, 2025-2035
  • Figure 151: Western Europe Market Value (USD Million) by Supplements, 2025-2035
  • Figure 152: Western Europe Market Value (USD Million) by Formulation Type, 2025-2035
  • Figure 153: Western Europe Market Value (USD Million) by Application, 2025-2035
  • Figure 154: Western Europe Market Value (USD Million) by Sales Channel, 2025-2035
  • Figure 155: Western Europe Market Value (USD Million) by Country, 2025-2035
  • Figure 156: Western Europe Market Value (USD Million) Analysis by Country, 2020-2035
  • Figure 157: Western Europe Market Volume (Units) Analysis by Country, 2020-2035
  • Figure 158: Western Europe Market Value Share (%) and BPS Analysis by Country, 2025-2035
  • Figure 159: Western Europe Market Y-o-Y Growth (%) Projections by Country, 2025-2035
  • Figure 160: Western Europe Market Value (USD Million) Analysis by Supplements, 2020-2035
  • Figure 161: Western Europe Market Volume (Units) Analysis by Supplements, 2020-2035
  • Figure 162: Western Europe Market Value Share (%) and BPS Analysis by Supplements, 2025-2035
  • Figure 163: Western Europe Market Y-o-Y Growth (%) Projections by Supplements, 2025-2035
  • Figure 164: Western Europe Market Value (USD Million) Analysis by Formulation Type, 2020-2035
  • Figure 165: Western Europe Market Volume (Units) Analysis by Formulation Type, 2020-2035
  • Figure 166: Western Europe Market Value Share (%) and BPS Analysis by Formulation Type, 2025-2035
  • Figure 167: Western Europe Market Y-o-Y Growth (%) Projections by Formulation Type, 2025-2035
  • Figure 168: Western Europe Market Value (USD Million) Analysis by Application, 2020-2035
  • Figure 169: Western Europe Market Volume (Units) Analysis by Application, 2020-2035
  • Figure 170: Western Europe Market Value Share (%) and BPS Analysis by Application, 2025-2035
  • Figure 171: Western Europe Market Y-o-Y Growth (%) Projections by Application, 2025-2035
  • Figure 172: Western Europe Market Value (USD Million) Analysis by Sales Channel, 2020-2035
  • Figure 173: Western Europe Market Volume (Units) Analysis by Sales Channel, 2020-2035
  • Figure 174: Western Europe Market Value Share (%) and BPS Analysis by Sales Channel, 2025-2035
  • Figure 175: Western Europe Market Y-o-Y Growth (%) Projections by Sales Channel, 2025-2035
  • Figure 176: Western Europe Market Attractiveness by Supplements, 2025-2035
  • Figure 177: Western Europe Market Attractiveness by Formulation Type, 2025-2035
  • Figure 178: Western Europe Market Attractiveness by Application, 2025-2035
  • Figure 179: Western Europe Market Attractiveness by Sales Channel, 2025-2035
  • Figure 180: Western Europe Market Attractiveness by Country, 2025-2035
  • Figure 181: Eastern Europe Market Value (USD Million) by Supplements, 2025-2035
  • Figure 182: Eastern Europe Market Value (USD Million) by Formulation Type, 2025-2035
  • Figure 183: Eastern Europe Market Value (USD Million) by Application, 2025-2035
  • Figure 184: Eastern Europe Market Value (USD Million) by Sales Channel, 2025-2035
  • Figure 185: Eastern Europe Market Value (USD Million) by Country, 2025-2035
  • Figure 186: Eastern Europe Market Value (USD Million) Analysis by Country, 2020-2035
  • Figure 187: Eastern Europe Market Volume (Units) Analysis by Country, 2020-2035
  • Figure 188: Eastern Europe Market Value Share (%) and BPS Analysis by Country, 2025-2035
  • Figure 189: Eastern Europe Market Y-o-Y Growth (%) Projections by Country, 2025-2035
  • Figure 190: Eastern Europe Market Value (USD Million) Analysis by Supplements, 2020-2035
  • Figure 191: Eastern Europe Market Volume (Units) Analysis by Supplements, 2020-2035
  • Figure 192: Eastern Europe Market Value Share (%) and BPS Analysis by Supplements, 2025-2035
  • Figure 193: Eastern Europe Market Y-o-Y Growth (%) Projections by Supplements, 2025-2035
  • Figure 194: Eastern Europe Market Value (USD Million) Analysis by Formulation Type, 2020-2035
  • Figure 195: Eastern Europe Market Volume (Units) Analysis by Formulation Type, 2020-2035
  • Figure 196: Eastern Europe Market Value Share (%) and BPS Analysis by Formulation Type, 2025-2035
  • Figure 197: Eastern Europe Market Y-o-Y Growth (%) Projections by Formulation Type, 2025-2035
  • Figure 198: Eastern Europe Market Value (USD Million) Analysis by Application, 2020-2035
  • Figure 199: Eastern Europe Market Volume (Units) Analysis by Application, 2020-2035
  • Figure 200: Eastern Europe Market Value Share (%) and BPS Analysis by Application, 2025-2035
  • Figure 201: Eastern Europe Market Y-o-Y Growth (%) Projections by Application, 2025-2035
  • Figure 202: Eastern Europe Market Value (USD Million) Analysis by Sales Channel, 2020-2035
  • Figure 203: Eastern Europe Market Volume (Units) Analysis by Sales Channel, 2020-2035
  • Figure 204: Eastern Europe Market Value Share (%) and BPS Analysis by Sales Channel, 2025-2035
  • Figure 205: Eastern Europe Market Y-o-Y Growth (%) Projections by Sales Channel, 2025-2035
  • Figure 206: Eastern Europe Market Attractiveness by Supplements, 2025-2035
  • Figure 207: Eastern Europe Market Attractiveness by Formulation Type, 2025-2035
  • Figure 208: Eastern Europe Market Attractiveness by Application, 2025-2035
  • Figure 209: Eastern Europe Market Attractiveness by Sales Channel, 2025-2035
  • Figure 210: Eastern Europe Market Attractiveness by Country, 2025-2035
  • Figure 211: Middle East & Africa Market Value (USD Million) by Supplements, 2025-2035
  • Figure 212: Middle East & Africa Market Value (USD Million) by Formulation Type, 2025-2035
  • Figure 213: Middle East & Africa Market Value (USD Million) by Application, 2025-2035
  • Figure 214: Middle East & Africa Market Value (USD Million) by Sales Channel, 2025-2035
  • Figure 215: Middle East & Africa Market Value (USD Million) by Country, 2025-2035
  • Figure 216: Middle East & Africa Market Value (USD Million) Analysis by Country, 2020-2035
  • Figure 217: Middle East & Africa Market Volume (Units) Analysis by Country, 2020-2035
  • Figure 218: Middle East & Africa Market Value Share (%) and BPS Analysis by Country, 2025-2035
  • Figure 219: Middle East & Africa Market Y-o-Y Growth (%) Projections by Country, 2025-2035
  • Figure 220: Middle East & Africa Market Value (USD Million) Analysis by Supplements, 2020-2035
  • Figure 221: Middle East & Africa Market Volume (Units) Analysis by Supplements, 2020-2035
  • Figure 222: Middle East & Africa Market Value Share (%) and BPS Analysis by Supplements, 2025-2035
  • Figure 223: Middle East & Africa Market Y-o-Y Growth (%) Projections by Supplements, 2025-2035
  • Figure 224: Middle East & Africa Market Value (USD Million) Analysis by Formulation Type, 2020-2035
  • Figure 225: Middle East & Africa Market Volume (Units) Analysis by Formulation Type, 2020-2035
  • Figure 226: Middle East & Africa Market Value Share (%) and BPS Analysis by Formulation Type, 2025-2035
  • Figure 227: Middle East & Africa Market Y-o-Y Growth (%) Projections by Formulation Type, 2025-2035
  • Figure 228: Middle East & Africa Market Value (USD Million) Analysis by Application, 2020-2035
  • Figure 229: Middle East & Africa Market Volume (Units) Analysis by Application, 2020-2035
  • Figure 230: Middle East & Africa Market Value Share (%) and BPS Analysis by Application, 2025-2035
  • Figure 231: Middle East & Africa Market Y-o-Y Growth (%) Projections by Application, 2025-2035
  • Figure 232: Middle East & Africa Market Value (USD Million) Analysis by Sales Channel, 2020-2035
  • Figure 233: Middle East & Africa Market Volume (Units) Analysis by Sales Channel, 2020-2035
  • Figure 234: Middle East & Africa Market Value Share (%) and BPS Analysis by Sales Channel, 2025-2035
  • Figure 235: Middle East & Africa Market Y-o-Y Growth (%) Projections by Sales Channel, 2025-2035
  • Figure 236: Middle East & Africa Market Attractiveness by Supplements, 2025-2035
  • Figure 237: Middle East & Africa Market Attractiveness by Formulation Type, 2025-2035
  • Figure 238: Middle East & Africa Market Attractiveness by Application, 2025-2035
  • Figure 239: Middle East & Africa Market Attractiveness by Sales Channel, 2025-2035
  • Figure 240: Middle East & Africa Market Attractiveness by Country, 2025-2035

Frequently Asked Questions

How big is the Organ Support Supplements market in 2025?

The global Organ Support Supplements market is estimated to be valued at USD 75,142.7 million in 2025.

What will be the size of the Organ Support Supplements market in 2035?

The market size for Organ Support Supplements is projected to reach USD 127,138.7 million by 2035.

How much will the Organ Support Supplements market grow between 2025 and 2035?

The Organ Support Supplements market is expected to grow at a CAGR of 5.4% during this period.

What are the key supplement types in the Organ Support Supplements market?

Key supplement types Liver Support Supplements, Kidney Health Supplements, Heart Health Supplements, Lung Support Supplements, Brain & Cognitive Support Supplements, Gut Health Supplements, and Others.

Which application segment will contribute a significant share in the Organ Support Supplements market in 2025?

The General Wellness segment is projected to command 30.0% of the market in 2025.

Explore Similar Insights

Future Market Insights

Organ Support Supplements Market