Bagasse Tableware Product Market Size and Share Forecast Outlook in Japan From 2023 to 2033

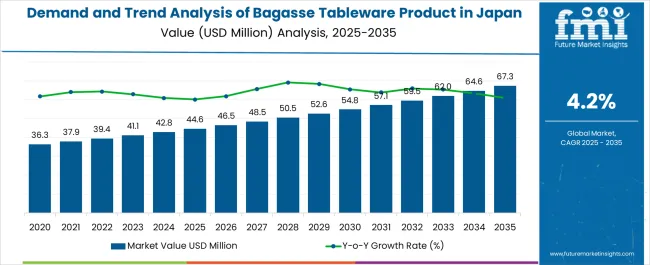
The bagasse tableware product ecosystem in Japan is poised for substantial growth through 2033, with the rapid adoption of this solution in both the Kanto and Chubu regions. However, the anticipated growth rate for Japan as a whole is a CAGR of 4.20% through 2033.

The demand for bagasse tableware products has evolved into a mainstream industry in Japan, and this trajectory is set to drive the sector to an estimated valuation of USD 41.1 million in 2023.

With a promising outlook and consumers' growing reliance on online shopping platforms, the projected demand for bagasse tableware products in Japan is expected to reach USD 62 million by 2033.

Attributes Details
Industry Size in Japan (2023) USD 41.1 million
Forecasted Industry Size in Japan (2033) USD 62 million
CAGR Estimation (2023 to 2033) 4.20%

Top Insights Driving Emerging Growth Opportunities in Japan’s Bagasse Tableware Product Industry

  • Bagasse tableware products, made from sugarcane residue, are emerging as eco-friendly alternatives to plastic tableware, driven by the global demand for reducing plastic usage and promoting sustainability.
  • The industry offers a wide range of bagasse tableware products, including trays, plates, straws, cutlery, and more. The high adoption of these versatile and biodegradable products is expected to drive industry growth.
  • Bagasse tableware products are known for their sturdiness and versatility, capable of handling various types of foods and beverages. They are biodegradable, grease-resistant, freezer-safe, and heat-resistant, making them a sustainable choice.
  • The robust growth of quick-service restaurants, catering to the demand for ready-to-eat and on-the-go meals, creates lucrative opportunities for bagasse tableware manufacturers.
  • The increasing trend of online food ordering worldwide is expected to boost the sales of bagasse tableware products further as consumers seek convenient and eco-friendly packaging solutions.
  • Leading food service providers are adopting eco-friendly and compostable packaging solutions like bagasse to attract customers and comply with stringent government regulations on sustainable practices.

Top Market Dynamics and Trends Influencing Demand for Bagasse Tableware Products in Japan

  • The increasing demand for environmentally friendly products in Japan is a significant trend. Consumers are increasingly conscious of the environmental impact of their choices, driving the adoption of bagasse tableware products as a sustainable alternative.
  • The expansion of the food sector is a key driver for bagasse tableware products. The need for sustainable and biodegradable tableware increases as the food industry grows.
  • Regulations promoting sustainable practices in the food and packaging industries encourage the adoption of bagasse tableware products. Compliance with these regulations is a driving force behind the industry growth.
  • With a growing focus on environmental sustainability, the industry for bagasse tableware products is expected to continue its upward trajectory. Brands and consumers alike are prioritizing eco-friendly choices.

Analysis of Leading Cities Producing and Distributing Bagasse Tableware Products in Japan

Cultural Fusion in Kanto Sparks Demand for Sustainable Tableware Solutions

A growing awareness of environmental issues and a strong push for sustainability in the Kanto region have propelled the demand for bagasse tableware products. This surge is particularly evident in numerous restaurants, especially in Tokyo, where there is a keen interest in adopting eco-friendly alternatives to traditional tableware.

The cultural diversity in Kanto, with its blend of traditional Japanese and international cuisines, presents a wide range of opportunities for bagasse tableware products to cater to diverse dining needs.

CSR Emphasis Boosts Bagasse Tableware Industry in Chubu

The Chubu region, with its industrial and manufacturing centers, provides a significant industry for bagasse tableware products. The automotive and manufacturing sectors in Chubu are progressively embracing sustainable practices, including the use of eco-friendly tableware in employee cafeterias and corporate events.

The emphasis on corporate social responsibility (CSR) in Chubu further fuels the demand for bagasse products, aligning with sustainability initiatives.

Bagasse Tableware Product Industry Analysis by Top Investment Segments in Japan

The table below highlights that the plates and commercial segments are leading the product type and end use segments respectively in 2023.

Category Industrial Share in 2023
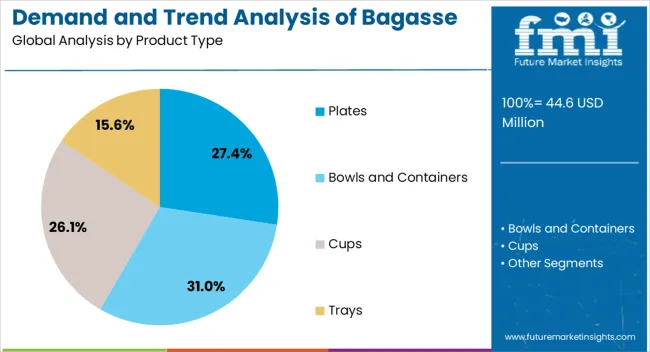
Plates by Product Type 35.1%
Commercial by End Use 66.0%

Bagasse Plates are the Eco-friendly Solution for Versatile Dining Needs

The bagasse tableware product industry is experiencing robust demand for bagasse plates, with this segment projected to hold a substantial share of around 35.1% in 2023. Bagasse plates are favored for their versatility and eco-friendly nature, making them the preferred choice for a wide range of dining needs

. They can serve main courses, appetizers, desserts, and more, offering both convenience and functionality.

The popularity of bagasse plates is on the rise as consumers and businesses alike are increasingly turning to eco-friendly solutions, including those made from sugarcane bagasse. Bagasse plates are both renewable and biodegradable, naturally breaking down over time, thus minimizing their ecological footprint.

Bagasse Tableware Stands Strong in High-traffic Commercial Settings

Commercial end uses play a significant role in driving the bagasse tableware product industry, accounting for an industry share of 66.0%. Various businesses and institutions across sectors are increasingly adopting bagasse tableware products due to their eco-friendly nature and versatility. Restaurants and cafes, in particular, have been significant contributors to the growth of this industry.

Food service establishments prefer using bagasse plates, trays, and cutlery for serving customers a wide range of dishes. Hotels and catering services also embrace bagasse tableware, as these products offer an elegant and sustainable option for serving guests during events and functions.

The robust and durable nature of bagasse products ensures they can withstand the demands of high-traffic commercial settings while maintaining food quality.
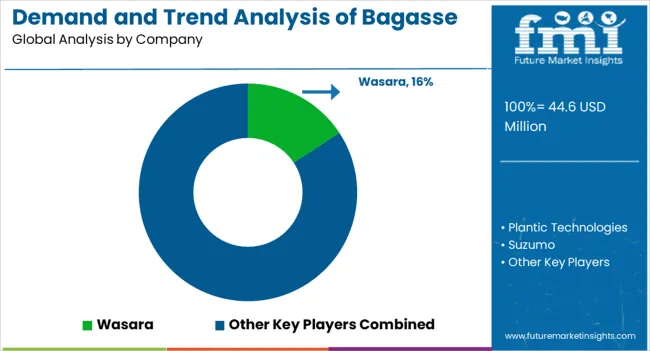
Recent Strategic Developments in Japan’s Bagasse Tableware Product Market

  • Wasara is known for its elegant and sustainable tableware products made from bamboo and bagasse. Its primary strategy involves biodegradable and compostable tableware, which has gained recognition for its exquisite design and environmental friendliness.
  • Plantic Technologies offers various sustainable packaging solutions, including products based on bagasse. They focus on creating environmentally friendly alternatives to traditional plastic packaging.

Leading Suppliers of Bagasse Tableware Products in Japan

  • Wasara
  • Plantic Technologies
  • Suzumo
  • Green Home
  • EcoProducts
  • Kawasho Corporation

Key Shifting Preferences Covered in Japan Bagasse Tableware Product Market Report

Attribute Details
Estimated Industry Size in 2023 USD 41.1 million
Projected Industry Size by 2033 USD 62 million
Anticipated CAGR between 2023 to 2033 4.20% CAGR
Demand Forecast for the Bagasse Tableware Product Industry in Japan 2023 to 2033
Report Coverage Industry Size, Industry Trends, Analysis of key factors influencing the Bagasse Tableware Product Industry in Japan, Insights on Global Players and their Industry Strategy in Japan, Ecosystem Analysis of Local and Regional Japan Providers
Key Cities Analyzed Kanto, Chubu, Kinki (Kansai), Kyushu and Okinawa, Tohoku, Rest of Japan
Key Companies Profiled Wasara; Plantic Technologies; Suzumo; Green Home; EcoProducts; Kawasho Corporation

Top Segments Studied in the Japan Bagasse Tableware Product Market Research Report

By Product Type:

  • Plates
    • Less than 8 inches
    • 8 inches to 12 inches
    • More than 12 inches
  • Bowls and Containers
    • Less than 12 Oz
    • 12 Oz to 16 Oz
    • More than 16 Oz
  • Cups
    • Less than 6 Oz
    • 6 Oz to 12 Oz
    • More than 12 Oz
  • Trays
    • Less than 8 inches
    • 8 inches to 12 inches
    • More than 12 inches
  • Clamshells
    • Less than 8 inches
    • 8 inches to 12 inches
    • More than 12 inches
  • End Caps
  • Drink Carriers
  • Straw
  • Cutlery (Spoons, Fork, Knife & Spork)

By Lamination:

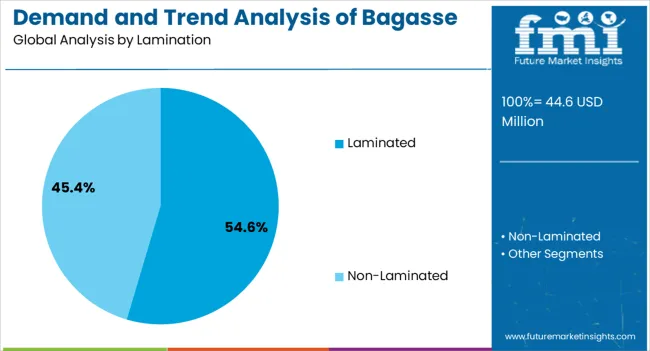
  • Laminated
  • Non-Laminated

By Sales Channel:

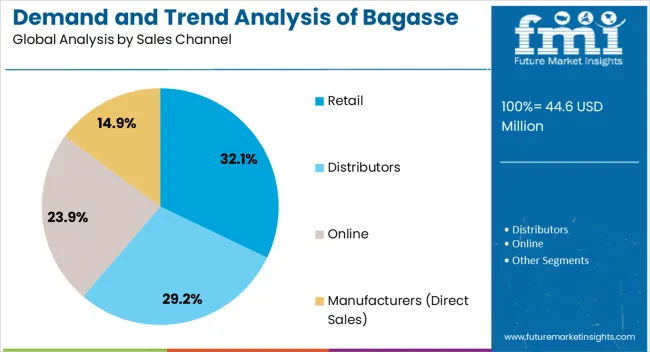
  • Manufacturers (Direct Sales)
  • Retail
    • Hypermarket
    • Supermarket
    • Convenience Store
    • Specialty Stores
  • Distributors
  • Online

By Application:

  • Food
    • Fruits & Vegetables
    • Processed Food
    • Ready-to-eat meals
    • Bakery & Confectionery
    • Cereals
    • Dairy
    • Other Food Products
  • Beverages

By End Use:

  • Commercial Use
    • Hotels & Cafes
    • Full-Service Restaurants
    • Quick Service Restaurants
    • Venues & Catering
    • Mobile Food Vendors
    • Bakery & Patisserie
  • Institutional Use
    • Schools & Colleges
    • Offices
    • Hospitals
    • Airports & Railways
  • Household Use

By City/Province:

  • Kanto
  • Chubu
  • Kinki
  • Kyushu and Okinawa
  • Tohoku
  • Rest of Japan

Table of Content

  • 1. Executive Summary
  • 2. Market Overview
  • 3. Market Background
  • 4. Industry Analysis and Outlook 2018 to 2022 and Forecast, 2023 to 2033
  • 5. Industry Analysis and Outlook 2018 to 2022 and Forecast 2023 to 2033, By Product Type
    • 5.1. Plates
    • 5.2. Bowls & Containers
    • 5.3. Cups
    • 5.4. Trays
    • 5.5. Clamshell
    • 5.6. End Caps
    • 5.7. Drink Carriers
    • 5.8. Straw
    • 5.9. Cutlery
  • 6. Industry Analysis and Outlook 2018 to 2022 and Forecast 2023 to 2033, By Lamination
    • 6.1. Laminated
    • 6.2. Non-Laminated
  • 7. Industry Analysis and Outlook 2018 to 2022 and Forecast 2023 to 2033, By Sales Channel
    • 7.1. Manufacturers
    • 7.2. Retail
    • 7.3. Distributors
    • 7.4. Online
  • 8. Industry Analysis and Outlook 2018 to 2022 and Forecast 2023 to 2033, By Application
    • 8.1. Food
    • 8.2. Beverages
  • 9. Industry Analysis and Outlook 2018 to 2022 and Forecast 2023 to 2033, By End Use
    • 9.1. Commercial
    • 9.2. Institutional
    • 9.3. Household Use
  • 10. Industry Analysis and Outlook 2018 to 2022 and Forecast 2023 to 2033, By Region
    • 10.1. Kanto
    • 10.2. Chubu
    • 10.3. Kinki
    • 10.4. Kyushu & Okinawa
    • 10.5. Tohoku
    • 10.6. Rest of Japan
  • 11. Kanto Industry Analysis and Outlook 2018 to 2022 and Forecast 2023 to 2033
  • 12. Chubu Industry Analysis and Outlook 2018 to 2022 and Forecast 2023 to 2033
  • 13. Kinki Industry Analysis and Outlook 2018 to 2022 and Forecast 2023 to 2033
  • 14. Kyushu & Okinawa Industry Analysis and Outlook 2018 to 2022 and Forecast 2023 to 2033
  • 15. Tohoku Industry Analysis and Outlook 2018 to 2022 and Forecast 2023 to 2033
  • 16. Rest of Industry Analysis and Outlook 2018 to 2022 and Forecast 2023 to 2033
  • 17. Market Structure Analysis
  • 18. Competition Analysis
    • 18.1. Sumkoka
    • 18.2. WASARA
    • 18.3. Greenvale Eco Products
    • 18.4. Shenzhen Zhiben Technology Group Co., Ltd.
    • 18.5. GREENWEIMO
    • 18.6. DevEuro Paper Products LLP
    • 18.7. Shanghai Youngpac Biotech Ltd.
    • 18.8. Jinhua Zhongsheng Fiber Products Co., Ltd.
    • 18.9. Sorcit
    • 18.10. Detpak (Detmold Group)
  • 19. Assumptions & Acronyms Used
  • 20. Research Methodology

List of Tables

Table 1: Industry Analysis and Outlook Value (US$ Million) Forecast by Region, 2018 to 2033

Table 2: Industry Analysis and Outlook Volume (Units) Forecast by Region, 2018 to 2033

Table 3: Industry Analysis and Outlook Value (US$ Million) Forecast by Product Type, 2018 to 2033

Table 4: Industry Analysis and Outlook Volume (Units) Forecast by Product Type, 2018 to 2033

Table 5: Industry Analysis and Outlook Value (US$ Million) Forecast by Lamination, 2018 to 2033

Table 6: Industry Analysis and Outlook Volume (Units) Forecast by Lamination, 2018 to 2033

Table 7: Industry Analysis and Outlook Value (US$ Million) Forecast by Sales Channel, 2018 to 2033

Table 8: Industry Analysis and Outlook Volume (Units) Forecast by Sales Channel, 2018 to 2033

Table 9: Industry Analysis and Outlook Value (US$ Million) Forecast by Application, 2018 to 2033

Table 10: Industry Analysis and Outlook Volume (Units) Forecast by Application, 2018 to 2033

Table 11: Industry Analysis and Outlook Value (US$ Million) Forecast by End Use, 2018 to 2033

Table 12: Industry Analysis and Outlook Volume (Units) Forecast by End Use, 2018 to 2033

Table 13: Kanto Industry Analysis and Outlook Value (US$ Million) Forecast by Product Type, 2018 to 2033

Table 14: Kanto Industry Analysis and Outlook Volume (Units) Forecast by Product Type, 2018 to 2033

Table 15: Kanto Industry Analysis and Outlook Value (US$ Million) Forecast by Lamination, 2018 to 2033

Table 16: Kanto Industry Analysis and Outlook Volume (Units) Forecast by Lamination, 2018 to 2033

Table 17: Kanto Industry Analysis and Outlook Value (US$ Million) Forecast by Sales Channel, 2018 to 2033

Table 18: Kanto Industry Analysis and Outlook Volume (Units) Forecast by Sales Channel, 2018 to 2033

Table 19: Kanto Industry Analysis and Outlook Value (US$ Million) Forecast by Application, 2018 to 2033

Table 20: Kanto Industry Analysis and Outlook Volume (Units) Forecast by Application, 2018 to 2033

Table 21: Kanto Industry Analysis and Outlook Value (US$ Million) Forecast by End Use, 2018 to 2033

Table 22: Kanto Industry Analysis and Outlook Volume (Units) Forecast by End Use, 2018 to 2033

Table 23: Chubu Industry Analysis and Outlook Value (US$ Million) Forecast by Product Type, 2018 to 2033

Table 24: Chubu Industry Analysis and Outlook Volume (Units) Forecast by Product Type, 2018 to 2033

Table 25: Chubu Industry Analysis and Outlook Value (US$ Million) Forecast by Lamination, 2018 to 2033

Table 26: Chubu Industry Analysis and Outlook Volume (Units) Forecast by Lamination, 2018 to 2033

Table 27: Chubu Industry Analysis and Outlook Value (US$ Million) Forecast by Sales Channel, 2018 to 2033

Table 28: Chubu Industry Analysis and Outlook Volume (Units) Forecast by Sales Channel, 2018 to 2033

Table 29: Chubu Industry Analysis and Outlook Value (US$ Million) Forecast by Application, 2018 to 2033

Table 30: Chubu Industry Analysis and Outlook Volume (Units) Forecast by Application, 2018 to 2033

Table 31: Chubu Industry Analysis and Outlook Value (US$ Million) Forecast by End Use, 2018 to 2033

Table 32: Chubu Industry Analysis and Outlook Volume (Units) Forecast by End Use, 2018 to 2033

Table 33: Kinki Industry Analysis and Outlook Value (US$ Million) Forecast by Product Type, 2018 to 2033

Table 34: Kinki Industry Analysis and Outlook Volume (Units) Forecast by Product Type, 2018 to 2033

Table 35: Kinki Industry Analysis and Outlook Value (US$ Million) Forecast by Lamination, 2018 to 2033

Table 36: Kinki Industry Analysis and Outlook Volume (Units) Forecast by Lamination, 2018 to 2033

Table 37: Kinki Industry Analysis and Outlook Value (US$ Million) Forecast by Sales Channel, 2018 to 2033

Table 38: Kinki Industry Analysis and Outlook Volume (Units) Forecast by Sales Channel, 2018 to 2033

Table 39: Kinki Industry Analysis and Outlook Value (US$ Million) Forecast by Application, 2018 to 2033

Table 40: Kinki Industry Analysis and Outlook Volume (Units) Forecast by Application, 2018 to 2033

Table 41: Kinki Industry Analysis and Outlook Value (US$ Million) Forecast by End Use, 2018 to 2033

Table 42: Kinki Industry Analysis and Outlook Volume (Units) Forecast by End Use, 2018 to 2033

Table 43: Kyushu & Okinawa Industry Analysis and Outlook Value (US$ Million) Forecast by Product Type, 2018 to 2033

Table 44: Kyushu & Okinawa Industry Analysis and Outlook Volume (Units) Forecast by Product Type, 2018 to 2033

Table 45: Kyushu & Okinawa Industry Analysis and Outlook Value (US$ Million) Forecast by Lamination, 2018 to 2033

Table 46: Kyushu & Okinawa Industry Analysis and Outlook Volume (Units) Forecast by Lamination, 2018 to 2033

Table 47: Kyushu & Okinawa Industry Analysis and Outlook Value (US$ Million) Forecast by Sales Channel, 2018 to 2033

Table 48: Kyushu & Okinawa Industry Analysis and Outlook Volume (Units) Forecast by Sales Channel, 2018 to 2033

Table 49: Kyushu & Okinawa Industry Analysis and Outlook Value (US$ Million) Forecast by Application, 2018 to 2033

Table 50: Kyushu & Okinawa Industry Analysis and Outlook Volume (Units) Forecast by Application, 2018 to 2033

Table 51: Kyushu & Okinawa Industry Analysis and Outlook Value (US$ Million) Forecast by End Use, 2018 to 2033

Table 52: Kyushu & Okinawa Industry Analysis and Outlook Volume (Units) Forecast by End Use, 2018 to 2033

Table 53: Tohoku Industry Analysis and Outlook Value (US$ Million) Forecast by Product Type, 2018 to 2033

Table 54: Tohoku Industry Analysis and Outlook Volume (Units) Forecast by Product Type, 2018 to 2033

Table 55: Tohoku Industry Analysis and Outlook Value (US$ Million) Forecast by Lamination, 2018 to 2033

Table 56: Tohoku Industry Analysis and Outlook Volume (Units) Forecast by Lamination, 2018 to 2033

Table 57: Tohoku Industry Analysis and Outlook Value (US$ Million) Forecast by Sales Channel, 2018 to 2033

Table 58: Tohoku Industry Analysis and Outlook Volume (Units) Forecast by Sales Channel, 2018 to 2033

Table 59: Tohoku Industry Analysis and Outlook Value (US$ Million) Forecast by Application, 2018 to 2033

Table 60: Tohoku Industry Analysis and Outlook Volume (Units) Forecast by Application, 2018 to 2033

Table 61: Tohoku Industry Analysis and Outlook Value (US$ Million) Forecast by End Use, 2018 to 2033

Table 62: Tohoku Industry Analysis and Outlook Volume (Units) Forecast by End Use, 2018 to 2033

Table 63: Rest of Industry Analysis and Outlook Value (US$ Million) Forecast by Product Type, 2018 to 2033

Table 64: Rest of Industry Analysis and Outlook Volume (Units) Forecast by Product Type, 2018 to 2033

Table 65: Rest of Industry Analysis and Outlook Value (US$ Million) Forecast by Lamination, 2018 to 2033

Table 66: Rest of Industry Analysis and Outlook Volume (Units) Forecast by Lamination, 2018 to 2033

Table 67: Rest of Industry Analysis and Outlook Value (US$ Million) Forecast by Sales Channel, 2018 to 2033

Table 68: Rest of Industry Analysis and Outlook Volume (Units) Forecast by Sales Channel, 2018 to 2033

Table 69: Rest of Industry Analysis and Outlook Value (US$ Million) Forecast by Application, 2018 to 2033

Table 70: Rest of Industry Analysis and Outlook Volume (Units) Forecast by Application, 2018 to 2033

Table 71: Rest of Industry Analysis and Outlook Value (US$ Million) Forecast by End Use, 2018 to 2033

Table 72: Rest of Industry Analysis and Outlook Volume (Units) Forecast by End Use, 2018 to 2033

List of Figures

Figure 1: Industry Analysis and Outlook Value (US$ Million) by Product Type, 2023 to 2033

Figure 2: Industry Analysis and Outlook Value (US$ Million) by Lamination, 2023 to 2033

Figure 3: Industry Analysis and Outlook Value (US$ Million) by Sales Channel, 2023 to 2033

Figure 4: Industry Analysis and Outlook Value (US$ Million) by Application, 2023 to 2033

Figure 5: Industry Analysis and Outlook Value (US$ Million) by End Use, 2023 to 2033

Figure 6: Industry Analysis and Outlook Value (US$ Million) by Region, 2023 to 2033

Figure 7: Industry Analysis and Outlook Value (US$ Million) Analysis by Region, 2018 to 2033

Figure 8: Industry Analysis and Outlook Volume (Units) Analysis by Region, 2018 to 2033

Figure 9: Industry Analysis and Outlook Value Share (%) and BPS Analysis by Region, 2023 to 2033

Figure 10: Industry Analysis and Outlook Y-o-Y Growth (%) Projections by Region, 2023 to 2033

Figure 11: Industry Analysis and Outlook Value (US$ Million) Analysis by Product Type, 2018 to 2033

Figure 12: Industry Analysis and Outlook Volume (Units) Analysis by Product Type, 2018 to 2033

Figure 13: Industry Analysis and Outlook Value Share (%) and BPS Analysis by Product Type, 2023 to 2033

Figure 14: Industry Analysis and Outlook Y-o-Y Growth (%) Projections by Product Type, 2023 to 2033

Figure 15: Industry Analysis and Outlook Value (US$ Million) Analysis by Lamination, 2018 to 2033

Figure 16: Industry Analysis and Outlook Volume (Units) Analysis by Lamination, 2018 to 2033

Figure 17: Industry Analysis and Outlook Value Share (%) and BPS Analysis by Lamination, 2023 to 2033

Figure 18: Industry Analysis and Outlook Y-o-Y Growth (%) Projections by Lamination, 2023 to 2033

Figure 19: Industry Analysis and Outlook Value (US$ Million) Analysis by Sales Channel, 2018 to 2033

Figure 20: Industry Analysis and Outlook Volume (Units) Analysis by Sales Channel, 2018 to 2033

Figure 21: Industry Analysis and Outlook Value Share (%) and BPS Analysis by Sales Channel, 2023 to 2033

Figure 22: Industry Analysis and Outlook Y-o-Y Growth (%) Projections by Sales Channel, 2023 to 2033

Figure 23: Industry Analysis and Outlook Value (US$ Million) Analysis by Application, 2018 to 2033

Figure 24: Industry Analysis and Outlook Volume (Units) Analysis by Application, 2018 to 2033

Figure 25: Industry Analysis and Outlook Value Share (%) and BPS Analysis by Application, 2023 to 2033

Figure 26: Industry Analysis and Outlook Y-o-Y Growth (%) Projections by Application, 2023 to 2033

Figure 27: Industry Analysis and Outlook Value (US$ Million) Analysis by End Use, 2018 to 2033

Figure 28: Industry Analysis and Outlook Volume (Units) Analysis by End Use, 2018 to 2033

Figure 29: Industry Analysis and Outlook Value Share (%) and BPS Analysis by End Use, 2023 to 2033

Figure 30: Industry Analysis and Outlook Y-o-Y Growth (%) Projections by End Use, 2023 to 2033

Figure 31: Industry Analysis and Outlook Attractiveness by Product Type, 2023 to 2033

Figure 32: Industry Analysis and Outlook Attractiveness by Lamination, 2023 to 2033

Figure 33: Industry Analysis and Outlook Attractiveness by Sales Channel, 2023 to 2033

Figure 34: Industry Analysis and Outlook Attractiveness by Application, 2023 to 2033

Figure 35: Industry Analysis and Outlook Attractiveness by End Use, 2023 to 2033

Figure 36: Industry Analysis and Outlook Attractiveness by Region, 2023 to 2033

Figure 37: Kanto Industry Analysis and Outlook Value (US$ Million) by Product Type, 2023 to 2033

Figure 38: Kanto Industry Analysis and Outlook Value (US$ Million) by Lamination, 2023 to 2033

Figure 39: Kanto Industry Analysis and Outlook Value (US$ Million) by Sales Channel, 2023 to 2033

Figure 40: Kanto Industry Analysis and Outlook Value (US$ Million) by Application, 2023 to 2033

Figure 41: Kanto Industry Analysis and Outlook Value (US$ Million) by End Use, 2023 to 2033

Figure 42: Kanto Industry Analysis and Outlook Value (US$ Million) Analysis by Product Type, 2018 to 2033

Figure 43: Kanto Industry Analysis and Outlook Volume (Units) Analysis by Product Type, 2018 to 2033

Figure 44: Kanto Industry Analysis and Outlook Value Share (%) and BPS Analysis by Product Type, 2023 to 2033

Figure 45: Kanto Industry Analysis and Outlook Y-o-Y Growth (%) Projections by Product Type, 2023 to 2033

Figure 46: Kanto Industry Analysis and Outlook Value (US$ Million) Analysis by Lamination, 2018 to 2033

Figure 47: Kanto Industry Analysis and Outlook Volume (Units) Analysis by Lamination, 2018 to 2033

Figure 48: Kanto Industry Analysis and Outlook Value Share (%) and BPS Analysis by Lamination, 2023 to 2033

Figure 49: Kanto Industry Analysis and Outlook Y-o-Y Growth (%) Projections by Lamination, 2023 to 2033

Figure 50: Kanto Industry Analysis and Outlook Value (US$ Million) Analysis by Sales Channel, 2018 to 2033

Figure 51: Kanto Industry Analysis and Outlook Volume (Units) Analysis by Sales Channel, 2018 to 2033

Figure 52: Kanto Industry Analysis and Outlook Value Share (%) and BPS Analysis by Sales Channel, 2023 to 2033

Figure 53: Kanto Industry Analysis and Outlook Y-o-Y Growth (%) Projections by Sales Channel, 2023 to 2033

Figure 54: Kanto Industry Analysis and Outlook Value (US$ Million) Analysis by Application, 2018 to 2033

Figure 55: Kanto Industry Analysis and Outlook Volume (Units) Analysis by Application, 2018 to 2033

Figure 56: Kanto Industry Analysis and Outlook Value Share (%) and BPS Analysis by Application, 2023 to 2033

Figure 57: Kanto Industry Analysis and Outlook Y-o-Y Growth (%) Projections by Application, 2023 to 2033

Figure 58: Kanto Industry Analysis and Outlook Value (US$ Million) Analysis by End Use, 2018 to 2033

Figure 59: Kanto Industry Analysis and Outlook Volume (Units) Analysis by End Use, 2018 to 2033

Figure 60: Kanto Industry Analysis and Outlook Value Share (%) and BPS Analysis by End Use, 2023 to 2033

Figure 61: Kanto Industry Analysis and Outlook Y-o-Y Growth (%) Projections by End Use, 2023 to 2033

Figure 62: Kanto Industry Analysis and Outlook Attractiveness by Product Type, 2023 to 2033

Figure 63: Kanto Industry Analysis and Outlook Attractiveness by Lamination, 2023 to 2033

Figure 64: Kanto Industry Analysis and Outlook Attractiveness by Sales Channel, 2023 to 2033

Figure 65: Kanto Industry Analysis and Outlook Attractiveness by Application, 2023 to 2033

Figure 66: Kanto Industry Analysis and Outlook Attractiveness by End Use, 2023 to 2033

Figure 67: Chubu Industry Analysis and Outlook Value (US$ Million) by Product Type, 2023 to 2033

Figure 68: Chubu Industry Analysis and Outlook Value (US$ Million) by Lamination, 2023 to 2033

Figure 69: Chubu Industry Analysis and Outlook Value (US$ Million) by Sales Channel, 2023 to 2033

Figure 70: Chubu Industry Analysis and Outlook Value (US$ Million) by Application, 2023 to 2033

Figure 71: Chubu Industry Analysis and Outlook Value (US$ Million) by End Use, 2023 to 2033

Figure 72: Chubu Industry Analysis and Outlook Value (US$ Million) Analysis by Product Type, 2018 to 2033

Figure 73: Chubu Industry Analysis and Outlook Volume (Units) Analysis by Product Type, 2018 to 2033

Figure 74: Chubu Industry Analysis and Outlook Value Share (%) and BPS Analysis by Product Type, 2023 to 2033

Figure 75: Chubu Industry Analysis and Outlook Y-o-Y Growth (%) Projections by Product Type, 2023 to 2033

Figure 76: Chubu Industry Analysis and Outlook Value (US$ Million) Analysis by Lamination, 2018 to 2033

Figure 77: Chubu Industry Analysis and Outlook Volume (Units) Analysis by Lamination, 2018 to 2033

Figure 78: Chubu Industry Analysis and Outlook Value Share (%) and BPS Analysis by Lamination, 2023 to 2033

Figure 79: Chubu Industry Analysis and Outlook Y-o-Y Growth (%) Projections by Lamination, 2023 to 2033

Figure 80: Chubu Industry Analysis and Outlook Value (US$ Million) Analysis by Sales Channel, 2018 to 2033

Figure 81: Chubu Industry Analysis and Outlook Volume (Units) Analysis by Sales Channel, 2018 to 2033

Figure 82: Chubu Industry Analysis and Outlook Value Share (%) and BPS Analysis by Sales Channel, 2023 to 2033

Figure 83: Chubu Industry Analysis and Outlook Y-o-Y Growth (%) Projections by Sales Channel, 2023 to 2033

Figure 84: Chubu Industry Analysis and Outlook Value (US$ Million) Analysis by Application, 2018 to 2033

Figure 85: Chubu Industry Analysis and Outlook Volume (Units) Analysis by Application, 2018 to 2033

Figure 86: Chubu Industry Analysis and Outlook Value Share (%) and BPS Analysis by Application, 2023 to 2033

Figure 87: Chubu Industry Analysis and Outlook Y-o-Y Growth (%) Projections by Application, 2023 to 2033

Figure 88: Chubu Industry Analysis and Outlook Value (US$ Million) Analysis by End Use, 2018 to 2033

Figure 89: Chubu Industry Analysis and Outlook Volume (Units) Analysis by End Use, 2018 to 2033

Figure 90: Chubu Industry Analysis and Outlook Value Share (%) and BPS Analysis by End Use, 2023 to 2033

Figure 91: Chubu Industry Analysis and Outlook Y-o-Y Growth (%) Projections by End Use, 2023 to 2033

Figure 92: Chubu Industry Analysis and Outlook Attractiveness by Product Type, 2023 to 2033

Figure 93: Chubu Industry Analysis and Outlook Attractiveness by Lamination, 2023 to 2033

Figure 94: Chubu Industry Analysis and Outlook Attractiveness by Sales Channel, 2023 to 2033

Figure 95: Chubu Industry Analysis and Outlook Attractiveness by Application, 2023 to 2033

Figure 96: Chubu Industry Analysis and Outlook Attractiveness by End Use, 2023 to 2033

Figure 97: Kinki Industry Analysis and Outlook Value (US$ Million) by Product Type, 2023 to 2033

Figure 98: Kinki Industry Analysis and Outlook Value (US$ Million) by Lamination, 2023 to 2033

Figure 99: Kinki Industry Analysis and Outlook Value (US$ Million) by Sales Channel, 2023 to 2033

Figure 100: Kinki Industry Analysis and Outlook Value (US$ Million) by Application, 2023 to 2033

Figure 101: Kinki Industry Analysis and Outlook Value (US$ Million) by End Use, 2023 to 2033

Figure 102: Kinki Industry Analysis and Outlook Value (US$ Million) Analysis by Product Type, 2018 to 2033

Figure 103: Kinki Industry Analysis and Outlook Volume (Units) Analysis by Product Type, 2018 to 2033

Figure 104: Kinki Industry Analysis and Outlook Value Share (%) and BPS Analysis by Product Type, 2023 to 2033

Figure 105: Kinki Industry Analysis and Outlook Y-o-Y Growth (%) Projections by Product Type, 2023 to 2033

Figure 106: Kinki Industry Analysis and Outlook Value (US$ Million) Analysis by Lamination, 2018 to 2033

Figure 107: Kinki Industry Analysis and Outlook Volume (Units) Analysis by Lamination, 2018 to 2033

Figure 108: Kinki Industry Analysis and Outlook Value Share (%) and BPS Analysis by Lamination, 2023 to 2033

Figure 109: Kinki Industry Analysis and Outlook Y-o-Y Growth (%) Projections by Lamination, 2023 to 2033

Figure 110: Kinki Industry Analysis and Outlook Value (US$ Million) Analysis by Sales Channel, 2018 to 2033

Figure 111: Kinki Industry Analysis and Outlook Volume (Units) Analysis by Sales Channel, 2018 to 2033

Figure 112: Kinki Industry Analysis and Outlook Value Share (%) and BPS Analysis by Sales Channel, 2023 to 2033

Figure 113: Kinki Industry Analysis and Outlook Y-o-Y Growth (%) Projections by Sales Channel, 2023 to 2033

Figure 114: Kinki Industry Analysis and Outlook Value (US$ Million) Analysis by Application, 2018 to 2033

Figure 115: Kinki Industry Analysis and Outlook Volume (Units) Analysis by Application, 2018 to 2033

Figure 116: Kinki Industry Analysis and Outlook Value Share (%) and BPS Analysis by Application, 2023 to 2033

Figure 117: Kinki Industry Analysis and Outlook Y-o-Y Growth (%) Projections by Application, 2023 to 2033

Figure 118: Kinki Industry Analysis and Outlook Value (US$ Million) Analysis by End Use, 2018 to 2033

Figure 119: Kinki Industry Analysis and Outlook Volume (Units) Analysis by End Use, 2018 to 2033

Figure 120: Kinki Industry Analysis and Outlook Value Share (%) and BPS Analysis by End Use, 2023 to 2033

Figure 121: Kinki Industry Analysis and Outlook Y-o-Y Growth (%) Projections by End Use, 2023 to 2033

Figure 122: Kinki Industry Analysis and Outlook Attractiveness by Product Type, 2023 to 2033

Figure 123: Kinki Industry Analysis and Outlook Attractiveness by Lamination, 2023 to 2033

Figure 124: Kinki Industry Analysis and Outlook Attractiveness by Sales Channel, 2023 to 2033

Figure 125: Kinki Industry Analysis and Outlook Attractiveness by Application, 2023 to 2033

Figure 126: Kinki Industry Analysis and Outlook Attractiveness by End Use, 2023 to 2033

Figure 127: Kyushu & Okinawa Industry Analysis and Outlook Value (US$ Million) by Product Type, 2023 to 2033

Figure 128: Kyushu & Okinawa Industry Analysis and Outlook Value (US$ Million) by Lamination, 2023 to 2033

Figure 129: Kyushu & Okinawa Industry Analysis and Outlook Value (US$ Million) by Sales Channel, 2023 to 2033

Figure 130: Kyushu & Okinawa Industry Analysis and Outlook Value (US$ Million) by Application, 2023 to 2033

Figure 131: Kyushu & Okinawa Industry Analysis and Outlook Value (US$ Million) by End Use, 2023 to 2033

Figure 132: Kyushu & Okinawa Industry Analysis and Outlook Value (US$ Million) Analysis by Product Type, 2018 to 2033

Figure 133: Kyushu & Okinawa Industry Analysis and Outlook Volume (Units) Analysis by Product Type, 2018 to 2033

Figure 134: Kyushu & Okinawa Industry Analysis and Outlook Value Share (%) and BPS Analysis by Product Type, 2023 to 2033

Figure 135: Kyushu & Okinawa Industry Analysis and Outlook Y-o-Y Growth (%) Projections by Product Type, 2023 to 2033

Figure 136: Kyushu & Okinawa Industry Analysis and Outlook Value (US$ Million) Analysis by Lamination, 2018 to 2033

Figure 137: Kyushu & Okinawa Industry Analysis and Outlook Volume (Units) Analysis by Lamination, 2018 to 2033

Figure 138: Kyushu & Okinawa Industry Analysis and Outlook Value Share (%) and BPS Analysis by Lamination, 2023 to 2033

Figure 139: Kyushu & Okinawa Industry Analysis and Outlook Y-o-Y Growth (%) Projections by Lamination, 2023 to 2033

Figure 140: Kyushu & Okinawa Industry Analysis and Outlook Value (US$ Million) Analysis by Sales Channel, 2018 to 2033

Figure 141: Kyushu & Okinawa Industry Analysis and Outlook Volume (Units) Analysis by Sales Channel, 2018 to 2033

Figure 142: Kyushu & Okinawa Industry Analysis and Outlook Value Share (%) and BPS Analysis by Sales Channel, 2023 to 2033

Figure 143: Kyushu & Okinawa Industry Analysis and Outlook Y-o-Y Growth (%) Projections by Sales Channel, 2023 to 2033

Figure 144: Kyushu & Okinawa Industry Analysis and Outlook Value (US$ Million) Analysis by Application, 2018 to 2033

Figure 145: Kyushu & Okinawa Industry Analysis and Outlook Volume (Units) Analysis by Application, 2018 to 2033

Figure 146: Kyushu & Okinawa Industry Analysis and Outlook Value Share (%) and BPS Analysis by Application, 2023 to 2033

Figure 147: Kyushu & Okinawa Industry Analysis and Outlook Y-o-Y Growth (%) Projections by Application, 2023 to 2033

Figure 148: Kyushu & Okinawa Industry Analysis and Outlook Value (US$ Million) Analysis by End Use, 2018 to 2033

Figure 149: Kyushu & Okinawa Industry Analysis and Outlook Volume (Units) Analysis by End Use, 2018 to 2033

Figure 150: Kyushu & Okinawa Industry Analysis and Outlook Value Share (%) and BPS Analysis by End Use, 2023 to 2033

Figure 151: Kyushu & Okinawa Industry Analysis and Outlook Y-o-Y Growth (%) Projections by End Use, 2023 to 2033

Figure 152: Kyushu & Okinawa Industry Analysis and Outlook Attractiveness by Product Type, 2023 to 2033

Figure 153: Kyushu & Okinawa Industry Analysis and Outlook Attractiveness by Lamination, 2023 to 2033

Figure 154: Kyushu & Okinawa Industry Analysis and Outlook Attractiveness by Sales Channel, 2023 to 2033

Figure 155: Kyushu & Okinawa Industry Analysis and Outlook Attractiveness by Application, 2023 to 2033

Figure 156: Kyushu & Okinawa Industry Analysis and Outlook Attractiveness by End Use, 2023 to 2033

Figure 157: Tohoku Industry Analysis and Outlook Value (US$ Million) by Product Type, 2023 to 2033

Figure 158: Tohoku Industry Analysis and Outlook Value (US$ Million) by Lamination, 2023 to 2033

Figure 159: Tohoku Industry Analysis and Outlook Value (US$ Million) by Sales Channel, 2023 to 2033

Figure 160: Tohoku Industry Analysis and Outlook Value (US$ Million) by Application, 2023 to 2033

Figure 161: Tohoku Industry Analysis and Outlook Value (US$ Million) by End Use, 2023 to 2033

Figure 162: Tohoku Industry Analysis and Outlook Value (US$ Million) Analysis by Product Type, 2018 to 2033

Figure 163: Tohoku Industry Analysis and Outlook Volume (Units) Analysis by Product Type, 2018 to 2033

Figure 164: Tohoku Industry Analysis and Outlook Value Share (%) and BPS Analysis by Product Type, 2023 to 2033

Figure 165: Tohoku Industry Analysis and Outlook Y-o-Y Growth (%) Projections by Product Type, 2023 to 2033

Figure 166: Tohoku Industry Analysis and Outlook Value (US$ Million) Analysis by Lamination, 2018 to 2033

Figure 167: Tohoku Industry Analysis and Outlook Volume (Units) Analysis by Lamination, 2018 to 2033

Figure 168: Tohoku Industry Analysis and Outlook Value Share (%) and BPS Analysis by Lamination, 2023 to 2033

Figure 169: Tohoku Industry Analysis and Outlook Y-o-Y Growth (%) Projections by Lamination, 2023 to 2033

Figure 170: Tohoku Industry Analysis and Outlook Value (US$ Million) Analysis by Sales Channel, 2018 to 2033

Figure 171: Tohoku Industry Analysis and Outlook Volume (Units) Analysis by Sales Channel, 2018 to 2033

Figure 172: Tohoku Industry Analysis and Outlook Value Share (%) and BPS Analysis by Sales Channel, 2023 to 2033

Figure 173: Tohoku Industry Analysis and Outlook Y-o-Y Growth (%) Projections by Sales Channel, 2023 to 2033

Figure 174: Tohoku Industry Analysis and Outlook Value (US$ Million) Analysis by Application, 2018 to 2033

Figure 175: Tohoku Industry Analysis and Outlook Volume (Units) Analysis by Application, 2018 to 2033

Figure 176: Tohoku Industry Analysis and Outlook Value Share (%) and BPS Analysis by Application, 2023 to 2033

Figure 177: Tohoku Industry Analysis and Outlook Y-o-Y Growth (%) Projections by Application, 2023 to 2033

Figure 178: Tohoku Industry Analysis and Outlook Value (US$ Million) Analysis by End Use, 2018 to 2033

Figure 179: Tohoku Industry Analysis and Outlook Volume (Units) Analysis by End Use, 2018 to 2033

Figure 180: Tohoku Industry Analysis and Outlook Value Share (%) and BPS Analysis by End Use, 2023 to 2033

Figure 181: Tohoku Industry Analysis and Outlook Y-o-Y Growth (%) Projections by End Use, 2023 to 2033

Figure 182: Tohoku Industry Analysis and Outlook Attractiveness by Product Type, 2023 to 2033

Figure 183: Tohoku Industry Analysis and Outlook Attractiveness by Lamination, 2023 to 2033

Figure 184: Tohoku Industry Analysis and Outlook Attractiveness by Sales Channel, 2023 to 2033

Figure 185: Tohoku Industry Analysis and Outlook Attractiveness by Application, 2023 to 2033

Figure 186: Tohoku Industry Analysis and Outlook Attractiveness by End Use, 2023 to 2033

Figure 187: Rest of Industry Analysis and Outlook Value (US$ Million) by Product Type, 2023 to 2033

Figure 188: Rest of Industry Analysis and Outlook Value (US$ Million) by Lamination, 2023 to 2033

Figure 189: Rest of Industry Analysis and Outlook Value (US$ Million) by Sales Channel, 2023 to 2033

Figure 190: Rest of Industry Analysis and Outlook Value (US$ Million) by Application, 2023 to 2033

Figure 191: Rest of Industry Analysis and Outlook Value (US$ Million) by End Use, 2023 to 2033

Figure 192: Rest of Industry Analysis and Outlook Value (US$ Million) Analysis by Product Type, 2018 to 2033

Figure 193: Rest of Industry Analysis and Outlook Volume (Units) Analysis by Product Type, 2018 to 2033

Figure 194: Rest of Industry Analysis and Outlook Value Share (%) and BPS Analysis by Product Type, 2023 to 2033

Figure 195: Rest of Industry Analysis and Outlook Y-o-Y Growth (%) Projections by Product Type, 2023 to 2033

Figure 196: Rest of Industry Analysis and Outlook Value (US$ Million) Analysis by Lamination, 2018 to 2033

Figure 197: Rest of Industry Analysis and Outlook Volume (Units) Analysis by Lamination, 2018 to 2033

Figure 198: Rest of Industry Analysis and Outlook Value Share (%) and BPS Analysis by Lamination, 2023 to 2033

Figure 199: Rest of Industry Analysis and Outlook Y-o-Y Growth (%) Projections by Lamination, 2023 to 2033

Figure 200: Rest of Industry Analysis and Outlook Value (US$ Million) Analysis by Sales Channel, 2018 to 2033

Figure 201: Rest of Industry Analysis and Outlook Volume (Units) Analysis by Sales Channel, 2018 to 2033

Figure 202: Rest of Industry Analysis and Outlook Value Share (%) and BPS Analysis by Sales Channel, 2023 to 2033

Figure 203: Rest of Industry Analysis and Outlook Y-o-Y Growth (%) Projections by Sales Channel, 2023 to 2033

Figure 204: Rest of Industry Analysis and Outlook Value (US$ Million) Analysis by Application, 2018 to 2033

Figure 205: Rest of Industry Analysis and Outlook Volume (Units) Analysis by Application, 2018 to 2033

Figure 206: Rest of Industry Analysis and Outlook Value Share (%) and BPS Analysis by Application, 2023 to 2033

Figure 207: Rest of Industry Analysis and Outlook Y-o-Y Growth (%) Projections by Application, 2023 to 2033

Figure 208: Rest of Industry Analysis and Outlook Value (US$ Million) Analysis by End Use, 2018 to 2033

Figure 209: Rest of Industry Analysis and Outlook Volume (Units) Analysis by End Use, 2018 to 2033

Figure 210: Rest of Industry Analysis and Outlook Value Share (%) and BPS Analysis by End Use, 2023 to 2033

Figure 211: Rest of Industry Analysis and Outlook Y-o-Y Growth (%) Projections by End Use, 2023 to 2033

Figure 212: Rest of Industry Analysis and Outlook Attractiveness by Product Type, 2023 to 2033

Figure 213: Rest of Industry Analysis and Outlook Attractiveness by Lamination, 2023 to 2033

Figure 214: Rest of Industry Analysis and Outlook Attractiveness by Sales Channel, 2023 to 2033

Figure 215: Rest of Industry Analysis and Outlook Attractiveness by Application, 2023 to 2033

Figure 216: Rest of Industry Analysis and Outlook Attractiveness by End Use, 2023 to 2033

Frequently Asked Questions

How big is the Japan Bagasse Tableware Product Industry likely to be in 2023?

The estimated valuation of the industry is USD 41.1 million in 2023.

At what Rate is the Bagasse Tableware Product Ecosystem Projected to Grow in Japan?

The anticipated CAGR for the bagasse tableware product ecosystem in Japan through 2033 is 4.20%.

How big will the Bagasse Tableware Product Industry be in Japan?

Demand for bagasse tableware product in Japan is expected to be USD 62 million by 2033.

Which is the Preferred Product Type in the Bagasse Tableware Product Industry in Japan?

Bagasse plates are the preferred product type in the Japan’s bagasse tableware product industry.

Which End use Segment Area Contributes Significantly to the Japan Bagasse Tableware Product Industry?

The commercial sector drives growth in Japan's bagasse tableware product industry.

Explore Sustainable Packaging Insights

Future Market Insights

Demand and Trend Analysis of Bagasse Tableware Product in Japan