Bagasse Tableware Product Market Size and Share Forecast Outlook in Korea From 2023 to 2033

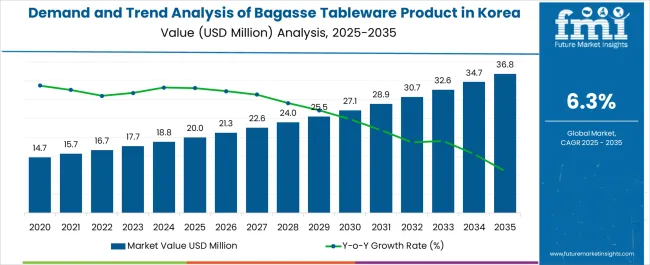
The bagasse tableware product sales in Korea are projected to experience a CAGR of 6.30% through 2033. The industry in Korea is on the brink of substantial opportunities, with a valuation of USD 17.7 million in 2023.

Advancements in manufacturing technologies and processes is expected to lead to cost reductions in producing bagasse tableware, making it a more competitive option for businesses.

The disposability of bagasse tableware aligns with the growing consumer preference for convenient dining solutions, especially for on-the-go and takeout meals. The adoption of bagasse tableware products in Korea is likely to secure USD 32.7 million by 2033.

Key Insights - Highlights to Understand Emerging and Fast Growing Opportunities

  • Many businesses, especially in the foodservice industry, are looking for customization options for their tableware to establish a unique brand identity. Bagasse tableware suppliers can offer this as a value-added service.
  • Emphasizing the durability and quality of bagasse tableware, even in comparison to traditional plastic or paper options, can attract businesses looking for reliable alternatives.
  • Expanding the product range to include items like bagasse cutlery, straws, and other disposable serving products is likely to create more opportunities in the industry.
  • Ongoing research into alternative materials that improve the durability, heat resistance, and functionality of bagasse products is projected to lead to more versatile and marketable options.
Attributes Details
Industry Size in 2023 USD 17.7 million
Expected Industry Size by 2033 USD 32.7 million
Forecasted CAGR from 2023 to 2033 6.30%

Top Market Dynamics and Industry Trends Driving Bagasse Tableware Product Demand in Korea

  • Korea boasts a rich cultural tradition featuring various festivals and ceremonies centered on communal dining. Bagasse tableware emerges as an ideal and cost-effective option for these occasions.
  • Government regulations and standards, ensuring the safety and quality of disposable tableware, create a favorable environment for bagasse tableware manufacturers to thrive and operate.
  • Strategic collaborations between bagasse tableware manufacturers and food service providers are instrumental in broadening the industry's reach and accessing untapped customer segments.
  • Schools, colleges, and corporate cafeterias can be significant consumers of bagasse tableware. Partnerships with these institutions are likely to open up a substantial market within the industry.

Bagasse Tableware Product Industry Analysis by Top Investment Segments in Korea

Bagasse Plates are Meeting the Growing Demand for Sustainable Dining Solutions in Korea

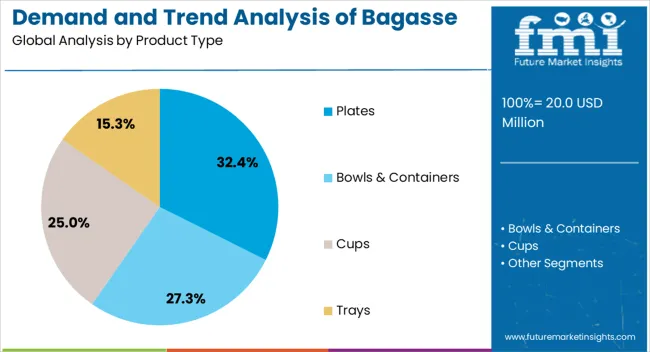
By product type, the plates segment is expected to account for a share of 35.50% in 2023. Plates are versatile and widely used for various types of meals, making them a preferred choice for consumers in Korea.

They are suitable for both regular dining and special occasions. Korea has seen a surge in dining out, whether at restaurants, cafes, or food stalls. The demand for disposable yet aesthetically appealing plates for these dining experiences is growing.

Bagasse Tableware Product in Korea based on Product Type Plates
Industry Share in 2033 35.50%

There is a higher demand for disposable plates to serve these meals conveniently, with the increasing popularity of takeout and food delivery services. Bagasse plates offer a sustainable alternative in this context.

Plates are essential for communal dining during cultural events, festivals, and celebrations. Korea has a rich cultural heritage with various such occasions, creating a consistent demand for plates.

Bagasse Tableware are Meeting Hygiene Standards in Korea’s Commercial Dining Landscape

Based on end use, the commercial segment is expected to account for a share of 64.30% in 2023. Schools and universities often fall under the commercial segment. The institutions require large quantities of tableware for their cafeterias and events, creating a substantial demand for bagasse tableware.

Bagasse Tableware Product in Korea based on End Use Commercial
Industry Share in 2033 64.30%

A surge in the number of food outlets, including quick service restaurants, fine dining establishments, and cafes, has created a substantial industry for bagasse tableware. Stringent health and hygiene standards in commercial food service require clean and safe dining solutions. Bagasse tableware provides a hygienic alternative to traditional options.

The growth of takeout and food delivery services, both through dedicated platforms and in-house services, has led to an upswing in the requirement for disposable tableware by commercial establishments, and bagasse tableware meets this demand.

Analysis of Top Provinces Manufacturing, Distributing, and Consuming Bagasse Tableware Products in Korea

Agricultural Activities to Boost the Industry in the South Gyeongsang

South Gyeongsang is known for its strong agricultural sector. Sugarcane cultivation, one of the primary sources of bagasse, can be a localized source of raw materials for bagasse products, potentially reducing production costs.

An emphasis on seafood and local cuisine, including seafood festivals and events, is expected to drive the use of bagasse tableware in the region, especially in restaurants and food service establishments catering to tourists and locals.

South Gyeongsang has several tourist attractions, such as historic sites, cultural festivals, and natural beauty. The hospitality and food service sector may benefit from the use of bagasse tableware to align with tourism practices.

Rice Culture in North Jeolla to Enhance the Bagasse Tableware Product Landscape

Given the importance of rice in Korean cuisine and the presence of rice-related festivals, there is a potential demand for bagasse tableware during these events. Bagasse products can align with the cultural emphasis on rice.

North Jeolla is home to several educational institutions, including universities and schools. These institutions represent a significant industry for bagasse tableware, especially in their cafeterias and events.

The presence of local manufacturing facilities for bagasse tableware can lead to reduced transportation costs and potentially more competitive pricing for businesses in the region.

Cultural and Traditional Practices in Jeju to Accelerate the Ecosystem

The bagasse tableware industry in the region can be positioned as a choice that aligns with local cultural and traditional practices, making it more appealing to residents and visitors. It has the potential to cater to the demand for disposable dining solutions during special events, festivals, and weddings, enhancing its presence in the industry.

The diverse cuisine in Jeju, including seafood and locally sourced ingredients, is likely to drive the demand for bagasse tableware through 2033, especially in restaurants serving regional dishes.
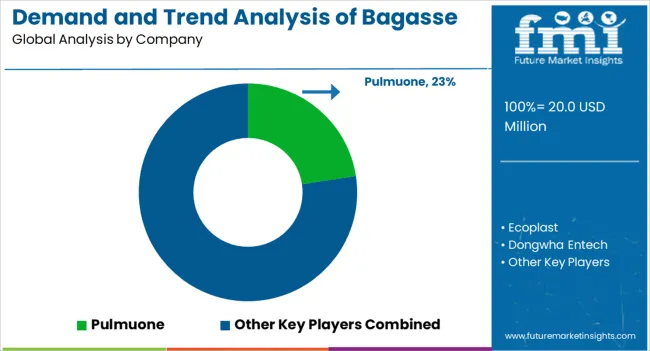
Key Bagasse Tableware Product Market Players and Concentration in Korea

The bagasse tableware product industry in Korea is highly competitive and evolving rapidly due to increasing environmental consciousness and regulatory support. Leading players, as well as local manufacturers, are driving innovation and diversification of products to cater to a range of consumer and commercial needs.

Recent Developments Observed in Bagasse Tableware Product Industry in Korea

  • In 2023, Ecoplast, a key producer of bagasse tableware products in Korea, announced the launch of its new line of biodegradable and compostable bagasse tableware products.
  • In 2023, Dongwha Entech, a leading manufacturer of paper and packaging products in Korea, announced its expansion into the bagasse tableware products industry with the launch of its new line of bagasse tableware products.
  • In 2023, Pulmuone, a top food and beverage company in Korea, announced its launch of its new line of bagasse tableware products under its Pulmuone Eco brand.
  • In 2022, BioGreen, a prime producer of biodegradable and compostable products in Korea, announced the launch of its new line of bagasse tableware products.
  • In 2022, Hanwha Solutions, a leading chemical company in Korea, announced its investment in Ecoplast to support the expansion of the company into the global bagasse tableware products industry.

Leading Suppliers of Bagasse Tableware Products in Korea

  • Ecoplast
  • Dongwha Entech
  • Pulmuone
  • CJ CheilJedang
  • Lotte Food
  • BioGreen
  • Hanwha Solutions
  • SK Chemicals
  • Hyundai Department Store
  • Lotte Department Store

Key Shifting Preferences Covered in Korea Bagasse Tableware Product Market Report

Attribute Details
Estimated Industry Size in 2023 USD 17.7 million
Projected Industry Size by 2033 USD 32.7 million
Anticipated CAGR from 2023 to 2033 6.30% CAGR
Historical Analysis of Demand for Bagasse Tableware Product in Korea 2018 to 2022
Demand Forecast for Bagasse Tableware Product in Korea 2023 to 2033
Report Coverage Industry Size, Industry Trends, Analysis of key factors influencing Bagasse Tableware Product adoption in Korea, Insights on Global Players and their Industry Strategy in Korea, Ecosystem Analysis of Manufacturers in Korea
Key Provinces Analyzed while Studying Opportunities in Bagasse Tableware Product in Korea South Gyeongsang, North Jeolla, South Jeolla, Jeju
Key Companies Profiled Ecoplast; Dongwha Entech; Pulmuone; CJ CheilJedang; Lotte Food; BioGreen; Hanwha Solutions; SK Chemicals; Hyundai Department Store; Lotte Department Store

Top Segments Studied in the Korea Bagasse Tableware Product Market Research Report

By Product Type:

  • Plates
    • Less than 8 inches
    • 8 inches to 12 inches
    • More than 12 inches
  • Bowls & Containers
    • Less than 12 Oz
    • 12 Oz to 16 Oz
    • More than 16 Oz
  • Cups
    • Less than 6 Oz
    • 6 Oz to 12 Oz
    • More than 12 Oz
  • Trays
    • Less than 8 inches
    • 8 inches to 12 inches
    • More than 12 inches
    • Clamshells
    • Less than 8 inches
    • 8 inches to 12 inches
    • More than 12 inches
  • End Caps
  • Drink Carriers
  • Straw
  • Cutlery (Spoons, Fork, Knife & Spork)

By Lamination:

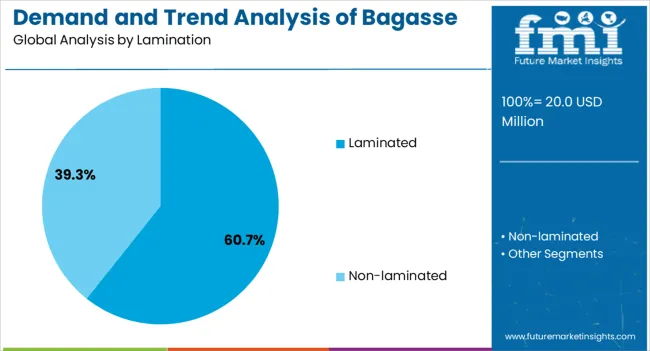
  • Laminated
  • Non-laminated

By Sales Channel:

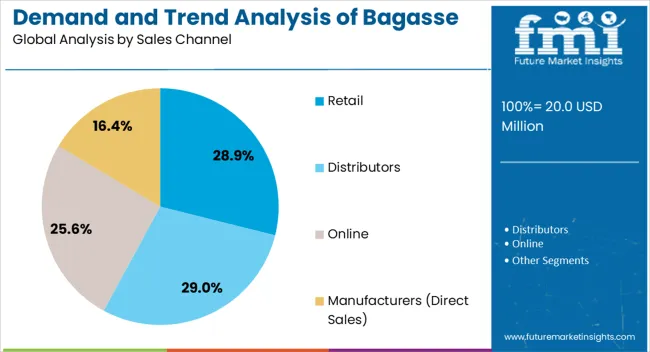
  • Manufacturers (Direct Sales)
  • Retail
    • Hypermarket
    • Supermarket
    • Convenience Store
    • Specialty Stores
  • Distributors
  • Online

By Application:

  • Food
    • Fruits & Vegetables
    • Processed Food
    • Ready-to-eat meals
    • Bakery & Confectionery
    • Cereals
    • Dairy
    • Others Food Products
  • Beverages

By End Use:

  • Commercial Use
    • Hotels & Cafes
    • Full-Service Restaurants
    • Quick Service Restaurants
    • Venues & Catering
    • Mobile Food Vendors
    • Bakery & Patisserie
  • Institutional Use
    • Schools & Colleges
    • Offices
    • Hospitals
    • Airports & Railways
  • Household Use

By City/Province:

  • South Gyeongsang
  • North Jeolla
  • South Jeolla
  • Jeju

Table of Content

  • 1. Executive Summary
  • 2. Market Overview
  • 3. Market Background
  • 4. Industry Analysis and Outlook 2018 to 2022 and Forecast, 2023 to 2033
  • 5. Industry Analysis and Outlook 2018 to 2022 and Forecast 2023 to 2033, By Product Type
    • 5.1. Plates
    • 5.2. Bowls & Containers
    • 5.3. Cups
    • 5.4. Trays
    • 5.5. Clamshell
    • 5.6. End Caps
    • 5.7. Drink Carriers
    • 5.8. Straw
    • 5.9. Cutlery
  • 6. Industry Analysis and Outlook 2018 to 2022 and Forecast 2023 to 2033, By Lamination
    • 6.1. Laminated
    • 6.2. Non-Laminated
  • 7. Industry Analysis and Outlook 2018 to 2022 and Forecast 2023 to 2033, By Sales Channel
    • 7.1. Manufacturers
    • 7.2. Retail
    • 7.3. Distributors
    • 7.4. Online
  • 8. Industry Analysis and Outlook 2018 to 2022 and Forecast 2023 to 2033, By Application
    • 8.1. Food
    • 8.2. Beverages
  • 9. Industry Analysis and Outlook 2018 to 2022 and Forecast 2023 to 2033, By End Use
    • 9.1. Commercial
    • 9.2. Institutional
    • 9.3. Household Use
  • 10. Industry Analysis and Outlook 2018 to 2022 and Forecast 2023 to 2033, By Region
    • 10.1. South Gyeongsang
    • 10.2. North Jeolla
    • 10.3. South Jeolla
    • 10.4. Jeju
    • 10.5. Rest of Korea
  • 11. South Industry Analysis and Outlook 2018 to 2022 and Forecast 2023 to 2033
  • 12. North Jeolla Industry Analysis and Outlook 2018 to 2022 and Forecast 2023 to 2033
  • 13. South Jeolla Industry Analysis and Outlook 2018 to 2022 and Forecast 2023 to 2033
  • 14. Jeju Industry Analysis and Outlook 2018 to 2022 and Forecast 2023 to 2033
  • 15. Rest of Industry Analysis and Outlook 2018 to 2022 and Forecast 2023 to 2033
  • 16. Market Structure Analysis
  • 17. Competition Analysis
    • 17.1. Vegware Ltd.
    • 17.2. Green Good Pack Inc.
    • 17.3. Pactiv Evergreen Inc.
    • 17.4. Dart Container Corporation
    • 17.5. Genpak, LLC
    • 17.6. Material Motion, Inc
    • 17.7. Natural Tableware
    • 17.8. Eco-Products, Inc.
    • 17.9. Karat by Lollicup
    • 17.10. Dinearth
  • 18. Assumptions & Acronyms Used
  • 19. Research Methodology

List of Tables

Table 1: Industry Analysis and Outlook Value (US$ Million) Forecast by Region, 2018 to 2033

Table 2: Industry Analysis and Outlook Volume (Units) Forecast by Region, 2018 to 2033

Table 3: Industry Analysis and Outlook Value (US$ Million) Forecast by Product Type, 2018 to 2033

Table 4: Industry Analysis and Outlook Volume (Units) Forecast by Product Type, 2018 to 2033

Table 5: Industry Analysis and Outlook Value (US$ Million) Forecast by Lamination, 2018 to 2033

Table 6: Industry Analysis and Outlook Volume (Units) Forecast by Lamination, 2018 to 2033

Table 7: Industry Analysis and Outlook Value (US$ Million) Forecast by Sales Channel, 2018 to 2033

Table 8: Industry Analysis and Outlook Volume (Units) Forecast by Sales Channel, 2018 to 2033

Table 9: Industry Analysis and Outlook Value (US$ Million) Forecast by Application, 2018 to 2033

Table 10: Industry Analysis and Outlook Volume (Units) Forecast by Application, 2018 to 2033

Table 11: Industry Analysis and Outlook Value (US$ Million) Forecast by End Use, 2018 to 2033

Table 12: Industry Analysis and Outlook Volume (Units) Forecast by End Use, 2018 to 2033

Table 13: South Industry Analysis and Outlook Value (US$ Million) Forecast by Product Type, 2018 to 2033

Table 14: South Industry Analysis and Outlook Volume (Units) Forecast by Product Type, 2018 to 2033

Table 15: South Industry Analysis and Outlook Value (US$ Million) Forecast by Lamination, 2018 to 2033

Table 16: South Industry Analysis and Outlook Volume (Units) Forecast by Lamination, 2018 to 2033

Table 17: South Industry Analysis and Outlook Value (US$ Million) Forecast by Sales Channel, 2018 to 2033

Table 18: South Industry Analysis and Outlook Volume (Units) Forecast by Sales Channel, 2018 to 2033

Table 19: South Industry Analysis and Outlook Value (US$ Million) Forecast by Application, 2018 to 2033

Table 20: South Industry Analysis and Outlook Volume (Units) Forecast by Application, 2018 to 2033

Table 21: South Industry Analysis and Outlook Value (US$ Million) Forecast by End Use, 2018 to 2033

Table 22: South Industry Analysis and Outlook Volume (Units) Forecast by End Use, 2018 to 2033

Table 23: North Jeolla Industry Analysis and Outlook Value (US$ Million) Forecast by Product Type, 2018 to 2033

Table 24: North Jeolla Industry Analysis and Outlook Volume (Units) Forecast by Product Type, 2018 to 2033

Table 25: North Jeolla Industry Analysis and Outlook Value (US$ Million) Forecast by Lamination, 2018 to 2033

Table 26: North Jeolla Industry Analysis and Outlook Volume (Units) Forecast by Lamination, 2018 to 2033

Table 27: North Jeolla Industry Analysis and Outlook Value (US$ Million) Forecast by Sales Channel, 2018 to 2033

Table 28: North Jeolla Industry Analysis and Outlook Volume (Units) Forecast by Sales Channel, 2018 to 2033

Table 29: North Jeolla Industry Analysis and Outlook Value (US$ Million) Forecast by Application, 2018 to 2033

Table 30: North Jeolla Industry Analysis and Outlook Volume (Units) Forecast by Application, 2018 to 2033

Table 31: North Jeolla Industry Analysis and Outlook Value (US$ Million) Forecast by End Use, 2018 to 2033

Table 32: North Jeolla Industry Analysis and Outlook Volume (Units) Forecast by End Use, 2018 to 2033

Table 33: South Jeolla Industry Analysis and Outlook Value (US$ Million) Forecast by Product Type, 2018 to 2033

Table 34: South Jeolla Industry Analysis and Outlook Volume (Units) Forecast by Product Type, 2018 to 2033

Table 35: South Jeolla Industry Analysis and Outlook Value (US$ Million) Forecast by Lamination, 2018 to 2033

Table 36: South Jeolla Industry Analysis and Outlook Volume (Units) Forecast by Lamination, 2018 to 2033

Table 37: South Jeolla Industry Analysis and Outlook Value (US$ Million) Forecast by Sales Channel, 2018 to 2033

Table 38: South Jeolla Industry Analysis and Outlook Volume (Units) Forecast by Sales Channel, 2018 to 2033

Table 39: South Jeolla Industry Analysis and Outlook Value (US$ Million) Forecast by Application, 2018 to 2033

Table 40: South Jeolla Industry Analysis and Outlook Volume (Units) Forecast by Application, 2018 to 2033

Table 41: South Jeolla Industry Analysis and Outlook Value (US$ Million) Forecast by End Use, 2018 to 2033

Table 42: South Jeolla Industry Analysis and Outlook Volume (Units) Forecast by End Use, 2018 to 2033

Table 43: Jeju Industry Analysis and Outlook Value (US$ Million) Forecast by Product Type, 2018 to 2033

Table 44: Jeju Industry Analysis and Outlook Volume (Units) Forecast by Product Type, 2018 to 2033

Table 45: Jeju Industry Analysis and Outlook Value (US$ Million) Forecast by Lamination, 2018 to 2033

Table 46: Jeju Industry Analysis and Outlook Volume (Units) Forecast by Lamination, 2018 to 2033

Table 47: Jeju Industry Analysis and Outlook Value (US$ Million) Forecast by Sales Channel, 2018 to 2033

Table 48: Jeju Industry Analysis and Outlook Volume (Units) Forecast by Sales Channel, 2018 to 2033

Table 49: Jeju Industry Analysis and Outlook Value (US$ Million) Forecast by Application, 2018 to 2033

Table 50: Jeju Industry Analysis and Outlook Volume (Units) Forecast by Application, 2018 to 2033

Table 51: Jeju Industry Analysis and Outlook Value (US$ Million) Forecast by End Use, 2018 to 2033

Table 52: Jeju Industry Analysis and Outlook Volume (Units) Forecast by End Use, 2018 to 2033

Table 53: Rest of Industry Analysis and Outlook Value (US$ Million) Forecast by Product Type, 2018 to 2033

Table 54: Rest of Industry Analysis and Outlook Volume (Units) Forecast by Product Type, 2018 to 2033

Table 55: Rest of Industry Analysis and Outlook Value (US$ Million) Forecast by Lamination, 2018 to 2033

Table 56: Rest of Industry Analysis and Outlook Volume (Units) Forecast by Lamination, 2018 to 2033

Table 57: Rest of Industry Analysis and Outlook Value (US$ Million) Forecast by Sales Channel, 2018 to 2033

Table 58: Rest of Industry Analysis and Outlook Volume (Units) Forecast by Sales Channel, 2018 to 2033

Table 59: Rest of Industry Analysis and Outlook Value (US$ Million) Forecast by Application, 2018 to 2033

Table 60: Rest of Industry Analysis and Outlook Volume (Units) Forecast by Application, 2018 to 2033

Table 61: Rest of Industry Analysis and Outlook Value (US$ Million) Forecast by End Use, 2018 to 2033

Table 62: Rest of Industry Analysis and Outlook Volume (Units) Forecast by End Use, 2018 to 2033

List of Figures

Figure 1: Industry Analysis and Outlook Value (US$ Million) by Product Type, 2023 to 2033

Figure 2: Industry Analysis and Outlook Value (US$ Million) by Lamination, 2023 to 2033

Figure 3: Industry Analysis and Outlook Value (US$ Million) by Sales Channel, 2023 to 2033

Figure 4: Industry Analysis and Outlook Value (US$ Million) by Application, 2023 to 2033

Figure 5: Industry Analysis and Outlook Value (US$ Million) by End Use, 2023 to 2033

Figure 6: Industry Analysis and Outlook Value (US$ Million) by Region, 2023 to 2033

Figure 7: Industry Analysis and Outlook Value (US$ Million) Analysis by Region, 2018 to 2033

Figure 8: Industry Analysis and Outlook Volume (Units) Analysis by Region, 2018 to 2033

Figure 9: Industry Analysis and Outlook Value Share (%) and BPS Analysis by Region, 2023 to 2033

Figure 10: Industry Analysis and Outlook Y-o-Y Growth (%) Projections by Region, 2023 to 2033

Figure 11: Industry Analysis and Outlook Value (US$ Million) Analysis by Product Type, 2018 to 2033

Figure 12: Industry Analysis and Outlook Volume (Units) Analysis by Product Type, 2018 to 2033

Figure 13: Industry Analysis and Outlook Value Share (%) and BPS Analysis by Product Type, 2023 to 2033

Figure 14: Industry Analysis and Outlook Y-o-Y Growth (%) Projections by Product Type, 2023 to 2033

Figure 15: Industry Analysis and Outlook Value (US$ Million) Analysis by Lamination, 2018 to 2033

Figure 16: Industry Analysis and Outlook Volume (Units) Analysis by Lamination, 2018 to 2033

Figure 17: Industry Analysis and Outlook Value Share (%) and BPS Analysis by Lamination, 2023 to 2033

Figure 18: Industry Analysis and Outlook Y-o-Y Growth (%) Projections by Lamination, 2023 to 2033

Figure 19: Industry Analysis and Outlook Value (US$ Million) Analysis by Sales Channel, 2018 to 2033

Figure 20: Industry Analysis and Outlook Volume (Units) Analysis by Sales Channel, 2018 to 2033

Figure 21: Industry Analysis and Outlook Value Share (%) and BPS Analysis by Sales Channel, 2023 to 2033

Figure 22: Industry Analysis and Outlook Y-o-Y Growth (%) Projections by Sales Channel, 2023 to 2033

Figure 23: Industry Analysis and Outlook Value (US$ Million) Analysis by Application, 2018 to 2033

Figure 24: Industry Analysis and Outlook Volume (Units) Analysis by Application, 2018 to 2033

Figure 25: Industry Analysis and Outlook Value Share (%) and BPS Analysis by Application, 2023 to 2033

Figure 26: Industry Analysis and Outlook Y-o-Y Growth (%) Projections by Application, 2023 to 2033

Figure 27: Industry Analysis and Outlook Value (US$ Million) Analysis by End Use, 2018 to 2033

Figure 28: Industry Analysis and Outlook Volume (Units) Analysis by End Use, 2018 to 2033

Figure 29: Industry Analysis and Outlook Value Share (%) and BPS Analysis by End Use, 2023 to 2033

Figure 30: Industry Analysis and Outlook Y-o-Y Growth (%) Projections by End Use, 2023 to 2033

Figure 31: Industry Analysis and Outlook Attractiveness by Product Type, 2023 to 2033

Figure 32: Industry Analysis and Outlook Attractiveness by Lamination, 2023 to 2033

Figure 33: Industry Analysis and Outlook Attractiveness by Sales Channel, 2023 to 2033

Figure 34: Industry Analysis and Outlook Attractiveness by Application, 2023 to 2033

Figure 35: Industry Analysis and Outlook Attractiveness by End Use, 2023 to 2033

Figure 36: Industry Analysis and Outlook Attractiveness by Region, 2023 to 2033

Figure 37: South Industry Analysis and Outlook Value (US$ Million) by Product Type, 2023 to 2033

Figure 38: South Industry Analysis and Outlook Value (US$ Million) by Lamination, 2023 to 2033

Figure 39: South Industry Analysis and Outlook Value (US$ Million) by Sales Channel, 2023 to 2033

Figure 40: South Industry Analysis and Outlook Value (US$ Million) by Application, 2023 to 2033

Figure 41: South Industry Analysis and Outlook Value (US$ Million) by End Use, 2023 to 2033

Figure 42: South Industry Analysis and Outlook Value (US$ Million) Analysis by Product Type, 2018 to 2033

Figure 43: South Industry Analysis and Outlook Volume (Units) Analysis by Product Type, 2018 to 2033

Figure 44: South Industry Analysis and Outlook Value Share (%) and BPS Analysis by Product Type, 2023 to 2033

Figure 45: South Industry Analysis and Outlook Y-o-Y Growth (%) Projections by Product Type, 2023 to 2033

Figure 46: South Industry Analysis and Outlook Value (US$ Million) Analysis by Lamination, 2018 to 2033

Figure 47: South Industry Analysis and Outlook Volume (Units) Analysis by Lamination, 2018 to 2033

Figure 48: South Industry Analysis and Outlook Value Share (%) and BPS Analysis by Lamination, 2023 to 2033

Figure 49: South Industry Analysis and Outlook Y-o-Y Growth (%) Projections by Lamination, 2023 to 2033

Figure 50: South Industry Analysis and Outlook Value (US$ Million) Analysis by Sales Channel, 2018 to 2033

Figure 51: South Industry Analysis and Outlook Volume (Units) Analysis by Sales Channel, 2018 to 2033

Figure 52: South Industry Analysis and Outlook Value Share (%) and BPS Analysis by Sales Channel, 2023 to 2033

Figure 53: South Industry Analysis and Outlook Y-o-Y Growth (%) Projections by Sales Channel, 2023 to 2033

Figure 54: South Industry Analysis and Outlook Value (US$ Million) Analysis by Application, 2018 to 2033

Figure 55: South Industry Analysis and Outlook Volume (Units) Analysis by Application, 2018 to 2033

Figure 56: South Industry Analysis and Outlook Value Share (%) and BPS Analysis by Application, 2023 to 2033

Figure 57: South Industry Analysis and Outlook Y-o-Y Growth (%) Projections by Application, 2023 to 2033

Figure 58: South Industry Analysis and Outlook Value (US$ Million) Analysis by End Use, 2018 to 2033

Figure 59: South Industry Analysis and Outlook Volume (Units) Analysis by End Use, 2018 to 2033

Figure 60: South Industry Analysis and Outlook Value Share (%) and BPS Analysis by End Use, 2023 to 2033

Figure 61: South Industry Analysis and Outlook Y-o-Y Growth (%) Projections by End Use, 2023 to 2033

Figure 62: South Industry Analysis and Outlook Attractiveness by Product Type, 2023 to 2033

Figure 63: South Industry Analysis and Outlook Attractiveness by Lamination, 2023 to 2033

Figure 64: South Industry Analysis and Outlook Attractiveness by Sales Channel, 2023 to 2033

Figure 65: South Industry Analysis and Outlook Attractiveness by Application, 2023 to 2033

Figure 66: South Industry Analysis and Outlook Attractiveness by End Use, 2023 to 2033

Figure 67: North Jeolla Industry Analysis and Outlook Value (US$ Million) by Product Type, 2023 to 2033

Figure 68: North Jeolla Industry Analysis and Outlook Value (US$ Million) by Lamination, 2023 to 2033

Figure 69: North Jeolla Industry Analysis and Outlook Value (US$ Million) by Sales Channel, 2023 to 2033

Figure 70: North Jeolla Industry Analysis and Outlook Value (US$ Million) by Application, 2023 to 2033

Figure 71: North Jeolla Industry Analysis and Outlook Value (US$ Million) by End Use, 2023 to 2033

Figure 72: North Jeolla Industry Analysis and Outlook Value (US$ Million) Analysis by Product Type, 2018 to 2033

Figure 73: North Jeolla Industry Analysis and Outlook Volume (Units) Analysis by Product Type, 2018 to 2033

Figure 74: North Jeolla Industry Analysis and Outlook Value Share (%) and BPS Analysis by Product Type, 2023 to 2033

Figure 75: North Jeolla Industry Analysis and Outlook Y-o-Y Growth (%) Projections by Product Type, 2023 to 2033

Figure 76: North Jeolla Industry Analysis and Outlook Value (US$ Million) Analysis by Lamination, 2018 to 2033

Figure 77: North Jeolla Industry Analysis and Outlook Volume (Units) Analysis by Lamination, 2018 to 2033

Figure 78: North Jeolla Industry Analysis and Outlook Value Share (%) and BPS Analysis by Lamination, 2023 to 2033

Figure 79: North Jeolla Industry Analysis and Outlook Y-o-Y Growth (%) Projections by Lamination, 2023 to 2033

Figure 80: North Jeolla Industry Analysis and Outlook Value (US$ Million) Analysis by Sales Channel, 2018 to 2033

Figure 81: North Jeolla Industry Analysis and Outlook Volume (Units) Analysis by Sales Channel, 2018 to 2033

Figure 82: North Jeolla Industry Analysis and Outlook Value Share (%) and BPS Analysis by Sales Channel, 2023 to 2033

Figure 83: North Jeolla Industry Analysis and Outlook Y-o-Y Growth (%) Projections by Sales Channel, 2023 to 2033

Figure 84: North Jeolla Industry Analysis and Outlook Value (US$ Million) Analysis by Application, 2018 to 2033

Figure 85: North Jeolla Industry Analysis and Outlook Volume (Units) Analysis by Application, 2018 to 2033

Figure 86: North Jeolla Industry Analysis and Outlook Value Share (%) and BPS Analysis by Application, 2023 to 2033

Figure 87: North Jeolla Industry Analysis and Outlook Y-o-Y Growth (%) Projections by Application, 2023 to 2033

Figure 88: North Jeolla Industry Analysis and Outlook Value (US$ Million) Analysis by End Use, 2018 to 2033

Figure 89: North Jeolla Industry Analysis and Outlook Volume (Units) Analysis by End Use, 2018 to 2033

Figure 90: North Jeolla Industry Analysis and Outlook Value Share (%) and BPS Analysis by End Use, 2023 to 2033

Figure 91: North Jeolla Industry Analysis and Outlook Y-o-Y Growth (%) Projections by End Use, 2023 to 2033

Figure 92: North Jeolla Industry Analysis and Outlook Attractiveness by Product Type, 2023 to 2033

Figure 93: North Jeolla Industry Analysis and Outlook Attractiveness by Lamination, 2023 to 2033

Figure 94: North Jeolla Industry Analysis and Outlook Attractiveness by Sales Channel, 2023 to 2033

Figure 95: North Jeolla Industry Analysis and Outlook Attractiveness by Application, 2023 to 2033

Figure 96: North Jeolla Industry Analysis and Outlook Attractiveness by End Use, 2023 to 2033

Figure 97: South Jeolla Industry Analysis and Outlook Value (US$ Million) by Product Type, 2023 to 2033

Figure 98: South Jeolla Industry Analysis and Outlook Value (US$ Million) by Lamination, 2023 to 2033

Figure 99: South Jeolla Industry Analysis and Outlook Value (US$ Million) by Sales Channel, 2023 to 2033

Figure 100: South Jeolla Industry Analysis and Outlook Value (US$ Million) by Application, 2023 to 2033

Figure 101: South Jeolla Industry Analysis and Outlook Value (US$ Million) by End Use, 2023 to 2033

Figure 102: South Jeolla Industry Analysis and Outlook Value (US$ Million) Analysis by Product Type, 2018 to 2033

Figure 103: South Jeolla Industry Analysis and Outlook Volume (Units) Analysis by Product Type, 2018 to 2033

Figure 104: South Jeolla Industry Analysis and Outlook Value Share (%) and BPS Analysis by Product Type, 2023 to 2033

Figure 105: South Jeolla Industry Analysis and Outlook Y-o-Y Growth (%) Projections by Product Type, 2023 to 2033

Figure 106: South Jeolla Industry Analysis and Outlook Value (US$ Million) Analysis by Lamination, 2018 to 2033

Figure 107: South Jeolla Industry Analysis and Outlook Volume (Units) Analysis by Lamination, 2018 to 2033

Figure 108: South Jeolla Industry Analysis and Outlook Value Share (%) and BPS Analysis by Lamination, 2023 to 2033

Figure 109: South Jeolla Industry Analysis and Outlook Y-o-Y Growth (%) Projections by Lamination, 2023 to 2033

Figure 110: South Jeolla Industry Analysis and Outlook Value (US$ Million) Analysis by Sales Channel, 2018 to 2033

Figure 111: South Jeolla Industry Analysis and Outlook Volume (Units) Analysis by Sales Channel, 2018 to 2033

Figure 112: South Jeolla Industry Analysis and Outlook Value Share (%) and BPS Analysis by Sales Channel, 2023 to 2033

Figure 113: South Jeolla Industry Analysis and Outlook Y-o-Y Growth (%) Projections by Sales Channel, 2023 to 2033

Figure 114: South Jeolla Industry Analysis and Outlook Value (US$ Million) Analysis by Application, 2018 to 2033

Figure 115: South Jeolla Industry Analysis and Outlook Volume (Units) Analysis by Application, 2018 to 2033

Figure 116: South Jeolla Industry Analysis and Outlook Value Share (%) and BPS Analysis by Application, 2023 to 2033

Figure 117: South Jeolla Industry Analysis and Outlook Y-o-Y Growth (%) Projections by Application, 2023 to 2033

Figure 118: South Jeolla Industry Analysis and Outlook Value (US$ Million) Analysis by End Use, 2018 to 2033

Figure 119: South Jeolla Industry Analysis and Outlook Volume (Units) Analysis by End Use, 2018 to 2033

Figure 120: South Jeolla Industry Analysis and Outlook Value Share (%) and BPS Analysis by End Use, 2023 to 2033

Figure 121: South Jeolla Industry Analysis and Outlook Y-o-Y Growth (%) Projections by End Use, 2023 to 2033

Figure 122: South Jeolla Industry Analysis and Outlook Attractiveness by Product Type, 2023 to 2033

Figure 123: South Jeolla Industry Analysis and Outlook Attractiveness by Lamination, 2023 to 2033

Figure 124: South Jeolla Industry Analysis and Outlook Attractiveness by Sales Channel, 2023 to 2033

Figure 125: South Jeolla Industry Analysis and Outlook Attractiveness by Application, 2023 to 2033

Figure 126: South Jeolla Industry Analysis and Outlook Attractiveness by End Use, 2023 to 2033

Figure 127: Jeju Industry Analysis and Outlook Value (US$ Million) by Product Type, 2023 to 2033

Figure 128: Jeju Industry Analysis and Outlook Value (US$ Million) by Lamination, 2023 to 2033

Figure 129: Jeju Industry Analysis and Outlook Value (US$ Million) by Sales Channel, 2023 to 2033

Figure 130: Jeju Industry Analysis and Outlook Value (US$ Million) by Application, 2023 to 2033

Figure 131: Jeju Industry Analysis and Outlook Value (US$ Million) by End Use, 2023 to 2033

Figure 132: Jeju Industry Analysis and Outlook Value (US$ Million) Analysis by Product Type, 2018 to 2033

Figure 133: Jeju Industry Analysis and Outlook Volume (Units) Analysis by Product Type, 2018 to 2033

Figure 134: Jeju Industry Analysis and Outlook Value Share (%) and BPS Analysis by Product Type, 2023 to 2033

Figure 135: Jeju Industry Analysis and Outlook Y-o-Y Growth (%) Projections by Product Type, 2023 to 2033

Figure 136: Jeju Industry Analysis and Outlook Value (US$ Million) Analysis by Lamination, 2018 to 2033

Figure 137: Jeju Industry Analysis and Outlook Volume (Units) Analysis by Lamination, 2018 to 2033

Figure 138: Jeju Industry Analysis and Outlook Value Share (%) and BPS Analysis by Lamination, 2023 to 2033

Figure 139: Jeju Industry Analysis and Outlook Y-o-Y Growth (%) Projections by Lamination, 2023 to 2033

Figure 140: Jeju Industry Analysis and Outlook Value (US$ Million) Analysis by Sales Channel, 2018 to 2033

Figure 141: Jeju Industry Analysis and Outlook Volume (Units) Analysis by Sales Channel, 2018 to 2033

Figure 142: Jeju Industry Analysis and Outlook Value Share (%) and BPS Analysis by Sales Channel, 2023 to 2033

Figure 143: Jeju Industry Analysis and Outlook Y-o-Y Growth (%) Projections by Sales Channel, 2023 to 2033

Figure 144: Jeju Industry Analysis and Outlook Value (US$ Million) Analysis by Application, 2018 to 2033

Figure 145: Jeju Industry Analysis and Outlook Volume (Units) Analysis by Application, 2018 to 2033

Figure 146: Jeju Industry Analysis and Outlook Value Share (%) and BPS Analysis by Application, 2023 to 2033

Figure 147: Jeju Industry Analysis and Outlook Y-o-Y Growth (%) Projections by Application, 2023 to 2033

Figure 148: Jeju Industry Analysis and Outlook Value (US$ Million) Analysis by End Use, 2018 to 2033

Figure 149: Jeju Industry Analysis and Outlook Volume (Units) Analysis by End Use, 2018 to 2033

Figure 150: Jeju Industry Analysis and Outlook Value Share (%) and BPS Analysis by End Use, 2023 to 2033

Figure 151: Jeju Industry Analysis and Outlook Y-o-Y Growth (%) Projections by End Use, 2023 to 2033

Figure 152: Jeju Industry Analysis and Outlook Attractiveness by Product Type, 2023 to 2033

Figure 153: Jeju Industry Analysis and Outlook Attractiveness by Lamination, 2023 to 2033

Figure 154: Jeju Industry Analysis and Outlook Attractiveness by Sales Channel, 2023 to 2033

Figure 155: Jeju Industry Analysis and Outlook Attractiveness by Application, 2023 to 2033

Figure 156: Jeju Industry Analysis and Outlook Attractiveness by End Use, 2023 to 2033

Figure 157: Rest of Industry Analysis and Outlook Value (US$ Million) by Product Type, 2023 to 2033

Figure 158: Rest of Industry Analysis and Outlook Value (US$ Million) by Lamination, 2023 to 2033

Figure 159: Rest of Industry Analysis and Outlook Value (US$ Million) by Sales Channel, 2023 to 2033

Figure 160: Rest of Industry Analysis and Outlook Value (US$ Million) by Application, 2023 to 2033

Figure 161: Rest of Industry Analysis and Outlook Value (US$ Million) by End Use, 2023 to 2033

Figure 162: Rest of Industry Analysis and Outlook Value (US$ Million) Analysis by Product Type, 2018 to 2033

Figure 163: Rest of Industry Analysis and Outlook Volume (Units) Analysis by Product Type, 2018 to 2033

Figure 164: Rest of Industry Analysis and Outlook Value Share (%) and BPS Analysis by Product Type, 2023 to 2033

Figure 165: Rest of Industry Analysis and Outlook Y-o-Y Growth (%) Projections by Product Type, 2023 to 2033

Figure 166: Rest of Industry Analysis and Outlook Value (US$ Million) Analysis by Lamination, 2018 to 2033

Figure 167: Rest of Industry Analysis and Outlook Volume (Units) Analysis by Lamination, 2018 to 2033

Figure 168: Rest of Industry Analysis and Outlook Value Share (%) and BPS Analysis by Lamination, 2023 to 2033

Figure 169: Rest of Industry Analysis and Outlook Y-o-Y Growth (%) Projections by Lamination, 2023 to 2033

Figure 170: Rest of Industry Analysis and Outlook Value (US$ Million) Analysis by Sales Channel, 2018 to 2033

Figure 171: Rest of Industry Analysis and Outlook Volume (Units) Analysis by Sales Channel, 2018 to 2033

Figure 172: Rest of Industry Analysis and Outlook Value Share (%) and BPS Analysis by Sales Channel, 2023 to 2033

Figure 173: Rest of Industry Analysis and Outlook Y-o-Y Growth (%) Projections by Sales Channel, 2023 to 2033

Figure 174: Rest of Industry Analysis and Outlook Value (US$ Million) Analysis by Application, 2018 to 2033

Figure 175: Rest of Industry Analysis and Outlook Volume (Units) Analysis by Application, 2018 to 2033

Figure 176: Rest of Industry Analysis and Outlook Value Share (%) and BPS Analysis by Application, 2023 to 2033

Figure 177: Rest of Industry Analysis and Outlook Y-o-Y Growth (%) Projections by Application, 2023 to 2033

Figure 178: Rest of Industry Analysis and Outlook Value (US$ Million) Analysis by End Use, 2018 to 2033

Figure 179: Rest of Industry Analysis and Outlook Volume (Units) Analysis by End Use, 2018 to 2033

Figure 180: Rest of Industry Analysis and Outlook Value Share (%) and BPS Analysis by End Use, 2023 to 2033

Figure 181: Rest of Industry Analysis and Outlook Y-o-Y Growth (%) Projections by End Use, 2023 to 2033

Figure 182: Rest of Industry Analysis and Outlook Attractiveness by Product Type, 2023 to 2033

Figure 183: Rest of Industry Analysis and Outlook Attractiveness by Lamination, 2023 to 2033

Figure 184: Rest of Industry Analysis and Outlook Attractiveness by Sales Channel, 2023 to 2033

Figure 185: Rest of Industry Analysis and Outlook Attractiveness by Application, 2023 to 2033

Figure 186: Rest of Industry Analysis and Outlook Attractiveness by End Use, 2023 to 2033

Frequently Asked Questions

What is the Current Size of the Bagasse Tableware Product Industry in Korea?

The bagasse tableware product industry in Korea is valued at USD 17.7 million in 2023.

At what Rate is the Bagasse Tableware Product Ecosystem Projected to Grow in Korea?

The anticipated CAGR for bagasse tableware product industry in Korea through 2033 is 6.30%.

How big will be the Demand for the Bagasse Tableware Product in Korea?

Demand for bagasse tableware product in Korea is expected to reach USD 32.7 million by 2033.

Which is the Preferred Product Type for Bagasse Tableware Product Industry in Korea?

Bagasse plates are commonly preferred in the Korea’s bagasse tableware industry.

Which End Use Contributes Significantly to the Bagasse Tableware Product Industry in Korea?

The commercial segment to remain a key contributor in the bagasse tableware product ecosystem in Korea.

Explore Sustainable Packaging Insights

Future Market Insights

Demand and Trend Analysis of Bagasse Tableware Product in Korea