Marine Squalene Alternatives Market Size and Share Forecast Outlook 2025 to 2035

The Marine Squalene Alternatives Market is projected to record a valuation of USD 186.6 million in 2025 and reach USD 466.7 million in 2035, representing an absolute increase of over USD 280.1 million during the period. The overall expansion reflects a CAGR of 9.5%, underscoring strong momentum driven by sustainability imperatives, ethical sourcing, and innovation in biotechnology.
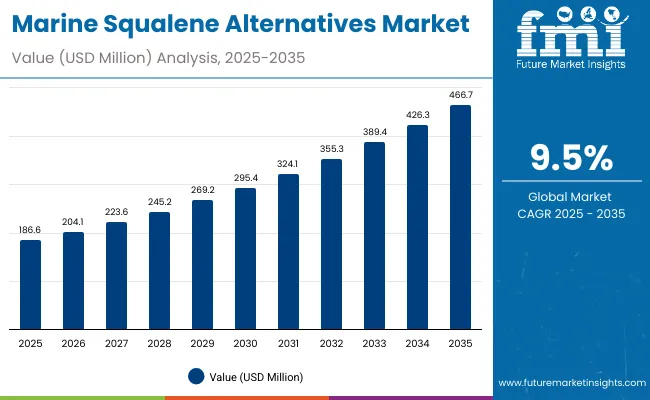
Marine Squalene Alternatives Market 1

Quick Stats for Marine Squalene Alternatives Market

  • Marine Squalene Alternatives Market Value (2025): USD 186.6 million
  • Marine Squalene Alternatives Market Forecast Value (2035): USD 466.7million
  • Marine Squalene Alternatives Forecast CAGR: 9.5%
  • Leading Segment in Marine Squalene Alternatives in 2025, by End-Use Application: Cosmetics & Personal Care (50.6%)
  • Key Growth Regions in the Marine Squalene Alternatives: North America, Asia-Pacific, Europe
  • Top Key Players in Marine Squalene Alternatives: Amyris, Inc., Croda International Plc, Clariant AG, Sophim S.A., Takasago International Corporation, Nucelis Inc., Arista Industries, Inc., Henry Lamotte Oils GmbH, Kishimoto Special Liver Oil Co., Ltd., EFP Biotek.

Marine Squalene Alternatives Market Key Takeaways
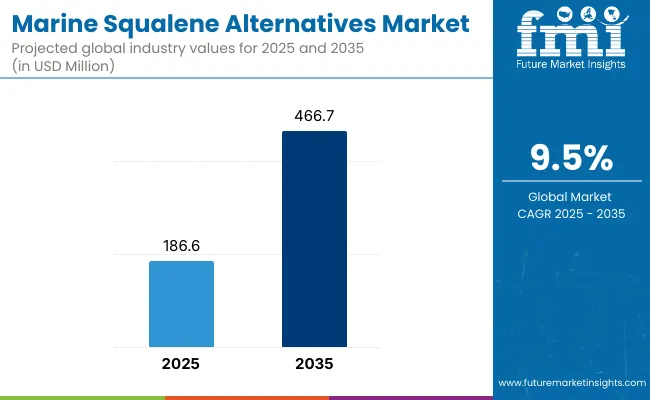
Marine Squalene Alternatives Market

Metric Value
Marine Squalene Alternatives Estimated Value in (2025E) USD 186.6 million
Marine Squalene Alternatives Forecast Value in (2035F) USD 466.7 million
Forecast CAGR (2025 to 2035) 9.5%

During the first half of the decade (2025-2030), the market is expected to expand from USD 186.6 million to nearly USD 295.4 million, adding approximately USD 108.8 million, which accounts for nearly 39% of total decade growth. This early phase is anticipated to be characterized by steady adoption across cosmetics and nutraceuticals, supported by rising consumer preference for cruelty-free and traceable ingredients. Demand is further reinforced by advancements in microbial fermentation and yeast-based pathways, which are projected to enhance cost competitiveness and supply resilience.

The second half of the forecast horizon (2030-2035) is projected to accelerate more strongly, contributing nearly USD 171.3 million around 61% of total growth as the market scales from USD 295.4 million to USD 466.7 million. This acceleration is expected to be underpinned by broader pharmaceutical integration, improved industrial refining of squalane, and greater penetration into functional food applications. Partnerships between biotechnology firms and global consumer goods companies are anticipated to deepen, ensuring both secure supply and innovation leadership.

By 2035, marine squalene alternatives are expected to evolve from niche sustainability substitutes into mainstream bio-based lipid solutions, redefining competitive standards across cosmetic, pharmaceutical, and nutraceutical industries.

From 2020 to 2024, the Marine Squalene Alternatives Market expanded steadily, driven by the growing replacement of shark-derived squalene with bio-based and fermentation-derived alternatives. During this period, cosmetics and personal care applications commanded the majority of demand, supported by consumer advocacy for ethical sourcing and regulatory pressure on marine-derived ingredients. Competitive differentiation was based on purity, traceability, and alignment with sustainability certifications.

By 2025, market value is projected at USD 186.6 million, with momentum shifting toward biotechnology-driven solutions such as synthetic biology and microbial fermentation. By 2035, as the market approaches USD 466.7 million, digital bio-manufacturing, supply chain traceability, and eco-certification are expected to drive adoption. Industry leaders are anticipated to evolve toward hybrid models, combining traditional plant-based oils with scalable biotech platforms, while new entrants specializing in fermentation efficiency and synthetic biology pathways are forecasted to capture rising shares. Competitive advantage is projected to move from raw material access to innovation ecosystems, intellectual property, and sustainability-driven branding.

Why the Marine Squalene Alternatives Market is growing?

The growth of the Marine Squalene Alternatives Market is being driven by a confluence of sustainability imperatives, ethical sourcing requirements, and evolving consumer expectations. Increasing restrictions on shark-derived squalene have reinforced the urgency for sustainable substitutes, with regulatory pressures aligning closely with consumer advocacy for cruelty-free and traceable ingredients. Strong policy backing in Europe and East Asia is expected to further accelerate adoption across industries.

Advances in biotechnology, particularly microbial and yeast-based fermentation, are being leveraged to enhance scalability and cost efficiency. Synthetic biology is anticipated to play a transformative role by enabling consistent, high-purity outputs that reduce dependency on natural variability. These innovations are allowing manufacturers to secure competitive advantages by aligning environmental stewardship with economic viability.

End-use demand is being amplified by cosmetics and personal care manufacturers, who are under increasing scrutiny to demonstrate clean-label and ethical sourcing practices. Pharmaceutical and nutraceutical sectors are also expected to expand usage, owing to the functional health benefits and high stability of squalane derivatives. Collaborative partnerships between biotech firms and global consumer goods companies are reinforcing supply security while accelerating commercial-scale adoption.

As sustainability commitments deepen and biotechnology advances mature, market growth is projected to strengthen further, positioning marine squalene alternatives as a mainstream bio-based lipid solution in the decade ahead.

Segmental Analysis

The Marine Squalene Alternatives Market has been segmented across product type, end-use application, and purity grade, reflecting the structural dynamics shaping its growth trajectory. By product type, diversification across plant oils, microbial fermentation, yeast-based pathways, and synthetic biology underscores the transition from traditional to next-generation sustainable sources. Each pathway offers distinct cost, scalability, and purity advantages, making the competitive landscape highly innovation-driven. In terms of end-use application, adoption is being accelerated by cosmetics and personal care, pharmaceuticals, nutraceuticals, food and beverages, and industrial sectors. Each vertical demonstrates unique demand patterns, with sustainability, traceability, and performance emerging as unifying growth drivers. Purity grades further define the market’s evolution, with cosmetic, pharmaceutical/GMP, and food/nutraceutical grades aligning with regulatory requirements and consumer trust. The interplay of these segments indicates that innovation in biotechnology and rising ethical standards are projected to redefine adoption curves across all categories over the forecast period.
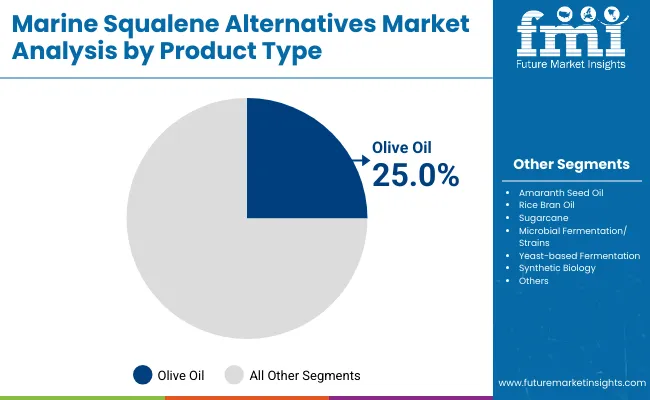
Insights into the Product Type Segment with Olive oil leading in Market Share

Marine Squalene Alternatives Market By Product Type

Product Type Segment Market Value Share, 2025
Olive oil 25.0%
Amaranth seed oil 15.0%

Olive oil-derived squalene alternatives are projected to command the largest share at 25% in 2025, underpinned by established supply chains and consumer familiarity with plant-derived ingredients. While traditional oils retain dominance, the fastest growth is expected from synthetic biology and yeast-based fermentation, driven by precision scalability and reduced agricultural dependency. Microbial strains are anticipated to strengthen mid-term competitiveness by offering stable yields under controlled environments. Collectively, the product type landscape is forecasted to evolve from reliance on agricultural crops toward biotechnology-led solutions. Strategic integration of plant oils with fermentation-based pathways is expected to create hybrid models, ensuring both cost efficiency and supply security. As regulatory scrutiny heightens, product differentiation based on sustainability credentials and traceability is likely to emerge as a defining advantage across all product categories.
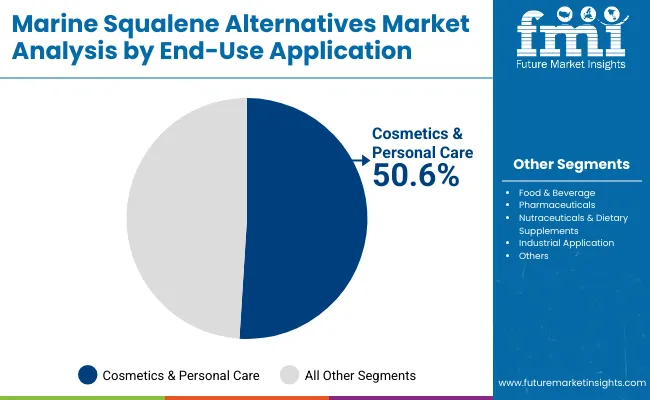
Insights into the End-Use Application Segment with Cosmetics & Personal Care Dominating the Demand

Marine Squalene Alternatives Market End Use Application

End-Use Application 2025 Share%
Cosmetics & Personal Care 50.6%
Food & beverage 14.5%
Pharmaceuticals 12.0%

Cosmetics and personal care are projected to dominate demand with a 50.6% market share in 2025, driven by the global transition toward cruelty-free, ethical, and sustainable formulations. Brands are increasingly adopting marine squalene alternatives to align with clean-label standards and consumer transparency expectations. The pharmaceutical and nutraceutical sectors are expected to expand adoption at higher CAGRs, supported by bioactive properties and GMP-grade innovations. Food and beverage applications are anticipated to grow steadily as lipid-based fortification gains relevance. Industrial use, though smaller, is projected to rise at the fastest pace due to the demand for bio-based lubricants and specialty applications. This multi-sector integration highlights the versatility of squalene alternatives. By 2035, cosmetics are expected to retain leadership, but pharmaceuticals and industrial applications are anticipated to drive incremental volume growth, diversifying the end-use footprint of the market.
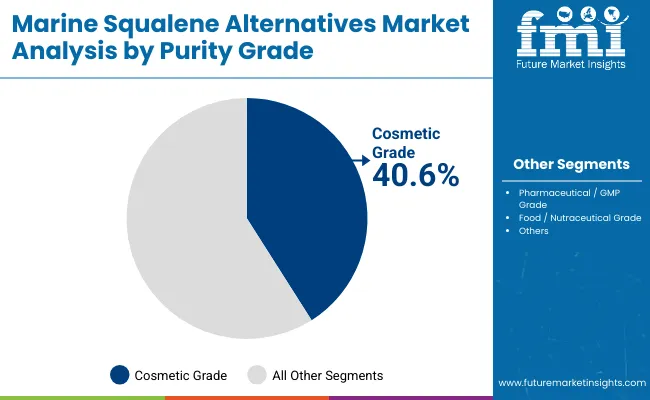
Insights into the Purity Grade Segment with Focus on Cosmetic Grade

Marine Squalene Alternatives Market Purity Grade

Purity Grade 2025 Share%
Cosmetic Grade 40.6%
Pharmaceutical / GMP Grade 34.2%
Food / Nutraceutical Grade 25.2%

Cosmetic-grade squalene alternatives are expected to remain the dominant category with a 40.6% share in 2025, reflecting their widespread adoption in skincare, haircare, and personal care formulations. This dominance is supported by performance attributes such as emolliency, stability, and consumer preference for natural alternatives. Pharmaceutical/GMP-grade products are anticipated to post strong growth, fueled by clinical validation, stringent quality requirements, and expansion into high-value therapeutic formulations. Food and nutraceutical-grade squalene is projected to grow steadily, with demand driven by dietary supplements and functional foods. The interplay of grades demonstrates how regulatory compliance and quality assurance will remain central to market expansion. As manufacturing capabilities advance, higher-purity formulations are expected to gain traction, reshaping competitive differentiation. Cosmetic grade will continue to hold leadership, yet pharmaceutical and nutraceutical adoption will be pivotal in diversifying long-term growth avenues.

What are the Drivers, Restraints, and Key Trends of the Marine Squalene Alternatives Market?

The Marine Squalene Alternatives Market is being shaped by sustainability imperatives, biotechnology innovations, and rising ethical sourcing demands. While opportunities are expanding across cosmetics, pharmaceuticals, and nutraceuticals, challenges remain in scaling production and achieving cost parity. Regulatory support and consumer-driven sustainability goals are projected to reinforce long-term adoption, positioning the market as a transformative bio-based lipid segment.

Ethical Sourcing and Sustainability Imperatives

Market growth is being propelled by escalating demand for ethical and sustainable ingredients. Heightened restrictions on shark-derived squalene, combined with consumer advocacy for cruelty-free sourcing, are expected to accelerate the adoption of plant, microbial, and synthetic biology-derived alternatives. Companies are projected to leverage sustainability certifications and traceability mechanisms to strengthen brand value. This shift is anticipated to transform marine squalene alternatives from niche substitutes into mainstream bio-based lipid solutions, creating lasting demand across personal care, pharmaceutical, and nutraceutical applications. Regulatory reinforcement and industry sustainability commitments are likely to amplify this driver over the forecast horizon, ensuring long-term market expansion.

Biotechnology-led Transformation through Fermentation Pathways

A major trend reshaping the market is the integration of microbial and yeast-based fermentation as scalable production models. Synthetic biology innovations are being deployed to deliver higher-purity squalane with predictable yields, reducing dependency on agricultural variability. This trend is expected to diversify the supply chain while lowering long-term costs, strengthening competitiveness against conventional oils. Strategic alliances between biotechnology firms and downstream manufacturers are projected to accelerate commercialization, embedding these alternatives into global cosmetic and pharmaceutical formulations. As fermentation efficiency improves, marine squalene alternatives are anticipated to evolve into a benchmark for innovation-driven sustainability within the global bio-ingredients industry.
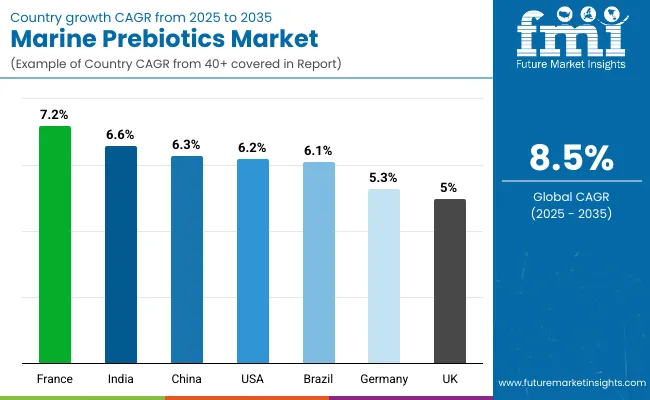
Analysis of Marine Squalene Alternatives Market by Key Countries

Country Marine Squalene Alternatives Market

Country CAGR (2025 to 2035)
China 6.3%
India 6.6%
Germany 5.3%
France 7.2%
UK 5.0%
USA 6.2%
Brazil 6.1%

The Marine Squalene Alternatives Market demonstrates varied growth trajectories across key countries, shaped by regulatory frameworks, biotechnology investments, and consumer-driven sustainability expectations. In Asia, China is projected to grow at a 6.3% CAGR, supported by strong cosmetics and nutraceutical demand, alongside rapid advances in fermentation-based production. India, with a 6.6% CAGR, is expected to accelerate adoption due to expanding pharmaceutical manufacturing and growing investments in plant-based and synthetic biology platforms.

Europe remains a strategic growth hub, reinforced by stringent sustainability mandates and ethical sourcing regulations. France leads regional momentum with a 7.2% CAGR, driven by its strong cosmetics sector and proactive policies on green chemistry. Germany, advancing at 5.3% CAGR, is expected to integrate alternatives more gradually, with adoption tied to industrial applications and pharmaceutical-grade formulations. The UK, at 5.0% CAGR, reflects steady but conservative uptake, largely influenced by personal care innovations and supply chain shifts post-Brexit.

North America shows a moderate but steady profile, with the USA expanding at 6.2% CAGR, underpinned by biotechnology R&D, dietary supplement growth, and alignment with FDA quality standards. In Latin America, Brazil, at 6.1% CAGR, is projected to emerge as a regional growth engine, supported by expanding cosmetics and food supplement industries and an increasing focus on bio-based ingredients.
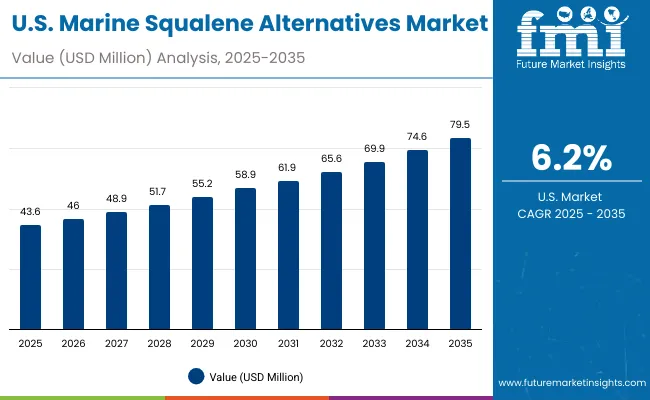
Sales Outlook for Marine Squalene Alternatives in the United States

Usa Marine Squalene Alternatives Market

Year USA Marine Squalene Alternatives Market (USD Million)
2025 43.6
2026 46.0
2027 48.9
2028 51.7
2029 55.2
2030 58.9
2031 61.9
2032 65.6
2033 69.9
2034 74.6
2035 79.5

The Marine Squalene Alternatives Market in the United States is projected to expand at a 6.1% CAGR between 2025 and 2035, reflecting a steady transition toward sustainable and traceable lipid solutions. Growth is being reinforced by strong consumer demand for cruelty-free cosmetics, FDA-compliant pharmaceutical innovations, and the rising popularity of nutraceutical formulations.

Personal care brands are expected to remain key adopters, with bio-based squalane increasingly integrated into skincare and haircare product lines. Pharmaceutical manufacturers are anticipated to accelerate uptake of GMP-grade squalene for therapeutic applications, ensuring alignment with stringent quality standards. Nutraceuticals and functional foods are also projected to expand their share, driven by consumer preference for natural bioactives.

Partnerships between biotechnology innovators and USA-based consumer goods companies are likely to strengthen supply chain security and drive early commercialization of synthetic biology-derived alternatives. Industrial applications, though smaller in scale, are projected to gain momentum through the adoption of bio-based lubricants and specialty formulations.

  • Cosmetics and personal care adoption is projected to remain the dominant growth driver.
  • Pharmaceutical-grade squalene alternatives are anticipated to accelerate due to FDA-aligned quality requirements.

Growth and Expansion Outlook for Marine Squalene Alternatives Market in the United Kingdom

The Marine Squalene Alternatives Market in the UK is projected to grow at a 5.0% CAGR from 2025 to 2035, reflecting steady but measured adoption. Growth is being driven by increasing demand for sustainable cosmetics and the premiumization of personal care brands. Pharmaceutical applications are expanding more slowly but remain supported by regulatory alignment with EU-derived standards. Nutraceutical usage is expected to benefit from heightened consumer health awareness, while industrial adoption remains limited. As supply chain resilience becomes a focus post-Brexit, domestic partnerships with biotechnology innovators are anticipated to gain momentum.

  • Sustainable cosmetics are expected to anchor demand.
  • Nutraceuticals projected to benefit from clean-label preferences.
  • Regulatory frameworks to sustain GMP-grade adoption.
  • Post-Brexit supply security to drive biotech collaborations.

Growth and Expansion Outlook for Marine Squalene Alternatives in China

The Marine Squalene Alternatives Market in China is expected to grow at a 6.3% CAGR, driven by the strong presence of domestic cosmetics and nutraceutical manufacturers. Rapid regulatory alignment with sustainability and green chemistry initiatives is reinforcing adoption. Pharmaceutical uptake is anticipated to increase as domestic companies scale GMP-grade production for both local and export markets. Biotechnology-led production, particularly fermentation and synthetic biology, is projected to expand as government-backed investments strengthen the innovation ecosystem. Rising consumer emphasis on traceability and safety is likely to boost demand across premium product categories.

  • Cosmetics and nutraceuticals to dominate near-term growth.
  • Regulatory frameworks expected to accelerate sustainable sourcing.
  • Biotechnology investments projected to secure scalability.
  • GMP-grade squalene to support domestic and export demand.

Sales Outlook for Marine Squalene Alternatives in India

The Marine Squalene Alternatives Market in India is forecasted to expand at a 6.6% CAGR, supported by a rapidly growing pharmaceutical manufacturing sector and rising consumer awareness of plant-based and cruelty-free products. Nutraceutical adoption is expected to accelerate as urban populations prioritize preventive health. Cosmetics and personal care adoption remains concentrated in premium categories but is projected to expand with the growth of e-commerce distribution. Biotechnology-driven production models are likely to gain traction as domestic players invest in fermentation-based and synthetic biology pathways. India’s role as an export hub is also anticipated to strengthen adoption of GMP-grade squalene alternatives.
  • Pharmaceutical production expansion is projected to drive uptake.
  • Nutraceuticals to grow with rising health-conscious consumer base.
  • E-commerce to widen cosmetics adoption.
  • Export orientation to strengthen GMP-grade demand.

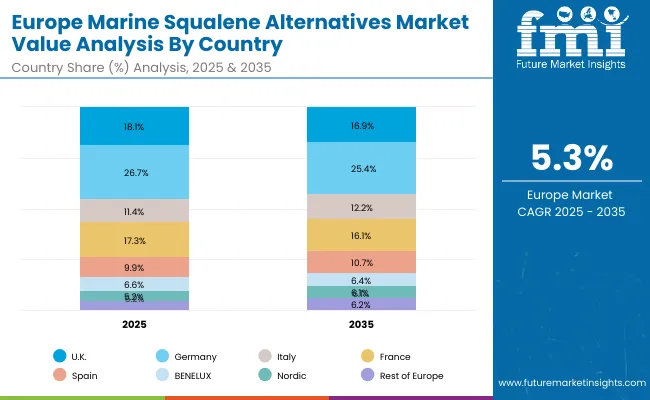
In-depth Analysis of Marine Squalene Alternatives in Germany

Europe Marine Squalene Alternatives Market

Country 2025
UK 18.1%
Germany 26.7%
Italy 11.4%
France 17.3%
Spain 9.9%
BENELUX 6.6%
Nordic 5.2%
Rest of Europe 4.8%
Country 2035
UK 16.9%
Germany 25.4%
Italy 12.2%
France 16.1%
Spain 10.7%
BENELUX 6.4%
Nordic 6.1%
Rest of Europe 6.2%

The Marine Squalene Alternatives Market in Germany is projected to grow at a 5.3% CAGR, reflecting steady uptake across cosmetics, pharmaceuticals, and industrial applications. Stringent sustainability regulations and strong consumer preference for eco-certified products are driving cosmetics adoption. Pharmaceutical usage is expanding, supported by Germany’s leadership in clinical research and compliance with GMP standards. Industrial applications, though smaller in value, are projected to benefit from the country’s strong bioeconomy agenda. Partnerships between domestic biotech startups and European consumer goods majors are expected to secure innovation-led adoption. By 2035, Germany is anticipated to remain a key European anchor market for high-quality squalene alternatives.
  • Cosmetics growth reinforced by eco-certification requirements.
  • Pharmaceuticals adoption tied to GMP compliance and R&D.
  • Bioeconomy agenda projected to fuel industrial demand.
  • Domestic biotech partnerships expected to shape innovation.

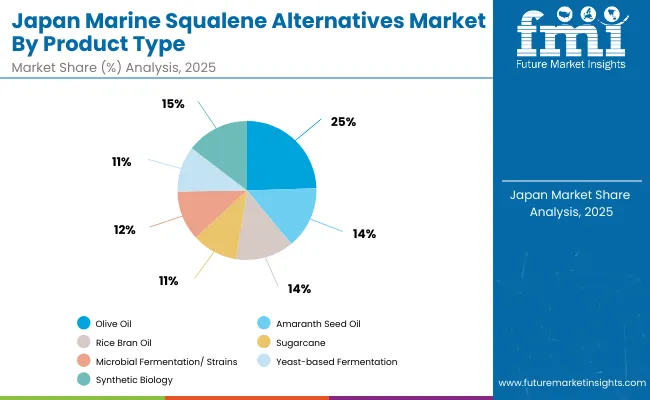
Growth Outlook for Marine Squalene Alternatives in Japan

Japan Marine Squalene Alternatives Market

Product Type Market Value Share, 2025
Olive oil 24.5%
Amaranth seed oil 14.5%
Rice bran oil 13.5%
Sugarcane 10.7%
Microbial fermentation/ Strains 11.6%
Yeast-based fermentation 10.6%
Synthetic biology 14.6%

The Marine Squalene Alternatives Market in Japan is projected to achieve a significant share in 2025, reflecting a strong domestic emphasis on sustainable innovation. Olive oil remains the leading category at 24.5%, supported by established sourcing channels and consumer trust in plant-derived ingredients. However, synthetic biology, at 14.6%, is emerging as the most dynamic pathway, reflecting Japan’s deep investment in precision fermentation and advanced biotechnology platforms.

Microbial and yeast-based solutions, collectively accounting for more than 22%, demonstrate rising acceptance as scalable and reliable sources that align with the nation’s focus on high-purity, traceable ingredients for cosmetics and pharmaceuticals. Amaranth and rice bran oils provide continuity from traditional supply chains but are gradually being complemented by biotech-led innovations. This blend of traditional and advanced approaches is anticipated to define Japan’s growth outlook.
  • Japan is expected to contribute a notable share to the global market in 2025.
  • Olive oil leads initially, but synthetic biology emerges as the fastest-growing pathway.
  • Biotechnology adoption reflects Japan’s precision-driven R&D ecosystem.
  • High-purity fermentation products projected to support cosmetics and pharmaceutical demand.

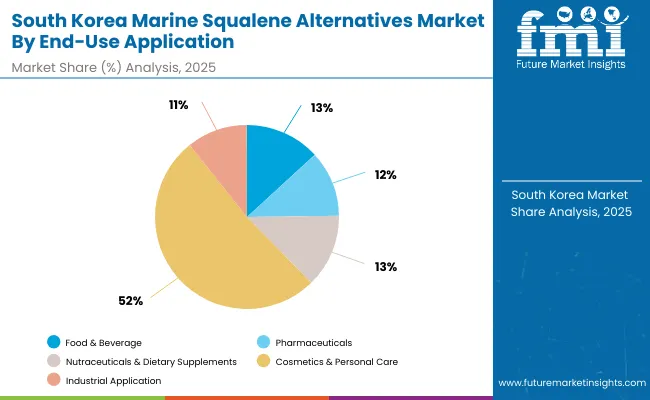
Opportunity Analysis of South Korea Marine Squalene Alternatives Market

South Korea Marine Squalene Alternatives Market

End-Use Application Market Value Share, 2025
Food & beverage 13.2%
Pharmaceuticals 11.6%
Nutraceuticals & Dietary Supplements 12.9%
Cosmetics & Personal Care 51.6%
Industrial Application 10.7%

The Marine Squalene Alternatives Market in South Korea is projected to achieve strong growth, anchored by the dominance of cosmetics and personal care, which account for 51.6% of market share in 2025. This leadership is being reinforced by South Korea’s global reputation as a hub for skincare and K-beauty innovation, where bio-based and cruelty-free formulations are becoming essential to competitiveness.

Pharmaceutical and nutraceutical applications are expected to expand steadily, with market shares of 11.6% and 12.9%, supported by the nation’s advanced healthcare infrastructure and rising consumer awareness of preventive wellness. Food and beverage usage, while smaller in scale, reflects opportunities in functional fortification and clean-label ingredients. Industrial applications, projected at the fastest CAGR of 8.5%, are anticipated to grow through bio-based lubricants and specialty chemical innovations.
  • Cosmetics and personal care adoption is projected to remain the dominant driver.
  • Nutraceuticals expected to grow rapidly with rising wellness culture.
  • Industrial use to expand fastest, reflecting bio-based innovation trends.
  • Pharmaceuticals supported by South Korea’s strong clinical and healthcare ecosystem.

Competitive Landscape of Marine Squalene Alternatives Market

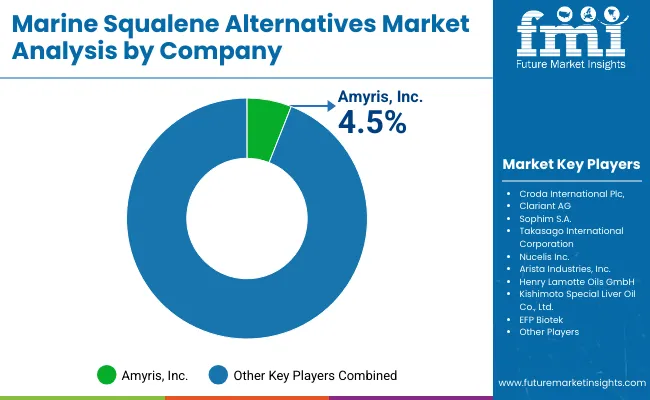
Marine Squalene Alternatives Market By Company

Company Global Value Share 2025
Amyris, Inc. 4 .5%
Others 95 .5%

The Marine Squalene Alternatives Market is moderately fragmented, with global leaders, biotechnology innovators, and niche-focused suppliers competing across diverse applications. Established players such as Croda International Plc, Clariant AG, and Takasago International Corporation are positioned as global leaders, leveraging extensive portfolios in specialty chemicals and sustainable ingredients. Their strategies are being directed toward biotechnology integration, high-purity squalane formulations, and partnerships with multinational cosmetics and pharmaceutical brands.

Mid-sized innovators, including Amyris, Inc., Sophim S.A., and Nucelis Inc., are advancing through synthetic biology, yeast-based fermentation, and precision biotechnology platforms. These companies are increasingly differentiating themselves by offering scalable, traceable, and ethically sourced alternatives that directly address the limitations of shark-derived squalene. Their focus on intellectual property and collaborative commercialization is expected to strengthen competitive positioning.

Niche suppliers such as Kishimoto Special Liver Oil Co., Arista Industries, Henry Lamotte Oils GmbH, and EFP Biotek are contributing through specialized sourcing, tailored formulations, and region-specific distribution networks. Their strength lies in supplying cost-effective, application-focused solutions for smaller cosmetics, nutraceutical, and food manufacturers.

Competitive differentiation is projected to shift from raw material substitution toward integrated solutions emphasizing biotechnology innovation, regulatory compliance, and sustainability certifications. The long-term competitive edge is expected to be defined by supply security, purity standards, and alignment with ethical sourcing mandates.

Key Developments in Marine Squalene Alternatives Market

  • In May 2025, Amyris completed full ownership of its Barra Bonita (Brazil) precision-fermentation plant. This move is being leveraged to streamline production, accelerate decision-making, and scale its specialty ingredient pipeline. A fourth fermentation line is expected to come online in early 2026, nearly doubling capacity.
  • In 2024, Croda launched an innovative pharmaceutical-grade squalene engineered through synthetic biology, offering a non-shark derived alternative with superior purity. This development has been positioned to meet vaccine adjuvant demands and regulatory requirements, reinforcing the trend toward biotech-led sourcing in high-value applications.

Scope of the Report

Item Value
Quantitative Units USD 186.6 million
Product Type Olive oil, Amaranth seed oil, Rice bran oil, Sugarcane, Microbial fermentation/Strains, Yeast-based fermentation, Synthetic biology
Form Squalene (pure compound), Squalane (hydrogenated, stabilized form)
Purity Grade Cosmetic Grade, Pharmaceutical/GMP Grade, Food/Nutraceutical Grade
End-Use Application Food & Beverage, Pharmaceuticals, Nutraceuticals & Dietary Supplements, Cosmetics & Personal Care, Industrial Applications
Regions Covered North America, Europe, Asia-Pacific, Latin America, Middle East & Africa
Country Covered United States, Canada, Germany, France, United Kingdom, China, Japan, India, Brazil, South Africa
Key Companies Profiled Amyris, Inc., Croda International Plc, Clariant AG, Sophim S.A., Takasago International Corporation, Nucelis Inc., Arista Industries, Inc., Henry Lamotte Oils GmbH, Kishimoto Special Liver Oil Co., Ltd., EFP Biotek
Additional Attributes Market dollar sales by product type, form, and end-use application; adoption trends in cosmetics, nutraceuticals, and pharmaceuticals; rising demand for synthetic biology and microbial fermentation; regulatory and sustainability drivers across Europe and East Asia; strategic collaborations between biotech innovators and consumer goods companies; increasing competitiveness based on purity, traceability, and eco-certification; regional variations in adoption driven by ethical sourcing and consumer awareness.

Key Segmentation

By Product Type:

  • Olive oil
  • Amaranth seed oil
  • Rice bran oil
  • Sugarcane
  • Microbial fermentation/ Strains
  • Yeast-based fermentation
  • Synthetic biology

By Form:

  • Squalene (pure compound)
  • Squalane (hydrogenated, stabilized form)

By Purity Grade:

  • Cosmetic Grade
  • Pharmaceutical / GMP Grade
  • Food / Nutraceutical Grade

By End-Use Application:

  • Food & beverage
  • Pharmaceuticals
  • Nutraceuticals & Dietary Supplements
  • Cosmetics & Personal Care
  • Industrial Application

By Region:

  • North America
  • Latin America
  • Europe
  • East Asia
  • South Asia & Pacific
  • MEA

Table of Content

  1. Executive Summary
    • Global Market Outlook
    • Demand-side Trends
    • Supply-side Trends
    • Technology Roadmap Analysis
    • Analysis and Recommendations
  2. Market Overview
    • Market Coverage / Taxonomy
    • Market Definition / Scope / Limitations
  3. Market Background
    • Market Dynamics
      • Drivers
      • Restraints
      • Opportunity
      • Trends
    • Scenario Forecast
      • Demand in Optimistic Scenario
      • Demand in Likely Scenario
      • Demand in Conservative Scenario
    • Opportunity Map Analysis
    • Product Life Cycle Analysis
    • Supply Chain Analysis
    • Investment Feasibility Matrix
    • Value Chain Analysis
    • PESTLE and Porter’s Analysis
    • Regulatory Landscape
    • Regional Parent Market Outlook
    • Production and Consumption Statistics
    • Import and Export Statistics
  4. Global Market Analysis 2020 to 2024 and Forecast, 2025 to 2035
    • Historical Market Size Value (USD Million) & Volume (MT) Analysis, 2020 to 2024
    • Current and Future Market Size Value (USD Million) & Volume (MT) Projections, 2025 to 2035
      • Y-o-Y Growth Trend Analysis
      • Absolute $ Opportunity Analysis
  5. Global Market Pricing Analysis 2020 to 2024 and Forecast 2025 to 2035
  6. Global Market Analysis 2020 to 2024 and Forecast 2025 to 2035, By Product Type
    • Introduction / Key Findings
    • Historical Market Size Value (USD Million) & Volume (MT) Analysis By Product Type, 2020 to 2024
    • Current and Future Market Size Value (USD Million) & Volume (MT) Analysis and Forecast By Product Type, 2025 to 2035
      • Olive oil
      • Amaranth seed oil
      • Rice bran oil
      • Sugarcane
      • Microbial fermentation/ Strains
      • Yeast-based fermentation
      • Synthetic biology
    • Y-o-Y Growth Trend Analysis By Product Type, 2020 to 2024
    • Absolute $ Opportunity Analysis By Product Type, 2025 to 2035
  7. Global Market Analysis 2020 to 2024 and Forecast 2025 to 2035, By Form
    • Introduction / Key Findings
    • Historical Market Size Value (USD Million) & Volume (MT) Analysis By Form, 2020 to 2024
    • Current and Future Market Size Value (USD Million) & Volume (MT) Analysis and Forecast By Form, 2025 to 2035
      • Squalene (pure compound)
      • Squalane (hydrogenated, stabilized form)
    • Y-o-Y Growth Trend Analysis By Form, 2020 to 2024
    • Absolute $ Opportunity Analysis By Form, 2025 to 2035
  8. Global Market Analysis 2020 to 2024 and Forecast 2025 to 2035, By Purity Grade
    • Introduction / Key Findings
    • Historical Market Size Value (USD Million) & Volume (MT) Analysis By Purity Grade, 2020 to 2024
    • Current and Future Market Size Value (USD Million) & Volume (MT) Analysis and Forecast By Purity Grade, 2025 to 2035
      • Cosmetic Grade
      • Pharmaceutical / GMP Grade
      • Food / Nutraceutical Grade
    • Y-o-Y Growth Trend Analysis By Purity Grade, 2020 to 2024
    • Absolute $ Opportunity Analysis By Purity Grade, 2025 to 2035
  9. Global Market Analysis 2020 to 2024 and Forecast 2025 to 2035, By End-Use Application
    • Introduction / Key Findings
    • Historical Market Size Value (USD Million) & Volume (MT) Analysis By End-Use Application, 2020 to 2024
    • Current and Future Market Size Value (USD Million) & Volume (MT) Analysis and Forecast By End-Use Application, 2025 to 2035
      • Food & beverage
      • Pharmaceuticals
      • Nutraceuticals & Dietary Supplements
      • Cosmetics & Personal Care
      • Industrial Application
    • Y-o-Y Growth Trend Analysis By End-Use Application, 2020 to 2024
    • Absolute $ Opportunity Analysis By End-Use Application, 2025 to 2035
  10. Global Market Analysis 2020 to 2024 and Forecast 2025 to 2035, By Region
    • Introduction
    • Historical Market Size Value (USD Million) & Volume (MT) Analysis By Region, 2020 to 2024
    • Current Market Size Value (USD Million) & Volume (MT) Analysis and Forecast By Region, 2025 to 2035
      • North America
      • Latin America
      • Europe
      • East Asia
      • South Asia & Pacific
      • MEA
    • Market Attractiveness Analysis By Region
  11. North America Market Analysis 2020 to 2024 and Forecast 2025 to 2035, By Country
    • Historical Market Size Value (USD Million) & Volume (MT) Trend Analysis By Market Taxonomy, 2020 to 2024
    • Market Size Value (USD Million) & Volume (MT) Forecast By Market Taxonomy, 2025 to 2035
      • By Country
        • U.S.
        • Canada
      • By Product Type
      • By Form
      • By Purity Grade
      • By End-Use Application
    • Market Attractiveness Analysis
      • By Country
      • By Product Type
      • By Form
      • By Purity Grade
      • By End-Use Application
    • Key Takeaways
  12. Latin America Market Analysis 2020 to 2024 and Forecast 2025 to 2035, By Country
    • Historical Market Size Value (USD Million) & Volume (MT) Trend Analysis By Market Taxonomy, 2020 to 2024
    • Market Size Value (USD Million) & Volume (MT) Forecast By Market Taxonomy, 2025 to 2035
      • By Country
        • Brazil
        • Mexico
        • Colombia
        • Rest of Latin America
      • By Product Type
      • By Form
      • By Purity Grade
      • By End-Use Application
    • Market Attractiveness Analysis
      • By Country
      • By Product Type
      • By Form
      • By Purity Grade
      • By End-Use Application
    • Key Takeaways
  13. Europe Market Analysis 2020 to 2024 and Forecast 2025 to 2035, By Country
    • Historical Market Size Value (USD Million) & Volume (MT) Trend Analysis By Market Taxonomy, 2020 to 2024
    • Market Size Value (USD Million) & Volume (MT) Forecast By Market Taxonomy, 2025 to 2035
      • By Country
        • Germany
        • U.K.
        • France
        • Italy
        • Spain
        • Belgium
        • Netherlands
        • Nordic
        • Switzerland
        • Russia
        • Poland
        • Rest of Europe
      • By Product Type
      • By Form
      • By Purity Grade
      • By End-Use Application
    • Market Attractiveness Analysis
      • By Country
      • By Product Type
      • By Form
      • By Purity Grade
      • By End-Use Application
    • Key Takeaways
  14. East Asia Market Analysis 2020 to 2024 and Forecast 2025 to 2035, By Country
    • Historical Market Size Value (USD Million) & Volume (MT) Trend Analysis By Market Taxonomy, 2020 to 2024
    • Market Size Value (USD Million) & Volume (MT) Forecast By Market Taxonomy, 2025 to 2035
      • By Country
        • China
        • Japan
        • South Korea
      • By Product Type
      • By Form
      • By Purity Grade
      • By End-Use Application
    • Market Attractiveness Analysis
      • By Country
      • By Product Type
      • By Form
      • By Purity Grade
      • By End-Use Application
    • Key Takeaways
  15. South Asia & Pacific Market Analysis 2020 to 2024 and Forecast 2025 to 2035, By Country
    • Historical Market Size Value (USD Million) & Volume (MT) Trend Analysis By Market Taxonomy, 2020 to 2024
    • Market Size Value (USD Million) & Volume (MT) Forecast By Market Taxonomy, 2025 to 2035
      • By Country
        • India
        • Thailand
        • Malaysia
        • Indonesia
        • Singapore
        • Vietnam
        • Australia
        • New Zealand
        • Rest of South Asia & Pacific
      • By Product Type
      • By Form
      • By Purity Grade
      • By End-Use Application
    • Market Attractiveness Analysis
      • By Country
      • By Product Type
      • By Form
      • By Purity Grade
      • By End-Use Application
    • Key Takeaways
  16. MEA Market Analysis 2020 to 2024 and Forecast 2025 to 2035, By Country
    • Historical Market Size Value (USD Million) & Volume (MT) Trend Analysis By Market Taxonomy, 2020 to 2024
    • Market Size Value (USD Million) & Volume (MT) Forecast By Market Taxonomy, 2025 to 2035
      • By Country
        • Turkey
        • UAE
        • Saudi Arabia
        • Israel
        • Other GCC Countries
        • North Africa
        • South Africa
        • Central Africa
      • By Product Type
      • By Form
      • By Purity Grade
      • By End-Use Application
    • Market Attractiveness Analysis
      • By Country
      • By Product Type
      • By Form
      • By Purity Grade
      • By End-Use Application
    • Key Takeaways
  17. Key Countries Market Analysis
    • U.S.
      • Pricing Analysis
      • Market Share Analysis, 2024
        • By Product Type
        • By Form
        • By Purity Grade
        • By End-Use Application
    • Canada
      • Pricing Analysis
      • Market Share Analysis, 2024
        • By Product Type
        • By Form
        • By Purity Grade
        • By End-Use Application
    • Brazil
      • Pricing Analysis
      • Market Share Analysis, 2024
        • By Product Type
        • By Form
        • By Purity Grade
        • By End-Use Application
    • Mexico
      • Pricing Analysis
      • Market Share Analysis, 2024
        • By Product Type
        • By Form
        • By Purity Grade
        • By End-Use Application
    • Colombia
      • Pricing Analysis
      • Market Share Analysis, 2024
        • By Product Type
        • By Form
        • By Purity Grade
        • By End-Use Application
    • Germany
      • Pricing Analysis
      • Market Share Analysis, 2024
        • By Product Type
        • By Form
        • By Purity Grade
        • By End-Use Application
    • U.K.
      • Pricing Analysis
      • Market Share Analysis, 2024
        • By Product Type
        • By Form
        • By Purity Grade
        • By End-Use Application
    • France
      • Pricing Analysis
      • Market Share Analysis, 2024
        • By Product Type
        • By Form
        • By Purity Grade
        • By End-Use Application
    • Italy
      • Pricing Analysis
      • Market Share Analysis, 2024
        • By Product Type
        • By Form
        • By Purity Grade
        • By End-Use Application
    • Spain
      • Pricing Analysis
      • Market Share Analysis, 2024
        • By Product Type
        • By Form
        • By Purity Grade
        • By End-Use Application
    • Belgium
      • Pricing Analysis
      • Market Share Analysis, 2024
        • By Product Type
        • By Form
        • By Purity Grade
        • By End-Use Application
    • Netherlands
      • Pricing Analysis
      • Market Share Analysis, 2024
        • By Product Type
        • By Form
        • By Purity Grade
        • By End-Use Application
    • Nordic
      • Pricing Analysis
      • Market Share Analysis, 2024
        • By Product Type
        • By Form
        • By Purity Grade
        • By End-Use Application
    • Switzerland
      • Pricing Analysis
      • Market Share Analysis, 2024
        • By Product Type
        • By Form
        • By Purity Grade
        • By End-Use Application
    • Russia
      • Pricing Analysis
      • Market Share Analysis, 2024
        • By Product Type
        • By Form
        • By Purity Grade
        • By End-Use Application
    • Poland
      • Pricing Analysis
      • Market Share Analysis, 2024
        • By Product Type
        • By Form
        • By Purity Grade
        • By End-Use Application
    • China
      • Pricing Analysis
      • Market Share Analysis, 2024
        • By Product Type
        • By Form
        • By Purity Grade
        • By End-Use Application
    • Japan
      • Pricing Analysis
      • Market Share Analysis, 2024
        • By Product Type
        • By Form
        • By Purity Grade
        • By End-Use Application
    • South Korea
      • Pricing Analysis
      • Market Share Analysis, 2024
        • By Product Type
        • By Form
        • By Purity Grade
        • By End-Use Application
    • India
      • Pricing Analysis
      • Market Share Analysis, 2024
        • By Product Type
        • By Form
        • By Purity Grade
        • By End-Use Application
    • Thailand
      • Pricing Analysis
      • Market Share Analysis, 2024
        • By Product Type
        • By Form
        • By Purity Grade
        • By End-Use Application
    • Indonesia
      • Pricing Analysis
      • Market Share Analysis, 2024
        • By Product Type
        • By Form
        • By Purity Grade
        • By End-Use Application
    • Australia
      • Pricing Analysis
      • Market Share Analysis, 2024
        • By Product Type
        • By Form
        • By Purity Grade
        • By End-Use Application
    • New Zealand
      • Pricing Analysis
      • Market Share Analysis, 2024
        • By Product Type
        • By Form
        • By Purity Grade
        • By End-Use Application
    • Turkey
      • Pricing Analysis
      • Market Share Analysis, 2024
        • By Product Type
        • By Form
        • By Purity Grade
        • By End-Use Application
    • UAE
      • Pricing Analysis
      • Market Share Analysis, 2024
        • By Product Type
        • By Form
        • By Purity Grade
        • By End-Use Application
    • Saudi Arabia
      • Pricing Analysis
      • Market Share Analysis, 2024
        • By Product Type
        • By Form
        • By Purity Grade
        • By End-Use Application
    • Israel
      • Pricing Analysis
      • Market Share Analysis, 2024
        • By Product Type
        • By Form
        • By Purity Grade
        • By End-Use Application
    • North Africa
      • Pricing Analysis
      • Market Share Analysis, 2024
        • By Product Type
        • By Form
        • By Purity Grade
        • By End-Use Application
    • South Africa
      • Pricing Analysis
      • Market Share Analysis, 2024
        • By Product Type
        • By Form
        • By Purity Grade
        • By End-Use Application
  18. Market Structure Analysis
    • Competition Dashboard
    • Competition Benchmarking
    • Market Share Analysis of Top Players
      • By Regional
      • By Product Type
      • By Form
      • By Purity Grade
      • By End-Use Application
  19. Competition Analysis
    • Competition Deep Dive
      • Amyris, Inc.
        • Overview
        • Product Portfolio
        • Profitability by Market Segments (Product Type/Form/Region)
        • Sales Footprint
        • Strategy Overview
        • Kishimoto Special Liver Oil Co., Ltd.
        • Arista Industries, Inc.
        • Sophim S.A.
        • Croda International Plc
        • Nucelis Inc.
        • Clariant AG
        • Henry Lamotte Oils GmbH
        • Takasago International Corporation
        • EFP Biotek
        • Others
    • Assumptions & Acronyms Used
    • Research Methodology

List of Tables

  • Table 1: Global Market Value (USD Million) Forecast by Region, 2020-2035
  • Table 2: Global Market Volume (MT) Forecast by Region, 2020-2035
  • Table 3: Global Market Value (USD Million) Forecast by Product Type, 2020-2035
  • Table 4: Global Market Volume (MT) Forecast by Product Type, 2020-2035
  • Table 5: Global Market Value (USD Million) Forecast by Form, 2020-2035
  • Table 6: Global Market Volume (MT) Forecast by Form, 2020-2035
  • Table 7: Global Market Value (USD Million) Forecast by Purity Grade, 2020-2035
  • Table 8: Global Market Volume (MT) Forecast by Purity Grade, 2020-2035
  • Table 9: Global Market Value (USD Million) Forecast by End-Use Application, 2020-2035
  • Table 10: Global Market Volume (MT) Forecast by End-Use Application, 2020-2035
  • Table 11: North America Market Value (USD Million) Forecast by Country, 2020-2035
  • Table 12: North America Market Volume (MT) Forecast by Country, 2020-2035
  • Table 13: North America Market Value (USD Million) Forecast by Product Type, 2020-2035
  • Table 14: North America Market Volume (MT) Forecast by Product Type, 2020-2035
  • Table 15: North America Market Value (USD Million) Forecast by Form, 2020-2035
  • Table 16: North America Market Volume (MT) Forecast by Form, 2020-2035
  • Table 17: North America Market Value (USD Million) Forecast by Purity Grade, 2020-2035
  • Table 18: North America Market Volume (MT) Forecast by Purity Grade, 2020-2035
  • Table 19: North America Market Value (USD Million) Forecast by End-Use Application, 2020-2035
  • Table 20: North America Market Volume (MT) Forecast by End-Use Application, 2020-2035
  • Table 21: Latin America Market Value (USD Million) Forecast by Country, 2020-2035
  • Table 22: Latin America Market Volume (MT) Forecast by Country, 2020-2035
  • Table 23: Latin America Market Value (USD Million) Forecast by Product Type, 2020-2035
  • Table 24: Latin America Market Volume (MT) Forecast by Product Type, 2020-2035
  • Table 25: Latin America Market Value (USD Million) Forecast by Form, 2020-2035
  • Table 26: Latin America Market Volume (MT) Forecast by Form, 2020-2035
  • Table 27: Latin America Market Value (USD Million) Forecast by Purity Grade, 2020-2035
  • Table 28: Latin America Market Volume (MT) Forecast by Purity Grade, 2020-2035
  • Table 29: Latin America Market Value (USD Million) Forecast by End-Use Application, 2020-2035
  • Table 30: Latin America Market Volume (MT) Forecast by End-Use Application, 2020-2035
  • Table 31: Europe Market Value (USD Million) Forecast by Country, 2020-2035
  • Table 32: Europe Market Volume (MT) Forecast by Country, 2020-2035
  • Table 33: Europe Market Value (USD Million) Forecast by Product Type, 2020-2035
  • Table 34: Europe Market Volume (MT) Forecast by Product Type, 2020-2035
  • Table 35: Europe Market Value (USD Million) Forecast by Form, 2020-2035
  • Table 36: Europe Market Volume (MT) Forecast by Form, 2020-2035
  • Table 37: Europe Market Value (USD Million) Forecast by Purity Grade, 2020-2035
  • Table 38: Europe Market Volume (MT) Forecast by Purity Grade, 2020-2035
  • Table 39: Europe Market Value (USD Million) Forecast by End-Use Application, 2020-2035
  • Table 40: Europe Market Volume (MT) Forecast by End-Use Application, 2020-2035
  • Table 41: East Asia Market Value (USD Million) Forecast by Country, 2020-2035
  • Table 42: East Asia Market Volume (MT) Forecast by Country, 2020-2035
  • Table 43: East Asia Market Value (USD Million) Forecast by Product Type, 2020-2035
  • Table 44: East Asia Market Volume (MT) Forecast by Product Type, 2020-2035
  • Table 45: East Asia Market Value (USD Million) Forecast by Form, 2020-2035
  • Table 46: East Asia Market Volume (MT) Forecast by Form, 2020-2035
  • Table 47: East Asia Market Value (USD Million) Forecast by Purity Grade, 2020-2035
  • Table 48: East Asia Market Volume (MT) Forecast by Purity Grade, 2020-2035
  • Table 49: East Asia Market Value (USD Million) Forecast by End-Use Application, 2020-2035
  • Table 50: East Asia Market Volume (MT) Forecast by End-Use Application, 2020-2035
  • Table 51: South Asia & Pacific Market Value (USD Million) Forecast by Country, 2020-2035
  • Table 52: South Asia & Pacific Market Volume (MT) Forecast by Country, 2020-2035
  • Table 53: South Asia & Pacific Market Value (USD Million) Forecast by Product Type, 2020-2035
  • Table 54: South Asia & Pacific Market Volume (MT) Forecast by Product Type, 2020-2035
  • Table 55: South Asia & Pacific Market Value (USD Million) Forecast by Form, 2020-2035
  • Table 56: South Asia & Pacific Market Volume (MT) Forecast by Form, 2020-2035
  • Table 57: South Asia & Pacific Market Value (USD Million) Forecast by Purity Grade, 2020-2035
  • Table 58: South Asia & Pacific Market Volume (MT) Forecast by Purity Grade, 2020-2035
  • Table 59: South Asia & Pacific Market Value (USD Million) Forecast by End-Use Application, 2020-2035
  • Table 60: South Asia & Pacific Market Volume (MT) Forecast by End-Use Application, 2020-2035
  • Table 61: MEA Market Value (USD Million) Forecast by Country, 2020-2035
  • Table 62: MEA Market Volume (MT) Forecast by Country, 2020-2035
  • Table 63: MEA Market Value (USD Million) Forecast by Product Type, 2020-2035
  • Table 64: MEA Market Volume (MT) Forecast by Product Type, 2020-2035
  • Table 65: MEA Market Value (USD Million) Forecast by Form, 2020-2035
  • Table 66: MEA Market Volume (MT) Forecast by Form, 2020-2035
  • Table 67: MEA Market Value (USD Million) Forecast by Purity Grade, 2020-2035
  • Table 68: MEA Market Volume (MT) Forecast by Purity Grade, 2020-2035
  • Table 69: MEA Market Value (USD Million) Forecast by End-Use Application, 2020-2035
  • Table 70: MEA Market Volume (MT) Forecast by End-Use Application, 2020-2035

List of Figures

  • Figure 1: Global Market Volume (MT) Forecast 2020-2035
  • Figure 2: Global Market Pricing Analysis
  • Figure 3: Global Market Value (USD Million) Forecast 2020-2035
  • Figure 4: Global Market Value Share and BPS Analysis by Product Type, 2025 and 2035
  • Figure 5: Global Market Y-o-Y Growth Comparison by Product Type, 2025-2035
  • Figure 6: Global Market Attractiveness Analysis by Product Type
  • Figure 7: Global Market Value Share and BPS Analysis by Form, 2025 and 2035
  • Figure 8: Global Market Y-o-Y Growth Comparison by Form, 2025-2035
  • Figure 9: Global Market Attractiveness Analysis by Form
  • Figure 10: Global Market Value Share and BPS Analysis by Purity Grade, 2025 and 2035
  • Figure 11: Global Market Y-o-Y Growth Comparison by Purity Grade, 2025-2035
  • Figure 12: Global Market Attractiveness Analysis by Purity Grade
  • Figure 13: Global Market Value Share and BPS Analysis by End-Use Application, 2025 and 2035
  • Figure 14: Global Market Y-o-Y Growth Comparison by End-Use Application, 2025-2035
  • Figure 15: Global Market Attractiveness Analysis by End-Use Application
  • Figure 16: Global Market Value (USD Million) Share and BPS Analysis by Region, 2025 and 2035
  • Figure 17: Global Market Y-o-Y Growth Comparison by Region, 2025-2035
  • Figure 18: Global Market Attractiveness Analysis by Region
  • Figure 19: North America Market Incremental $ Opportunity, 2025-2035
  • Figure 20: Latin America Market Incremental $ Opportunity, 2025-2035
  • Figure 21: Europe Market Incremental $ Opportunity, 2025-2035
  • Figure 22: East Asia Market Incremental $ Opportunity, 2025-2035
  • Figure 23: South Asia & Pacific Market Incremental $ Opportunity, 2025-2035
  • Figure 24: MEA Market Incremental $ Opportunity, 2025-2035
  • Figure 25: North America Market Value Share and BPS Analysis by Country, 2025 and 2035
  • Figure 26: North America Market Value Share and BPS Analysis by Product Type, 2025 and 2035
  • Figure 27: North America Market Y-o-Y Growth Comparison by Product Type, 2025-2035
  • Figure 28: North America Market Attractiveness Analysis by Product Type
  • Figure 29: North America Market Value Share and BPS Analysis by Form, 2025 and 2035
  • Figure 30: North America Market Y-o-Y Growth Comparison by Form, 2025-2035
  • Figure 31: North America Market Attractiveness Analysis by Form
  • Figure 32: North America Market Value Share and BPS Analysis by Purity Grade, 2025 and 2035
  • Figure 33: North America Market Y-o-Y Growth Comparison by Purity Grade, 2025-2035
  • Figure 34: North America Market Attractiveness Analysis by Purity Grade
  • Figure 35: North America Market Value Share and BPS Analysis by End-Use Application, 2025 and 2035
  • Figure 36: North America Market Y-o-Y Growth Comparison by End-Use Application, 2025-2035
  • Figure 37: North America Market Attractiveness Analysis by End-Use Application
  • Figure 38: Latin America Market Value Share and BPS Analysis by Country, 2025 and 2035
  • Figure 39: Latin America Market Value Share and BPS Analysis by Product Type, 2025 and 2035
  • Figure 40: Latin America Market Y-o-Y Growth Comparison by Product Type, 2025-2035
  • Figure 41: Latin America Market Attractiveness Analysis by Product Type
  • Figure 42: Latin America Market Value Share and BPS Analysis by Form, 2025 and 2035
  • Figure 43: Latin America Market Y-o-Y Growth Comparison by Form, 2025-2035
  • Figure 44: Latin America Market Attractiveness Analysis by Form
  • Figure 45: Latin America Market Value Share and BPS Analysis by Purity Grade, 2025 and 2035
  • Figure 46: Latin America Market Y-o-Y Growth Comparison by Purity Grade, 2025-2035
  • Figure 47: Latin America Market Attractiveness Analysis by Purity Grade
  • Figure 48: Latin America Market Value Share and BPS Analysis by End-Use Application, 2025 and 2035
  • Figure 49: Latin America Market Y-o-Y Growth Comparison by End-Use Application, 2025-2035
  • Figure 50: Latin America Market Attractiveness Analysis by End-Use Application
  • Figure 51: Europe Market Value Share and BPS Analysis by Country, 2025 and 2035
  • Figure 52: Europe Market Value Share and BPS Analysis by Product Type, 2025 and 2035
  • Figure 53: Europe Market Y-o-Y Growth Comparison by Product Type, 2025-2035
  • Figure 54: Europe Market Attractiveness Analysis by Product Type
  • Figure 55: Europe Market Value Share and BPS Analysis by Form, 2025 and 2035
  • Figure 56: Europe Market Y-o-Y Growth Comparison by Form, 2025-2035
  • Figure 57: Europe Market Attractiveness Analysis by Form
  • Figure 58: Europe Market Value Share and BPS Analysis by Purity Grade, 2025 and 2035
  • Figure 59: Europe Market Y-o-Y Growth Comparison by Purity Grade, 2025-2035
  • Figure 60: Europe Market Attractiveness Analysis by Purity Grade
  • Figure 61: Europe Market Value Share and BPS Analysis by End-Use Application, 2025 and 2035
  • Figure 62: Europe Market Y-o-Y Growth Comparison by End-Use Application, 2025-2035
  • Figure 63: Europe Market Attractiveness Analysis by End-Use Application
  • Figure 64: East Asia Market Value Share and BPS Analysis by Country, 2025 and 2035
  • Figure 65: East Asia Market Value Share and BPS Analysis by Product Type, 2025 and 2035
  • Figure 66: East Asia Market Y-o-Y Growth Comparison by Product Type, 2025-2035
  • Figure 67: East Asia Market Attractiveness Analysis by Product Type
  • Figure 68: East Asia Market Value Share and BPS Analysis by Form, 2025 and 2035
  • Figure 69: East Asia Market Y-o-Y Growth Comparison by Form, 2025-2035
  • Figure 70: East Asia Market Attractiveness Analysis by Form
  • Figure 71: East Asia Market Value Share and BPS Analysis by Purity Grade, 2025 and 2035
  • Figure 72: East Asia Market Y-o-Y Growth Comparison by Purity Grade, 2025-2035
  • Figure 73: East Asia Market Attractiveness Analysis by Purity Grade
  • Figure 74: East Asia Market Value Share and BPS Analysis by End-Use Application, 2025 and 2035
  • Figure 75: East Asia Market Y-o-Y Growth Comparison by End-Use Application, 2025-2035
  • Figure 76: East Asia Market Attractiveness Analysis by End-Use Application
  • Figure 77: South Asia & Pacific Market Value Share and BPS Analysis by Country, 2025 and 2035
  • Figure 78: South Asia & Pacific Market Value Share and BPS Analysis by Product Type, 2025 and 2035
  • Figure 79: South Asia & Pacific Market Y-o-Y Growth Comparison by Product Type, 2025-2035
  • Figure 80: South Asia & Pacific Market Attractiveness Analysis by Product Type
  • Figure 81: South Asia & Pacific Market Value Share and BPS Analysis by Form, 2025 and 2035
  • Figure 82: South Asia & Pacific Market Y-o-Y Growth Comparison by Form, 2025-2035
  • Figure 83: South Asia & Pacific Market Attractiveness Analysis by Form
  • Figure 84: South Asia & Pacific Market Value Share and BPS Analysis by Purity Grade, 2025 and 2035
  • Figure 85: South Asia & Pacific Market Y-o-Y Growth Comparison by Purity Grade, 2025-2035
  • Figure 86: South Asia & Pacific Market Attractiveness Analysis by Purity Grade
  • Figure 87: South Asia & Pacific Market Value Share and BPS Analysis by End-Use Application, 2025 and 2035
  • Figure 88: South Asia & Pacific Market Y-o-Y Growth Comparison by End-Use Application, 2025-2035
  • Figure 89: South Asia & Pacific Market Attractiveness Analysis by End-Use Application
  • Figure 90: MEA Market Value Share and BPS Analysis by Country, 2025 and 2035
  • Figure 91: MEA Market Value Share and BPS Analysis by Product Type, 2025 and 2035
  • Figure 92: MEA Market Y-o-Y Growth Comparison by Product Type, 2025-2035
  • Figure 93: MEA Market Attractiveness Analysis by Product Type
  • Figure 94: MEA Market Value Share and BPS Analysis by Form, 2025 and 2035
  • Figure 95: MEA Market Y-o-Y Growth Comparison by Form, 2025-2035
  • Figure 96: MEA Market Attractiveness Analysis by Form
  • Figure 97: MEA Market Value Share and BPS Analysis by Purity Grade, 2025 and 2035
  • Figure 98: MEA Market Y-o-Y Growth Comparison by Purity Grade, 2025-2035
  • Figure 99: MEA Market Attractiveness Analysis by Purity Grade
  • Figure 100: MEA Market Value Share and BPS Analysis by End-Use Application, 2025 and 2035
  • Figure 101: MEA Market Y-o-Y Growth Comparison by End-Use Application, 2025-2035
  • Figure 102: MEA Market Attractiveness Analysis by End-Use Application
  • Figure 103: Global Market - Tier Structure Analysis
  • Figure 104: Global Market - Company Share Analysis

Frequently Asked Questions

How big is the Marine Squalene Alternatives Market in 2025?

The Marine Squalene Alternatives is estimated to be valued at USD 186.6 million in 2025.

What will be the size of Marine Squalene Alternatives Market in 2035?

The market size for the Marine Squalene Alternatives is projected to reach USD 466.7 million by 2035.

How much will be the Marine Squalene Alternatives Market growth between 2025 and 2035?

The Marine Squalene Alternatives is expected to grow at a 9.5% CAGR between 2025 and 2035.

What are the key product types in the Marine Squalene Alternatives Market?

The key product types in the Marine Squalene Alternatives Market are olive oil, amaranth seed oil, rice bran oil, sugarcane, microbial fermentation/strains, yeast-based fermentation, and synthetic biology-based production.

Which end-use application segment to contribute significant share in the Marine Squalene Alternatives Market in 2025?

In terms of end-use application, the cosmetics and personal care segment is projected to command the largest share, accounting for 50.6% of the Marine Squalene Alternatives Market in 2025.

Explore Similar Insights

Future Market Insights

Marine Squalene Alternatives Market

Chat With

MaRIA

Hi There, I am MaRIA, Your Market Research Intelligence Assistant. How may I help you?