Sustainable Glycerin Alternatives Market Size and Share Forecast Outlook 2025 to 2035

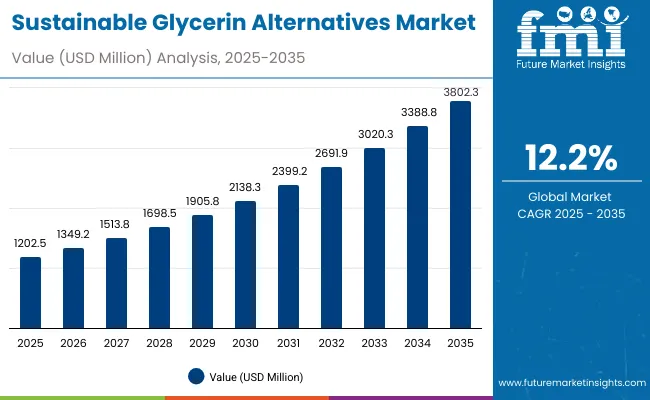
A market valuation of USD 1,202.5 million is anticipated in 2025 for the Sustainable Glycerin Alternatives Market, with the size projected to rise to USD 3,802.3 million by 2035. This trajectory indicates a cumulative addition of USD 2,599.8 million across the decade, reflecting a growth of nearly 216%. The overall expansion is expected to be underpinned by a CAGR of 12.2%, showcasing the accelerating transition toward palm-free and bio-based alternatives in personal care, pharmaceuticals, and consumer goods.
Quick Stats for Sustainable Glycerin Alternatives Market

  • Sustainable Glycerin Alternatives Market Value (2025): USD 1,202.5 million
  • Sustainable Glycerin Alternatives Market Forecast Value (2035): USD 3,802.3 million
  • Sustainable Glycerin Alternatives Market Forecast CAGR (2025 to 2035): 12.2%
  • Leading Segment in Sustainable Glycerin Alternatives Market in 2025: Humectancy & moisture retention (57%)
  • Key Growth Regions in the Sustainable Glycerin Alternatives Market: China, India, Japan, United States, Europe
  • Top Key Players in Sustainable Glycerin Alternatives Market: CovationBio PDO, BASF, Croda, Clariant, Ashland, Evonik, Givaudan, Seppic, DSM-Firmenich, KLK Oleo

Sustainable Glycerin Alternatives Market

Sustainable Glycerin Alternatives Market Key Takeaways

Metric Value
Sustainable Glycerin Alternatives Market Estimated Value in (2025E) USD 1,202.5 million
Sustainable Glycerin Alternatives Market Forecast Value in (2035F) USD 3,802.3 million
Forecast CAGR (2025 to 2035) 12.2%

The first half of the forecast horizon from 2025 to 2030 is likely to see market size advance from USD 1,202.5 million to USD 2,138.3 million, contributing USD 935.8 million or 36% of total decade growth. This initial expansion is set to be shaped by consistent adoption of fermentation-derived propanediol/glycerin, which is forecasted to hold a 45% share in 2025, alongside sustained demand for humectancy and moisture retention functions that account for 57% of total value. Channel shifts are also expected to influence early growth, with e-commerce emerging as a leading contributor at 51% share in 2025, driven by faster consumer education on sustainability claims.

The subsequent phase from 2030 to 2035 is projected to accelerate, adding USD 1,664 million and contributing nearly 64% of total decade growth. Market size is expected to advance from USD 2,138.3 million to USD 3,802.3 million, supported by rising demand from emerging economies, particularly China and India, where double-digit CAGRs of 20% and 23% respectively are anticipated. Verified palm-free and carbon-reduced claims, along with expanded multifunctional performance, are expected to strengthen premium positioning and secure long-term competitiveness.

From 2020 to 2024, momentum was gradually established through early adoption of fermentation-based and sugarcane-derived inputs, laying the foundation for broader scaling post to 2025. By 2025, the market is positioned at USD 1,202.5 million, with fermentation-derived propanediol/glycerin holding the largest share at 45%. Competitive dynamics are expected to remain fragmented, with leading innovators holding a global share below 10%, while regional players capture value through niche positioning and feedstock specialization.

The decade ahead is projected to be marked by a shift toward carbon-reduced and palm-free alternatives, with Asia emerging as the fastest-expanding region led by China and India. E-commerce distribution is forecasted to retain an advantage in finished goods, holding over half of 2025 sales. Competitive advantage is expected to shift from cost efficiency alone to verification of sustainability claims, backward integration of feedstocks, and the ability to demonstrate multifunctional performance in formulations. Industry leaders are anticipated to expand investment in application labs and certification frameworks to strengthen credibility and secure long-term partnerships.

Why the Sustainable Glycerin Alternatives Market is growing?

Growth in the Sustainable Glycerin Alternatives Market is being driven by structural shifts toward palm-free, bio-based, and carbon-reduced inputs, as brand owners and manufacturers seek verified sustainable replacements for conventional glycerin.

Rising consumer preference for clean-label and ethical formulations has reinforced the demand for alternatives that combine transparency with multifunctional performance. The accelerated adoption of fermentation-derived propanediol/glycerin is being fueled by its consistent purity, scalability, and reduced land-use intensity, making it a preferred option across personal care, pharmaceutical, and household segments.

Emerging economies such as China and India are providing strong momentum, supported by double-digit CAGRs as local production expands and premium personal care categories gain traction. The surge in e-commerce has enabled rapid dissemination of sustainability claims, helping to educate consumers and influence purchasing decisions.

Competitive dynamics are expected to be shaped by innovations in certification, lifecycle assessments, and feedstock integration, which will sustain long-term market expansion and reinforce resilience.

Segmental Analysis

The Sustainable Glycerin Alternatives Market is categorized by source, function, and channel, each contributing unique dynamics to overall growth. Sources include fermentation-derived propanediol/glycerin, sugarcane-derived glycerin, upcycled biodiesel glycerin, and palm-free botanical glycerin, reflecting the transition to low-carbon and palm-free supply chains.

Functions are segmented into humectancy and moisture retention, solvent/dispersant, sensorial enhancer, and mildness booster, highlighting the diverse roles alternatives serve across formulations. Channels include B2B ingredient supply, e-commerce, pharmacies, and mass retail, showing how adoption spreads through both institutional buyers and direct-to-consumer pathways.

Regional performance is influenced by sustainability claims such as palm-free, clean-label, and carbon-reduced, each shaping consumer preferences. These dimensions illustrate how growth is being driven by both structural innovation and evolving market priorities.
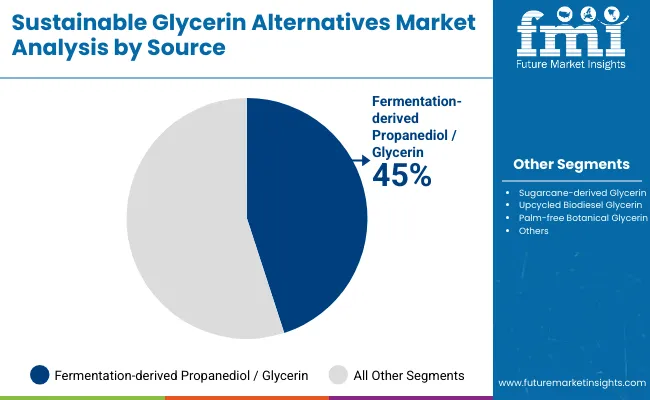
Insights into the Source Segment with Fermentation-derived Alternatives Leading in Market Share

Sustainable Glycerin Alternatives Market By Source

Segment Market Value Share, 2025
Fermentation-derived propanediol/glycerin 45%
Others 55.0%

Fermentation-derived propanediol/glycerin is expected to dominate the market with a 45% share in 2025, reflecting its consistent purity, scalability, and reduced reliance on palm-based feedstocks. Its adoption is being reinforced by brand owners prioritizing traceability and environmental transparency.

Other sources, including sugarcane-derived and upcycled biodiesel glycerin, are anticipated to sustain complementary growth, particularly in regions emphasizing feedstock availability and lifecycle-carbon savings. Botanical palm-free glycerin is projected to carve out niche demand where premium narratives hold importance. As fermentation technologies advance and scale efficiencies are unlocked, this segment is positioned to reinforce its leadership throughout the decade.
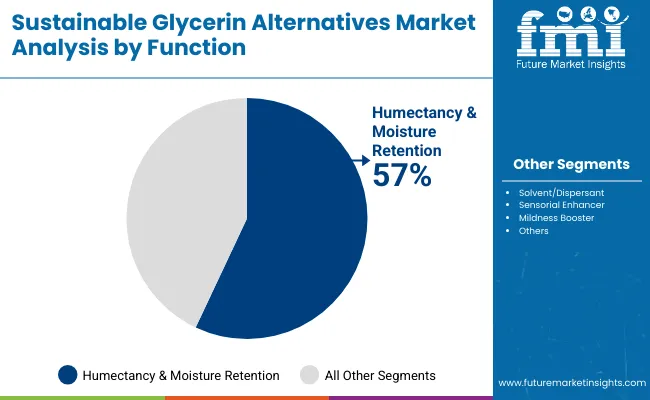
Insights into the Function Segment with Humectancy & Moisture Retention Dominating the Demand

Sustainable Glycerin Alternatives Market By Function

Segment Market Value Share, 2025
Humectancy & moisture retention 57%
Others 43.0%

Humectancy and moisture retention functions are projected to command the largest share at 57% in 2025, underscoring their vital role in personal care and pharmaceutical formulations. This dominance is expected to be maintained as consumers consistently value hydration and skin health in product claims.

Solvent/dispersant, sensorial enhancement, and mildness booster functions are anticipated to grow steadily, driven by multifunctional needs in clean-label formulations. As regulatory scrutiny on ingredient transparency increases, humectancy-led adoption is forecasted to remain central. Continued R&D investments are expected to enhance performance, strengthening the segment’s resilience as sustainability-driven formulations scale further.
Insights into the Channel Segment with E-commerce Leading in Market Penetration

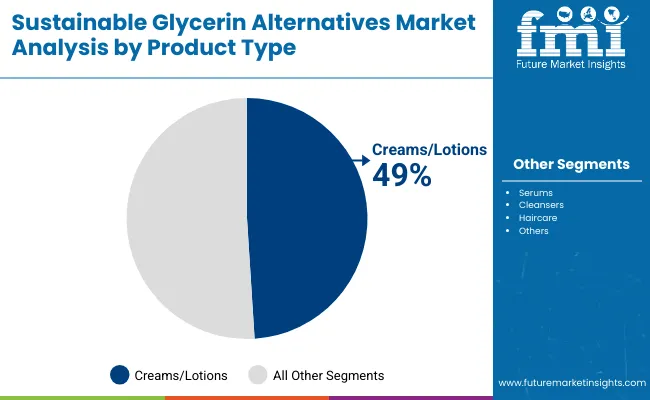
Sustainable Glycerin Alternatives Market By Product Type

Segment Market Value Share, 2025
Creams/lotions 49%
Others 51.0%

E-commerce channels are projected to lead with a 51% share in 2025, reflecting the rapid digitalization of consumer engagement and the effectiveness of online education on sustainability claims. Direct-to-consumer pathways are expected to accelerate the adoption of palm-free and clean-label formulations, particularly in Asia-Pacific and North America. B2B ingredient supply, accounting for 49%, is forecasted to remain vital, with large-scale buyers relying on long-term procurement contracts and rigorous QA standards.

Pharmacies and mass retail are anticipated to provide incremental support, particularly in Europe, where regulated categories dominate. The expanding influence of e-commerce is projected to drive awareness, reinforce premium positioning, and enable wider consumer access to sustainable alternatives.

What are the Drivers, Restraints, and Key Trends of the Sustainable Glycerin Alternatives Market?

Adoption of sustainable glycerin alternatives is being influenced by evolving formulation priorities, stricter sustainability frameworks, and regional capacity shifts, even as certification complexity, feedstock volatility, and lifecycle verification requirements challenge the pace of market acceleration.

Verification-led Differentiation

Growth is being powered by the premium assigned to verified sustainability credentials. Palm-free, carbon-reduced, and bio-based claims are no longer viewed as optional add-ons but as compliance-driven requirements in tender processes. This shift is expected to reward suppliers capable of offering batch-level lifecycle assessments, transparent sourcing, and third-party certifications.

Competitive advantage is projected to be defined less by low-cost supply and more by the depth of traceability and credibility across value chains. As retailers and multinational formulators harden procurement standards, verified sustainability is anticipated to serve as both a growth enabler and a critical gatekeeping factor, particularly in developed markets.

Feedstock and Infrastructure Fragility

A constraint on scalability is expected to emerge from the dual volatility of feedstock supply and infrastructure readiness. Sugarcane cycles, biodiesel policy shifts, and constraints on fermentation capacity expansion may restrict dependable availability, creating regional imbalances in cost competitiveness. Certification backlogs and fragmented carbon-accounting frameworks may compound delays, limiting supplier ability to meet rapid reformulation timelines.

This fragility is expected to slow adoption in sectors where reliability and uniformity of supply remain non-negotiable. Addressing these challenges will require investment in resilient feedstock integration, harmonized sustainability standards, and redundancy across fermentation and processing hubs to secure consistent supply throughout the forecast horizon.
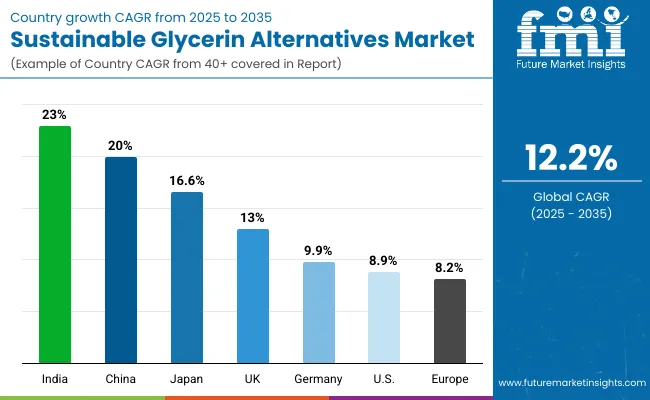
Analysis of Sustainable Glycerin Alternatives Market By Key Countries

Sustainable Glycerin Alternatives Market By Country

Country CAGR
China 20.0%
USA 8.9%
India 23.0%
UK 13.0%
Germany 9.9%
Japan 16.6%

The Sustainable Glycerin Alternatives Market is projected to expand unevenly across geographies, with country-specific dynamics shaping growth rates. India is expected to post the highest CAGR at 23.0% between 2025 and 2035, driven by rapid expansion of personal care and pharmaceutical manufacturing, alongside heightened preference for clean-label and bio-based inputs.

China follows with a 20.0% CAGR, reflecting its scaling fermentation infrastructure and policy-backed efforts to reduce reliance on palm-derived imports. Demand in these markets is projected to be amplified by rising consumer awareness and rapid e-commerce adoption, enabling faster uptake of palm-free alternatives.

Japan’s CAGR of 16.6% positions it as a critical growth hub, where multifunctional and sensorial attributes are highly valued in premium beauty segments. The UK at 13.0% is expected to advance on the back of regulatory pressures surrounding carbon reduction and clean-label compliance. Germany, at 9.9%, is anticipated to grow steadily, anchored by strong industrial formulation standards and stringent sustainability reporting frameworks.

The USA is projected to expand at 8.9%, with adoption tempered by market maturity and slower regulatory movement relative to Asia. Broader Europe excluding the UK and Germany records the slowest growth at 8.2%, reflecting saturation and cautious transition timelines. Collectively, these disparities underscore Asia’s leadership in shaping long-term market acceleration.
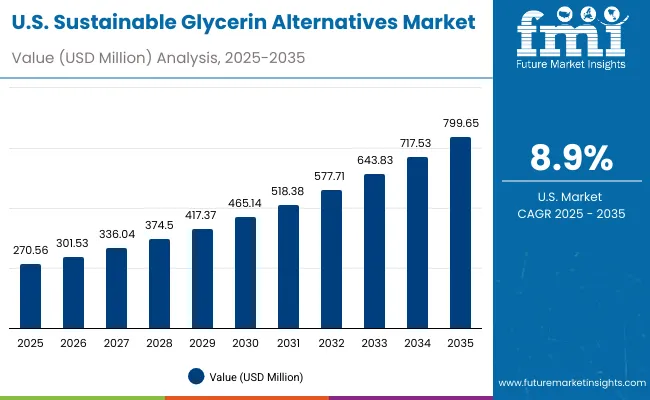
Sales Outlook for Sustainable Glycerin Alternatives in the United States

United States Sustainable Glycerin Alternatives Market

Year USA Sustainable Glycerin Alternatives Market (USD Million)
2025 270.56
2026 301.53
2027 336.04
2028 374.50
2029 417.37
2030 465.14
2031 518.38
2032 577.71
2033 643.83
2034 717.53
2035 799.65

The Sustainable Glycerin Alternatives Market in the United States is projected to grow at a CAGR of 11.6%, advancing from USD 270.56 million in 2025 to USD 799.65 million by 2035. The first half of the forecast period from 2025 to 2030 is expected to add USD 194.6 million, taking the market to USD 465.14 million. This phase is anticipated to be driven by humectancy and moisture retention applications, alongside the dominance of palm-free claims, which are forecasted to account for 51% of sales in 2025.

The second half from 2030 to 2035 is projected to accelerate, adding USD 334.5 million and raising the market size to USD 799.65 million. Expansion is likely to be fueled by rising demand for multifunctional fermentation-derived propanediol/glycerin, which benefits from traceability and lifecycle-carbon advantages.

E-commerce-led distribution is expected to strengthen, supporting consumer education on clean-label claims and reinforcing premium positioning in finished products. Procurement strategies of major manufacturers are anticipated to increasingly rely on verified sustainability metrics, creating opportunities for suppliers with robust certification frameworks.

  • Palm-free claims are forecasted to dominate USA sales, accounting for 51% of the market in 2025.
  • E-commerce distribution is projected to consolidate its leadership through premium consumer engagement.
  • Verified carbon-reduction credentials are expected to strengthen supplier competitiveness in procurement contracts.

Growth and Expansion Outlook for Sustainable Glycerin Alternatives Market in the United Kingdom

The Sustainable Glycerin Alternatives Market in the United Kingdom is projected to grow at a CAGR of 13.0%, reflecting the impact of clean-label adoption and carbon-reduction mandates. Market expansion is expected to be supported by regulatory frameworks emphasizing transparency in ingredient sourcing and lifecycle accountability.

From 2025 to 2030, steady growth is anticipated as personal care and healthcare categories increase reliance on verified palm-free inputs, aligned with consumer awareness campaigns. The period from 2030 to 2035 is likely to accelerate as multifunctional performance and eco-certifications become procurement benchmarks for multinational brand owners.

  • Carbon-reduction claims are forecasted to act as the primary adoption driver in the U.K.
  • Healthcare and pharmaceutical integration is expected to contribute steady demand growth.
  • E-commerce-led clean-label positioning is projected to capture a larger consumer base.
  • Suppliers with lifecycle certification and traceability systems are anticipated to secure procurement advantages.

Growth and Expansion Outlook for Sustainable Glycerin Alternatives Market in India

The Sustainable Glycerin Alternatives Market in India is projected to grow at a CAGR of 23.0%, making it the fastest-expanding country market during the forecast period. Strong momentum is expected from rapid growth in personal care consumption, coupled with rising acceptance of bio-based and palm-free alternatives in export-oriented formulations.

Between 2025 and 2030, adoption is projected to accelerate as domestic producers integrate fermentation-derived glycerin into cost-competitive manufacturing. From 2030 to 2035, sustained scaling is anticipated as India strengthens its role as a supply hub for Asia and global markets.

  • Clean-label demand is forecasted to expand strongly across skincare and haircare segments.
  • Export-driven adoption is expected to be reinforced by international sustainability compliance.
  • E-commerce penetration is projected to enable faster awareness and consumer uptake.
  • Local capacity expansion in fermentation is anticipated to reduce dependence on imports.

Sales Outlook for Sustainable Glycerin Alternatives in China

The Sustainable Glycerin Alternatives Market in China is projected to grow at a CAGR of 20.0%, reflecting the combined influence of industrial scaling and strong consumer preference for clean-label claims. Growth between 2025 and 2030 is expected to be driven by wider integration of fermentation-derived propanediol/glycerin, supported by national policies promoting sustainable biomanufacturing. From 2030 to 2035, acceleration is anticipated as e-commerce platforms expand penetration and premium product categories emphasize palm-free sourcing.
  • Fermentation-derived alternatives are forecasted to dominate due to scalable domestic production.
  • Palm-free and moisture-retention applications are expected to hold leading shares in 2025.
  • Online platforms are projected to accelerate clean-label adoption among younger consumers.
  • Government policy support for sustainable raw materials is anticipated to enhance competitiveness.

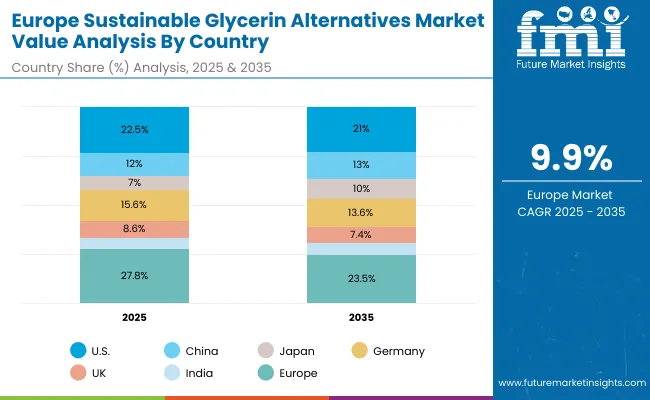
In-depth Analysis of Sustainable Glycerin Alternatives in Germany

Sustainable Glycerin Alternatives Market Germany

Country 2025
USA 22.5%
China 12.0%
Japan 7.0%
Germany 15.6%
UK 8.6%
India 5.3%
Country 2035
USA 21.0%
China 13.0%
Japan 10.0%
Germany 13.6%
UK 7.4%
India 6.0%

The Sustainable Glycerin Alternatives Market in Germany is projected to grow at a CAGR of 9.9%, reflecting steady but moderate expansion. The market is expected to remain strongly influenced by regulatory compliance frameworks and rigorous sustainability standards applied across cosmetics, healthcare, and household products. Between 2025 and 2030, demand is projected to be sustained by the prioritization of carbon-reduced formulations, while the 2030 to 2035 phase is likely to focus on broader multifunctional integration.
  • Carbon-reduction and lifecycle certification are forecasted to remain the primary growth levers.
  • Established industrial buyers are expected to drive steady procurement for regulated categories.
  • Fragmented supplier competition is projected to favor those with strong EU compliance portfolios.
  • Expansion in multifunctional roles is anticipated to support premium price resilience in formulations.

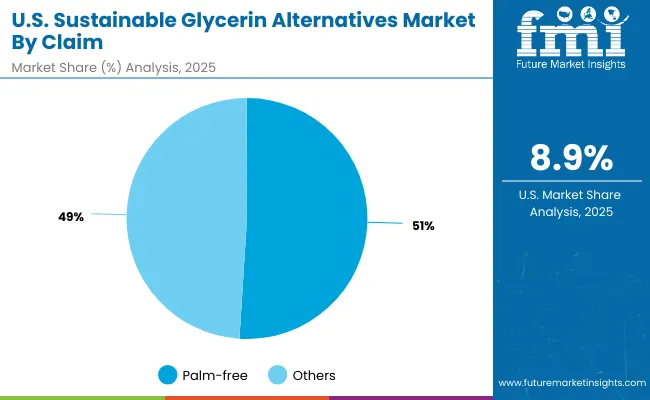
Growth Outlook for Sustainable Glycerin Alternatives Market in USA

Usa Sustainable Glycerin Alternatives Market

Segment Market Value Share, 2025
Palm-free 51%
Others 49.0%

The Sustainable Glycerin Alternatives Market in the United States is projected at USD 270.56 million in 2025. Palm-free claims contribute 51% (USD 138.0 million), while other claims represent 49% (USD 132.58 million), highlighting the early transition toward palm-free formulations.

This slight palm-free dominance reflects rising scrutiny over deforestation-linked supply chains and a shift toward transparent sourcing frameworks. Brand owners are expected to prioritize palm-free inputs in procurement as part of ESG commitments and retailer-driven compliance programs.

Palm-free positioning is anticipated to hold strategic significance as consumer awareness strengthens and lifecycle assessments become critical in winning long-term contracts. Although other claims remain relevant, particularly in bio-based and sensorial narratives, their influence is projected to gradually align with palm-free frameworks. Growth in the USA is expected to be reinforced by the alignment of sustainability mandates with evolving consumer preferences for traceable and verified clean-label products.
  • USA market valued at USD 270.56 million in 2025.
  • Palm-free claims lead slightly at 51% versus 49%.
  • Growth supported by ESG mandates and consumer preference for verified traceability.
  • Palm-free positioning expected to drive long-term procurement strategies.

Opportunity Analysis of China Sustainable Glycerin Alternatives Market

China Sustainable Glycerin Alternatives Market

Segment Market Value Share, 2025
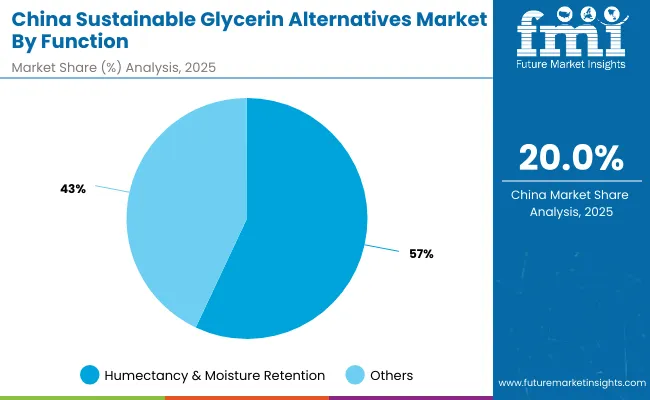
Humectancy & moisture retention 57%
Others 43.0%

The Sustainable Glycerin Alternatives Market in China is projected at USD 144.33 million in 2025. Humectancy and moisture retention dominate with 57% share (USD 82.3 million), while other functions account for 43% (USD 62.06 million). This dominance underscores the central role of hydration-focused formulations in the Chinese beauty and personal care landscape, where consumer demand for skin health and long-lasting moisture is intensifying.

The leading share of humectancy applications is expected to expand further as international and domestic brands align with consumer preference for multifunctional, palm-free, and clean-label solutions. Other functions, such as solvent and sensorial roles, are anticipated to gain traction as innovation in premium categories accelerates. Competitive positioning is likely to hinge on the ability to integrate verified sustainability with product efficacy, making humectancy functions the foundation for broader adoption.
  • Chinese market valued at USD 144.33 million in 2025.
  • Humectancy & moisture retention leads with 57% share.
  • Growth aligned with consumer preference for hydration-focused clean-label products.
  • Broader adoption of solvent and sensorial roles expected in premium categories.

Competitive Landscape of Sustainable Glycerin Alternatives Market

Sustainable Glycerin Alternatives Market By Company

Company Global Value Share 2025
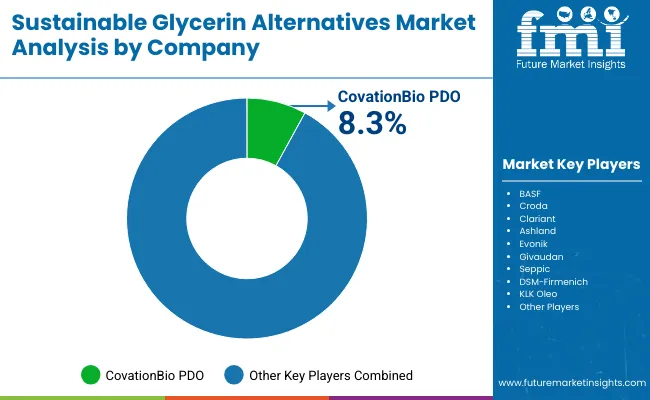
CovationBio PDO 8.3%
Others 91.7%

The Sustainable Glycerin Alternatives Market is moderately fragmented, with global leaders, established chemical innovators, and niche-focused producers competing across multiple sourcing and application domains. Leading players such as CovationBio PDO, BASF, Croda, and Clariant are expected to define the global landscape through their investments in fermentation technologies, palm-free certifications, and bio-based formulations.

CovationBio PDO is identified as the dominant global player, holding an estimated 8.3% share of the market in 2025, and its position is projected to remain strong given its backward integration in fermentation-based production. This share in 2024 was slightly lower but already marked the company as the leading supplier in this space.

Mid-sized innovators, including Ashland, Evonik, Seppic, and DSM-Firmenich, are expanding portfolios around multifunctional ingredients, offering traceable and carbon-reduced alternatives that align with consumer-facing sustainability narratives. Their competitive edge is anticipated to come from flexible production models and partnerships with personal care and healthcare formulators seeking cleaner inputs.

Specialized regional suppliers such as KLK Oleo and Givaudan are tailoring offerings toward niche performance attributes and sensorial experiences, capitalizing on premium positioning and localized demand preferences.

Competitive differentiation is expected to shift away from cost competition and toward lifecycle verification, feedstock security, and application-specific multifunctionality. The ability to combine certification, technical performance, and digital traceability is projected to determine long-term market leadership.

Key Developments in Sustainable Glycerin Alternatives Market

  • In May 2025, CovationBio PDO introduced new formulations of its Zemea® propanediol - USP-FCC & USP-NF grades - to meet stricter sustainability and regulatory standards across cosmetics, personal care, and household cleaning sectors. These grades were launched to deliver performance with reduced greenhouse-gas emissions.
  • In April 2025, CovationBio Biomaterials announced the launch of its BioPTMEG product line at Chinaplas Shenzhen, China. This introduction of bio-based thermoplastic elastomer intermediates was positioned to extend sustainable sourcing beyond glycerin alternatives into high-performance materials, broadening the market’s sustainability footprint.

Scope of the Report

Item Value
Quantitative units USD 1,202.5 million (2025); USD 3,802.3 million (2035); 12.2% CAGR (2025 to 2035)
Component Fermentation-derived propanediol/glycerin; Sugarcane-derived glycerin; Upcycled biodiesel glycerin; Palm-free botanical glycerin
Function Humectancy & moisture retention; Solvent/dispersant; Sensorial enhancer; Mildness booster
Product type Creams/lotions; Serums; Cleansers; Haircare
Channel B2B ingredient supply; E-commerce (finished goods); Pharmacies; Mass retail
Claims tracked Palm-free; Bio-based; Clean-label; Carbon-reduced
Regions covered North America; Europe; East Asia; South Asia & Pacific; Latin America; Middle East & Africa
Countries covered United States; China; India; United Kingdom; Germany; Japan
Key companies profiled CovationBio PDO; BASF; Croda; Clariant; Ashland; Evonik; Givaudan; Seppic; DSM-Firmenich; KLK Oleo
Additional attributes 2025 leading function share 57% (humectancy & moisture retention); E-commerce share 51% (2025) vs B2B 49%; USA palm-free claim 51% (USD 138.0 million); China 2025 function value USD 82.3 million (humectancy) and USD 62.06 million (others); lifecycle-assessment verification, palm-free certification, and fermentation capacity scaling expected to shape competitiveness and pricing over the decade

Key Segments

By Source:

  • Fermentation-derived propanediol/glycerin
  • Sugarcane-derived glycerin
  • Upcycled biodiesel glycerin
  • Palm-free botanical glycerin

By Function:

  • Humectancy & moisture retention
  • Solvent/dispersant
  • Sensorial enhancer
  • Mildness booster

By Product Type:

  • Creams/lotions
  • Serums
  • Haircare
  • Cleansers

By Channel:

  • B2B ingredient supply
  • E-commerce (finished goods)
  • Pharmacies
  • Mass retail

By Claim:

  • Palm-free
  • Bio-based
  • Clean-label
  • Carbon-reduced

By Region:

  • North America
  • Latin America
  • Europe
  • East Asia
  • South Asia & Pacific
  • Middle East and Africa

Table of Content

  1. Executive Summary
    • Global Market Outlook
    • Demand-side Trends
    • Supply-side Trends
    • Technology Roadmap Analysis
    • Analysis and Recommendations
  2. Market Overview
    • Market Coverage / Taxonomy
    • Market Definition / Scope / Limitations
  3. Market Background
    • Market Dynamics
      • Drivers
      • Restraints
      • Opportunity
      • Trends
    • Scenario Forecast
      • Demand in Optimistic Scenario
      • Demand in Likely Scenario
      • Demand in Conservative Scenario
    • Opportunity Map Analysis
    • Product Life Cycle Analysis
    • Supply Chain Analysis
    • Investment Feasibility Matrix
    • Value Chain Analysis
    • PESTLE and Porter’s Analysis
    • Regulatory Landscape
    • Regional Parent Market Outlook
    • Production and Consumption Statistics
    • Import and Export Statistics
  4. Global Analysis 2020 to 2024 and Forecast, 2025 to 2035
    • Historical Market Size Value (USD Million) Analysis, 2020 to 2024
    • Current and Future Market Size Value (USD Million) Projections, 2025 to 2035
      • Y-o-Y Growth Trend Analysis
      • Absolute $ Opportunity Analysis
  5. Global Pricing Analysis 2020 to 2024 and Forecast 2025 to 2035
  6. Global Analysis 2020 to 2024 and Forecast 2025 to 2035, By Source
    • Introduction / Key Findings
    • Historical Market Size Value (USD Million) Analysis By Source, 2020 to 2024
    • Current and Future Market Size Value (USD Million) Analysis and Forecast By Source, 2025 to 2035
      • Fermentation-derived propanediol/glycerin
      • Sugarcane-derived glycerin
      • Upcycled biodiesel glycerin
      • Palm-free botanical glycerin
    • Y-o-Y Growth Trend Analysis By Source, 2020 to 2024
    • Absolute $ Opportunity Analysis By Source, 2025 to 2035
  7. Global Analysis 2020 to 2024 and Forecast 2025 to 2035, By Function
    • Introduction / Key Findings
    • Historical Market Size Value (USD Million) Analysis By Function, 2020 to 2024
    • Current and Future Market Size Value (USD Million) Analysis and Forecast By Function, 2025 to 2035
      • Humectancy & moisture retention
      • Solvent/dispersant
      • Sensorial enhancer
      • Mildness booster
    • Y-o-Y Growth Trend Analysis By Function, 2020 to 2024
    • Absolute $ Opportunity Analysis By Function, 2025 to 2035
  8. Global Analysis 2020 to 2024 and Forecast 2025 to 2035, By Product Type
    • Introduction / Key Findings
    • Historical Market Size Value (USD Million) Analysis By Product Type, 2020 to 2024
    • Current and Future Market Size Value (USD Million) Analysis and Forecast By Product Type, 2025 to 2035
      • Creams/lotions
      • Serums
      • Haircare
      • Cleansers
    • Y-o-Y Growth Trend Analysis By Product Type, 2020 to 2024
    • Absolute $ Opportunity Analysis By Product Type, 2025 to 2035
  9. Global Analysis 2020 to 2024 and Forecast 2025 to 2035, By Channel
    • Introduction / Key Findings
    • Historical Market Size Value (USD Million) Analysis By Channel, 2020 to 2024
    • Current and Future Market Size Value (USD Million) Analysis and Forecast By Channel, 2025 to 2035
      • B2B ingredient supply
      • E-commerce (finished goods)
      • Pharmacies
      • Mass retail
    • Y-o-Y Growth Trend Analysis By Channel, 2020 to 2024
    • Absolute $ Opportunity Analysis By Channel, 2025 to 2035
  10. Global Analysis 2020 to 2024 and Forecast 2025 to 2035, By Claim
    • Introduction / Key Findings
    • Historical Market Size Value (USD Million) Analysis By Claim, 2020 to 2024
    • Current and Future Market Size Value (USD Million) Analysis and Forecast By Claim, 2025 to 2035
      • Palm-free
      • Bio-based
      • Clean-label
      • Carbon-reduced
    • Y-o-Y Growth Trend Analysis By Claim, 2020 to 2024
    • Absolute $ Opportunity Analysis By Claim, 2025 to 2035
  11. Global Analysis 2020 to 2024 and Forecast 2025 to 2035, By Region
    • Introduction
    • Historical Market Size Value (USD Million) Analysis By Region, 2020 to 2024
    • Current Market Size Value (USD Million) Analysis and Forecast By Region, 2025 to 2035
      • North America
      • Latin America
      • Europe
      • East Asia
      • South Asia & Pacific
      • Middle East and Africa
    • Market Attractiveness Analysis By Region
  12. North America Analysis 2020 to 2024 and Forecast 2025 to 2035, By Country
    • Historical Market Size Value (USD Million) Trend Analysis By Market Taxonomy, 2020 to 2024
    • Market Size Value (USD Million) Forecast By Market Taxonomy, 2025 to 2035
      • By Country
        • USA
        • Canada
      • By Source
      • By Function
      • By Product Type
      • By Channel
      • By Claim
    • Market Attractiveness Analysis
      • By Country
      • By Source
      • By Function
      • By Product Type
      • By Channel
      • By Claim
    • Key Takeaways
  13. Latin America Analysis 2020 to 2024 and Forecast 2025 to 2035, By Country
    • Historical Market Size Value (USD Million) Trend Analysis By Market Taxonomy, 2020 to 2024
    • Market Size Value (USD Million) Forecast By Market Taxonomy, 2025 to 2035
      • By Country
        • Brazil
        • Mexico
        • Colombia
        • Rest of Latin America
      • By Source
      • By Function
      • By Product Type
      • By Channel
      • By Claim
    • Market Attractiveness Analysis
      • By Country
      • By Source
      • By Function
      • By Product Type
      • By Channel
      • By Claim
    • Key Takeaways
  14. Europe Analysis 2020 to 2024 and Forecast 2025 to 2035, By Country
    • Historical Market Size Value (USD Million) Trend Analysis By Market Taxonomy, 2020 to 2024
    • Market Size Value (USD Million) Forecast By Market Taxonomy, 2025 to 2035
      • By Country
        • Germany
        • UK
        • France
        • Italy
        • Spain
        • Belgium
        • Netherlands
        • Nordic
        • Switzerland
        • Russia
        • Poland
        • Rest of Europe
      • By Source
      • By Function
      • By Product Type
      • By Channel
      • By Claim
    • Market Attractiveness Analysis
      • By Country
      • By Source
      • By Function
      • By Product Type
      • By Channel
      • By Claim
    • Key Takeaways
  15. East Asia Analysis 2020 to 2024 and Forecast 2025 to 2035, By Country
    • Historical Market Size Value (USD Million) Trend Analysis By Market Taxonomy, 2020 to 2024
    • Market Size Value (USD Million) Forecast By Market Taxonomy, 2025 to 2035
      • By Country
        • China
        • Japan
        • South Korea
      • By Source
      • By Function
      • By Product Type
      • By Channel
      • By Claim
    • Market Attractiveness Analysis
      • By Country
      • By Source
      • By Function
      • By Product Type
      • By Channel
      • By Claim
    • Key Takeaways
  16. South Asia & Pacific Analysis 2020 to 2024 and Forecast 2025 to 2035, By Country
    • Historical Market Size Value (USD Million) Trend Analysis By Market Taxonomy, 2020 to 2024
    • Market Size Value (USD Million) Forecast By Market Taxonomy, 2025 to 2035
      • By Country
        • India
        • Thailand
        • Malaysia
        • Indonesia
        • Singapore
        • Vietnam
        • Australia
        • New Zealand
        • Rest of South Asia
      • By Source
      • By Function
      • By Product Type
      • By Channel
      • By Claim
    • Market Attractiveness Analysis
      • By Country
      • By Source
      • By Function
      • By Product Type
      • By Channel
      • By Claim
    • Key Takeaways
  17. Middle East and Africa Analysis 2020 to 2024 and Forecast 2025 to 2035, By Country
    • Historical Market Size Value (USD Million) Trend Analysis By Market Taxonomy, 2020 to 2024
    • Market Size Value (USD Million) Forecast By Market Taxonomy, 2025 to 2035
      • By Country
        • Turkey
        • UAE
        • Saudi Arabia
        • Israel
        • Other GCC Countries
        • North Africa
        • South Africa
      • By Source
      • By Function
      • By Product Type
      • By Channel
      • By Claim
    • Market Attractiveness Analysis
      • By Country
      • By Source
      • By Function
      • By Product Type
      • By Channel
      • By Claim
    • Key Takeaways
  18. Key Countries Analysis
    • USA
      • Pricing Analysis
      • Market Share Analysis, 2024
        • By Source
        • By Function
        • By Product Type
        • By Channel
        • By Claim
    • Canada
      • Pricing Analysis
      • Market Share Analysis, 2024
        • By Source
        • By Function
        • By Product Type
        • By Channel
        • By Claim
    • Mexico
      • Pricing Analysis
      • Market Share Analysis, 2024
        • By Source
        • By Function
        • By Product Type
        • By Channel
        • By Claim
    • Brazil
      • Pricing Analysis
      • Market Share Analysis, 2024
        • By Source
        • By Function
        • By Product Type
        • By Channel
        • By Claim
    • Germany
      • Pricing Analysis
      • Market Share Analysis, 2024
        • By Source
        • By Function
        • By Product Type
        • By Channel
        • By Claim
    • UK
      • Pricing Analysis
      • Market Share Analysis, 2024
        • By Source
        • By Function
        • By Product Type
        • By Channel
        • By Claim
    • Italy
      • Pricing Analysis
      • Market Share Analysis, 2024
        • By Source
        • By Function
        • By Product Type
        • By Channel
        • By Claim
    • Spain
      • Pricing Analysis
      • Market Share Analysis, 2024
        • By Source
        • By Function
        • By Product Type
        • By Channel
        • By Claim
    • France
      • Pricing Analysis
      • Market Share Analysis, 2024
        • By Source
        • By Function
        • By Product Type
        • By Channel
        • By Claim
    • India
      • Pricing Analysis
      • Market Share Analysis, 2024
        • By Source
        • By Function
        • By Product Type
        • By Channel
        • By Claim
    • Australia & New Zealand
      • Pricing Analysis
      • Market Share Analysis, 2024
        • By Source
        • By Function
        • By Product Type
        • By Channel
        • By Claim
    • China
      • Pricing Analysis
      • Market Share Analysis, 2024
        • By Source
        • By Function
        • By Product Type
        • By Channel
        • By Claim
    • Japan
      • Pricing Analysis
      • Market Share Analysis, 2024
        • By Source
        • By Function
        • By Product Type
        • By Channel
        • By Claim
    • South Korea
      • Pricing Analysis
      • Market Share Analysis, 2024
        • By Source
        • By Function
        • By Product Type
        • By Channel
        • By Claim
    • Russia
      • Pricing Analysis
      • Market Share Analysis, 2024
        • By Source
        • By Function
        • By Product Type
        • By Channel
        • By Claim
    • Poland
      • Pricing Analysis
      • Market Share Analysis, 2024
        • By Source
        • By Function
        • By Product Type
        • By Channel
        • By Claim
    • Hungary
      • Pricing Analysis
      • Market Share Analysis, 2024
        • By Source
        • By Function
        • By Product Type
        • By Channel
        • By Claim
    • Kingdom of Saudi Arabia
      • Pricing Analysis
      • Market Share Analysis, 2024
        • By Source
        • By Function
        • By Product Type
        • By Channel
        • By Claim
    • South Africa
      • Pricing Analysis
      • Market Share Analysis, 2024
        • By Source
        • By Function
        • By Product Type
        • By Channel
        • By Claim
  19. Market Structure Analysis
    • Competition Dashboard
    • Competition Benchmarking
    • Market Share Analysis of Top Players
      • By Regional
      • By Source
      • By Function
      • By Product Type
      • By Channel
      • By Claim
  20. Competition Analysis
    • Competition Deep Dive
      • CovationBio PDO
        • Overview
        • Product Portfolio
        • Profitability by Market Segments (Product/Age /Sales Channel/Region)
        • Sales Footprint
        • Strategy Overview
        • BASF
        • Croda
        • Clariant
        • Ashland
        • Evonik
        • Givaudan
        • Seppic
        • DSM-Firmenich
        • KLK Oleo
  21. Assumptions & Acronyms Used
  22. Research Methodology

List of Tables

  • Table 1: Global Value (USD Million) Forecast by Region, 2020-2035
  • Table 2: Global Value (USD Million) Forecast by Source, 2020-2035
  • Table 3: Global Value (USD Million) Forecast by Function, 2020-2035
  • Table 4: Global Value (USD Million) Forecast by Product Type, 2020-2035
  • Table 5: Global Value (USD Million) Forecast by Channel, 2020-2035
  • Table 6: Global Value (USD Million) Forecast by Claim, 2020-2035
  • Table 7: North America Value (USD Million) Forecast by Country, 2020-2035
  • Table 8: North America Value (USD Million) Forecast by Source, 2020-2035
  • Table 9: North America Value (USD Million) Forecast by Function, 2020-2035
  • Table 10: North America Value (USD Million) Forecast by Product Type, 2020-2035
  • Table 11: North America Value (USD Million) Forecast by Channel, 2020-2035
  • Table 12: North America Value (USD Million) Forecast by Claim, 2020-2035
  • Table 13: Latin America Value (USD Million) Forecast by Country, 2020-2035
  • Table 14: Latin America Value (USD Million) Forecast by Source, 2020-2035
  • Table 15: Latin America Value (USD Million) Forecast by Function, 2020-2035
  • Table 16: Latin America Value (USD Million) Forecast by Product Type, 2020-2035
  • Table 17: Latin America Value (USD Million) Forecast by Channel, 2020-2035
  • Table 18: Latin America Value (USD Million) Forecast by Claim, 2020-2035
  • Table 19: Europe Value (USD Million) Forecast by Country, 2020-2035
  • Table 20: Europe Value (USD Million) Forecast by Source, 2020-2035
  • Table 21: Europe Value (USD Million) Forecast by Function, 2020-2035
  • Table 22: Europe Value (USD Million) Forecast by Product Type, 2020-2035
  • Table 23: Europe Value (USD Million) Forecast by Channel, 2020-2035
  • Table 24: Europe Value (USD Million) Forecast by Claim, 2020-2035
  • Table 25: East Asia Value (USD Million) Forecast by Country, 2020-2035
  • Table 26: East Asia Value (USD Million) Forecast by Source, 2020-2035
  • Table 27: East Asia Value (USD Million) Forecast by Function, 2020-2035
  • Table 28: East Asia Value (USD Million) Forecast by Product Type, 2020-2035
  • Table 29: East Asia Value (USD Million) Forecast by Channel, 2020-2035
  • Table 30: East Asia Value (USD Million) Forecast by Claim, 2020-2035
  • Table 31: South Asia & Pacific Value (USD Million) Forecast by Country, 2020-2035
  • Table 32: South Asia & Pacific Value (USD Million) Forecast by Source, 2020-2035
  • Table 33: South Asia & Pacific Value (USD Million) Forecast by Function, 2020-2035
  • Table 34: South Asia & Pacific Value (USD Million) Forecast by Product Type, 2020-2035
  • Table 35: South Asia & Pacific Value (USD Million) Forecast by Channel, 2020-2035
  • Table 36: South Asia & Pacific Value (USD Million) Forecast by Claim, 2020-2035
  • Table 37: Middle East and Africa Value (USD Million) Forecast by Country, 2020-2035
  • Table 38: Middle East and Africa Value (USD Million) Forecast by Source, 2020-2035
  • Table 39: Middle East and Africa Value (USD Million) Forecast by Function, 2020-2035
  • Table 40: Middle East and Africa Value (USD Million) Forecast by Product Type, 2020-2035
  • Table 41: Middle East and Africa Value (USD Million) Forecast by Channel, 2020-2035
  • Table 42: Middle East and Africa Value (USD Million) Forecast by Claim, 2020-2035

List of Figures

  • Figure 1: Global Pricing Analysis
  • Figure 2: Global Value (USD Million) Forecast 2020-2035
  • Figure 3: Global Value Share and BPS Analysis by Source, 2025 and 2035
  • Figure 4: Global Y-o-Y Growth Comparison by Source, 2025-2035
  • Figure 5: Global Attractiveness Analysis by Source
  • Figure 6: Global Value Share and BPS Analysis by Function, 2025 and 2035
  • Figure 7: Global Y-o-Y Growth Comparison by Function, 2025-2035
  • Figure 8: Global Attractiveness Analysis by Function
  • Figure 9: Global Value Share and BPS Analysis by Product Type, 2025 and 2035
  • Figure 10: Global Y-o-Y Growth Comparison by Product Type, 2025-2035
  • Figure 11: Global Attractiveness Analysis by Product Type
  • Figure 12: Global Value Share and BPS Analysis by Channel, 2025 and 2035
  • Figure 13: Global Y-o-Y Growth Comparison by Channel, 2025-2035
  • Figure 14: Global Attractiveness Analysis by Channel
  • Figure 15: Global Value Share and BPS Analysis by Claim, 2025 and 2035
  • Figure 16: Global Y-o-Y Growth Comparison by Claim, 2025-2035
  • Figure 17: Global Attractiveness Analysis by Claim
  • Figure 18: Global Value (USD Million) Share and BPS Analysis by Region, 2025 and 2035
  • Figure 19: Global Y-o-Y Growth Comparison by Region, 2025-2035
  • Figure 20: Global Attractiveness Analysis by Region
  • Figure 21: North America Incremental $ Opportunity, 2025-2035
  • Figure 22: Latin America Incremental $ Opportunity, 2025-2035
  • Figure 23: Europe Incremental $ Opportunity, 2025-2035
  • Figure 24: East Asia Incremental $ Opportunity, 2025-2035
  • Figure 25: South Asia & Pacific Incremental $ Opportunity, 2025-2035
  • Figure 26: Middle East and Africa Incremental $ Opportunity, 2025-2035
  • Figure 27: North America Value Share and BPS Analysis by Country, 2025 and 2035
  • Figure 28: North America Value Share and BPS Analysis by Source, 2025 and 2035
  • Figure 29: North America Y-o-Y Growth Comparison by Source, 2025-2035
  • Figure 30: North America Attractiveness Analysis by Source
  • Figure 31: North America Value Share and BPS Analysis by Function, 2025 and 2035
  • Figure 32: North America Y-o-Y Growth Comparison by Function, 2025-2035
  • Figure 33: North America Attractiveness Analysis by Function
  • Figure 34: North America Value Share and BPS Analysis by Product Type, 2025 and 2035
  • Figure 35: North America Y-o-Y Growth Comparison by Product Type, 2025-2035
  • Figure 36: North America Attractiveness Analysis by Product Type
  • Figure 37: North America Value Share and BPS Analysis by Channel, 2025 and 2035
  • Figure 38: North America Y-o-Y Growth Comparison by Channel, 2025-2035
  • Figure 39: North America Attractiveness Analysis by Channel
  • Figure 40: North America Value Share and BPS Analysis by Claim, 2025 and 2035
  • Figure 41: North America Y-o-Y Growth Comparison by Claim, 2025-2035
  • Figure 42: North America Attractiveness Analysis by Claim
  • Figure 43: Latin America Value Share and BPS Analysis by Country, 2025 and 2035
  • Figure 44: Latin America Value Share and BPS Analysis by Source, 2025 and 2035
  • Figure 45: Latin America Y-o-Y Growth Comparison by Source, 2025-2035
  • Figure 46: Latin America Attractiveness Analysis by Source
  • Figure 47: Latin America Value Share and BPS Analysis by Function, 2025 and 2035
  • Figure 48: Latin America Y-o-Y Growth Comparison by Function, 2025-2035
  • Figure 49: Latin America Attractiveness Analysis by Function
  • Figure 50: Latin America Value Share and BPS Analysis by Product Type, 2025 and 2035
  • Figure 51: Latin America Y-o-Y Growth Comparison by Product Type, 2025-2035
  • Figure 52: Latin America Attractiveness Analysis by Product Type
  • Figure 53: Latin America Value Share and BPS Analysis by Channel, 2025 and 2035
  • Figure 54: Latin America Y-o-Y Growth Comparison by Channel, 2025-2035
  • Figure 55: Latin America Attractiveness Analysis by Channel
  • Figure 56: Latin America Value Share and BPS Analysis by Claim, 2025 and 2035
  • Figure 57: Latin America Y-o-Y Growth Comparison by Claim, 2025-2035
  • Figure 58: Latin America Attractiveness Analysis by Claim
  • Figure 59: Europe Value Share and BPS Analysis by Country, 2025 and 2035
  • Figure 60: Europe Value Share and BPS Analysis by Source, 2025 and 2035
  • Figure 61: Europe Y-o-Y Growth Comparison by Source, 2025-2035
  • Figure 62: Europe Attractiveness Analysis by Source
  • Figure 63: Europe Value Share and BPS Analysis by Function, 2025 and 2035
  • Figure 64: Europe Y-o-Y Growth Comparison by Function, 2025-2035
  • Figure 65: Europe Attractiveness Analysis by Function
  • Figure 66: Europe Value Share and BPS Analysis by Product Type, 2025 and 2035
  • Figure 67: Europe Y-o-Y Growth Comparison by Product Type, 2025-2035
  • Figure 68: Europe Attractiveness Analysis by Product Type
  • Figure 69: Europe Value Share and BPS Analysis by Channel, 2025 and 2035
  • Figure 70: Europe Y-o-Y Growth Comparison by Channel, 2025-2035
  • Figure 71: Europe Attractiveness Analysis by Channel
  • Figure 72: Europe Value Share and BPS Analysis by Claim, 2025 and 2035
  • Figure 73: Europe Y-o-Y Growth Comparison by Claim, 2025-2035
  • Figure 74: Europe Attractiveness Analysis by Claim
  • Figure 75: East Asia Value Share and BPS Analysis by Country, 2025 and 2035
  • Figure 76: East Asia Value Share and BPS Analysis by Source, 2025 and 2035
  • Figure 77: East Asia Y-o-Y Growth Comparison by Source, 2025-2035
  • Figure 78: East Asia Attractiveness Analysis by Source
  • Figure 79: East Asia Value Share and BPS Analysis by Function, 2025 and 2035
  • Figure 80: East Asia Y-o-Y Growth Comparison by Function, 2025-2035
  • Figure 81: East Asia Attractiveness Analysis by Function
  • Figure 82: East Asia Value Share and BPS Analysis by Product Type, 2025 and 2035
  • Figure 83: East Asia Y-o-Y Growth Comparison by Product Type, 2025-2035
  • Figure 84: East Asia Attractiveness Analysis by Product Type
  • Figure 85: East Asia Value Share and BPS Analysis by Channel, 2025 and 2035
  • Figure 86: East Asia Y-o-Y Growth Comparison by Channel, 2025-2035
  • Figure 87: East Asia Attractiveness Analysis by Channel
  • Figure 88: East Asia Value Share and BPS Analysis by Claim, 2025 and 2035
  • Figure 89: East Asia Y-o-Y Growth Comparison by Claim, 2025-2035
  • Figure 90: East Asia Attractiveness Analysis by Claim
  • Figure 91: South Asia & Pacific Value Share and BPS Analysis by Country, 2025 and 2035
  • Figure 92: South Asia & Pacific Value Share and BPS Analysis by Source, 2025 and 2035
  • Figure 93: South Asia & Pacific Y-o-Y Growth Comparison by Source, 2025-2035
  • Figure 94: South Asia & Pacific Attractiveness Analysis by Source
  • Figure 95: South Asia & Pacific Value Share and BPS Analysis by Function, 2025 and 2035
  • Figure 96: South Asia & Pacific Y-o-Y Growth Comparison by Function, 2025-2035
  • Figure 97: South Asia & Pacific Attractiveness Analysis by Function
  • Figure 98: South Asia & Pacific Value Share and BPS Analysis by Product Type, 2025 and 2035
  • Figure 99: South Asia & Pacific Y-o-Y Growth Comparison by Product Type, 2025-2035
  • Figure 100: South Asia & Pacific Attractiveness Analysis by Product Type
  • Figure 101: South Asia & Pacific Value Share and BPS Analysis by Channel, 2025 and 2035
  • Figure 102: South Asia & Pacific Y-o-Y Growth Comparison by Channel, 2025-2035
  • Figure 103: South Asia & Pacific Attractiveness Analysis by Channel
  • Figure 104: South Asia & Pacific Value Share and BPS Analysis by Claim, 2025 and 2035
  • Figure 105: South Asia & Pacific Y-o-Y Growth Comparison by Claim, 2025-2035
  • Figure 106: South Asia & Pacific Attractiveness Analysis by Claim
  • Figure 107: Middle East and Africa Value Share and BPS Analysis by Country, 2025 and 2035
  • Figure 108: Middle East and Africa Value Share and BPS Analysis by Source, 2025 and 2035
  • Figure 109: Middle East and Africa Y-o-Y Growth Comparison by Source, 2025-2035
  • Figure 110: Middle East and Africa Attractiveness Analysis by Source
  • Figure 111: Middle East and Africa Value Share and BPS Analysis by Function, 2025 and 2035
  • Figure 112: Middle East and Africa Y-o-Y Growth Comparison by Function, 2025-2035
  • Figure 113: Middle East and Africa Attractiveness Analysis by Function
  • Figure 114: Middle East and Africa Value Share and BPS Analysis by Product Type, 2025 and 2035
  • Figure 115: Middle East and Africa Y-o-Y Growth Comparison by Product Type, 2025-2035
  • Figure 116: Middle East and Africa Attractiveness Analysis by Product Type
  • Figure 117: Middle East and Africa Value Share and BPS Analysis by Channel, 2025 and 2035
  • Figure 118: Middle East and Africa Y-o-Y Growth Comparison by Channel, 2025-2035
  • Figure 119: Middle East and Africa Attractiveness Analysis by Channel
  • Figure 120: Middle East and Africa Value Share and BPS Analysis by Claim, 2025 and 2035
  • Figure 121: Middle East and Africa Y-o-Y Growth Comparison by Claim, 2025-2035
  • Figure 122: Middle East and Africa Attractiveness Analysis by Claim
  • Figure 123: Global - Tier Structure Analysis
  • Figure 124: Global - Company Share Analysis

Frequently Asked Questions

How big is the Sustainable Glycerin Alternatives Market in 2025?

The global Sustainable Glycerin Alternatives Market is estimated to be valued at USD 1,202.5 million in 2025.

What will be the size of the Sustainable Glycerin Alternatives Market in 2035?

The market size for the Sustainable Glycerin Alternatives Market is projected to reach USD 3,802.3 million by 2035.

How much will be the Sustainable Glycerin Alternatives Market growth between 2025 and 2035?

The Sustainable Glycerin Alternatives Market is expected to grow at a CAGR of 12.2% between 2025 and 2035.

What are the key product types in the Sustainable Glycerin Alternatives Market?

The key product types in the Sustainable Glycerin Alternatives Market are creams/lotions, serums, cleansers, and haircare.

Which function segment is expected to contribute the most in the Sustainable Glycerin Alternatives Market in 2025?

In terms of function, humectancy & moisture retention is forecasted to command the leading share at 57% in 2025.

Explore Similar Insights

Future Market Insights

Sustainable Glycerin Alternatives Market

Chat With

MaRIA

Hi There, I am MaRIA, Your Market Research Intelligence Assistant. How may I help you?