Ceramide Complexes Market Size and Share Forecast Outlook 2025 to 2035

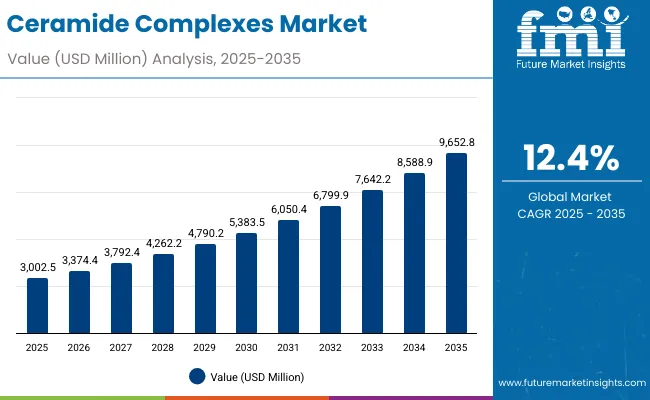
The valuation of the ceramide complexes market is projected to reach USD 3,002.5 million in 2025 and rise to USD 9,652.8 million by 2035, reflecting an addition of over USD 6,650.3 million across the decade. This expansion represents a 12.4% CAGR, indicating a robust upward trajectory and a more than threefold increase in market scale within ten years.
Quick Stats for Ceramide Complexes Market

  • Ceramide Complexes Market Value (2025): USD 3,002.5 million
  • Ceramide Complexes Market Forecast Value (2035): USD 9,652.8 million
  • Ceramide Complexes Market Forecast CAGR: 12.4%
  • Leading Segment in Ceramide Complexes Market in 2025: Creams (USD 1,636.4 million, 54.5%)
  • Key Growth Regions in the Ceramide Complexes Market: Asia-Pacific, North America, Europe
  • Top Key Players in the Ceramide Complexes Market: CeraVe (L’Oréal), Eucerin (Beiersdorf), Cetaphil (Galderma), La Roche-Posay (L’Oréal), Aveeno (Johnson & Johnson), Paula’s Choice (Unilever), Dr. Jart+, Shiseido, Bioderma, Clinique

Ceramide Complexes Market

Ceramide Complexes Market Key Takeaways

Metric Value
Market Estimated Value in (2025E) USD 3,002.5 million
Market Forecast Value in (2035F) USD 9,652.8 million
Forecast CAGR (2025 to 2035) 12.40%

The first half of the forecast period, spanning 2025 to 2030, is anticipated to witness steady growth, with revenues rising from USD 3,002.5 million to USD 5,383.5 million, capturing nearly 36% of the overall decade growth. During this phase, market momentum will be driven by increasing adoption of ceramide-based formulations within mass-market skincare and heightened awareness of barrier repair as a preventative measure against aging and environmental stress.

The second half of the period, from 2030 to 2035, is forecast to accelerate sharply, adding over USD 4,269.3 million in value as the market advances from USD 5,383.5 million to USD 9,652.8 million. This phase is expected to be characterized by widespread integration of ceramide complexes into diversified skincare portfolios, supported by scientific validation, e-commerce penetration, and rising premiumization in Asia-Pacific markets. Segmental dominance is anticipated from cream formulations, which will account for the largest share in 2025, while barrier repair remains the leading function. Global expansion will be reinforced by double-digit growth in China and India, positioning the market as a cornerstone of advanced dermocosmetic care.

Between 2020 and 2024, the Ceramide Complexes Market grew steadily as consumer awareness of barrier repair and hydration benefits gained traction. Expansion during this period was led by multinational players, with L’Oréal, Beiersdorf, and Johnson & Johnson consolidating strong shares through pharmacy-based distribution and digital-first campaigns.

By 2025, market value is estimated at USD 3,002.5 million, with revenues forecast to rise to USD 9,652.8 million by 2035. This threefold increase reflects accelerated adoption of masstige skincare, premium innovation, and sustainable formulations. Differentiation is expected to shift from general moisturizing benefits to clinically validated barrier restoration and eco-friendly ceramide solutions. New entrants are leveraging e-commerce, dermatologist collaborations, and digital engagement, while established leaders are enhancing portfolios with bioengineered ceramides and sustainable packaging. Competitive advantage is moving from pure scale toward trust, sustainability, and integration into holistic skin health ecosystems.

Why the Ceramide Complexes Market is growing?

Growth in the ceramide complexes market is being fueled by rising consumer awareness of skin barrier health and the increasing prevalence of dermatological concerns linked to pollution, stress, and aging. Strong clinical validation has reinforced the role of ceramides in repairing barrier function, reducing sensitivity, and improving hydration, which has encouraged adoption across mass and premium skincare ranges. Demand is also being supported by the expansion of masstige offerings, where affordable yet scientifically backed formulations are bringing advanced skincare to wider consumer bases.

E-commerce penetration has accelerated discovery and accessibility, enabling dermatologist-recommended products to reach global audiences. Growth in emerging economies such as China and India is being powered by rising disposable incomes, preventive health consciousness, and expanding retail channels. Premiumization trends in Asia-Pacific are further strengthening market value creation. The long-term outlook is expected to be shaped by ongoing innovations in formulation science, sustainability initiatives in ingredient sourcing, and greater integration of ceramide complexes into holistic skin wellness routines.

Segmental Analysis

The ceramide complexes market has been segmented across product type, function, and tier, each highlighting distinct demand drivers shaping adoption. Cream formulations are positioned as the dominant category due to their proven delivery efficacy and consumer familiarity, while barrier repair functions continue to hold the strongest scientific and clinical validation. Tier-wise, the masstige category has emerged as a key growth lever, reflecting rising demand for dermatologist-endorsed skincare made accessible to a broader audience.

Across these segments, growth has been reinforced by consumer awareness, affordability, and scientific credibility. The analysis suggests that while premium categories are evolving, mass and masstige adoption will underpin long-term value creation, enabling ceramides to become foundational within both everyday and specialized skincare routines.
Insights into the Product Type Segment with Creams Leading in Market Share

Ceramide Complexes Market By Product

Segment Market Value Share, 2025
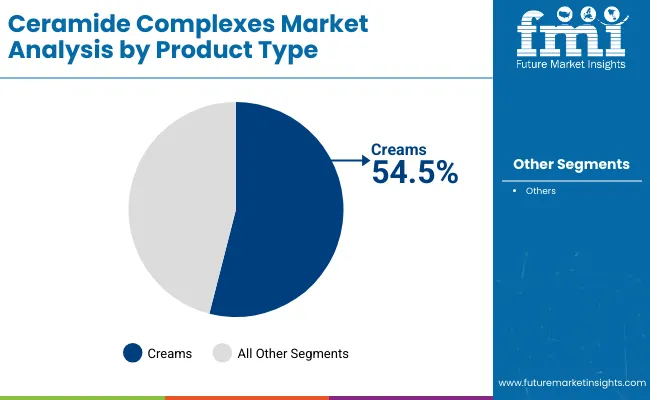
Creams 54.5%
Others 45.5%

Cream formulations are expected to lead the ceramide complexes market in 2025, accounting for 54.5% share. Their dominance is being supported by superior efficacy in delivering active concentrations and the trust built through dermatologist recommendations. Consumer familiarity with creams, coupled with their versatility across daily routines, is expected to sustain growth momentum. While alternative product types such as lotions, gels, and balms are expanding, their uptake remains complementary. Creams are projected to remain the core driver of volume adoption as they balance accessibility with proven results, ensuring they maintain a central role in both mass and masstige categories throughout the forecast horizon.
Insights into the Function Segment with Barrier Repair Dominating Demand

Ceramide Complexes Market By Function

Segment Market Value Share, 2025
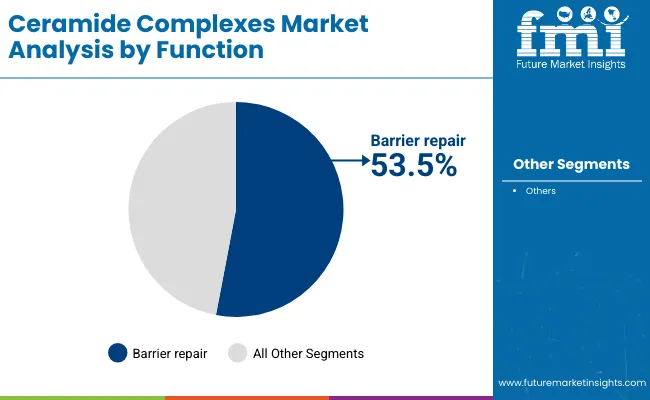
Barrier repair 53.5%
Others 46.5%

Barrier repair has been identified as the largest function within ceramide complexes, with a projected 53.5% share. Growth in this segment is being driven by consumer awareness of the role of ceramides in strengthening skin resilience, reducing transepidermal water loss, and addressing sensitivity. Dermatologist endorsements and clinical research have further reinforced trust in barrier repair claims, making them a cornerstone of marketing strategies. While hydration and anti-aging benefits remain important, they are typically framed as secondary advantages to barrier efficacy. The functional dominance of barrier repair is expected to persist, as its credibility is rooted in long-term skin health outcomes, establishing it as a sustainable growth engine.
Insights into the Tier Segment with Masstige Expanding Accessibility

Ceramide Complexes Market By Tier

Segment Market Value Share, 2025
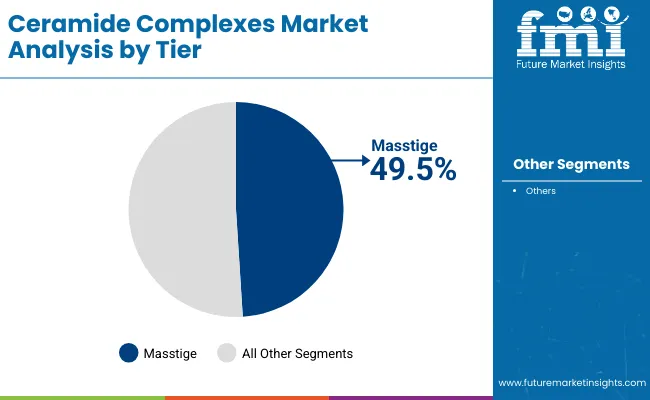
Masstige 49.5%
Others 50.5%

The masstige segment is projected to account for 49.5% of global revenues in 2025, valued at USD 1,484.8 million. Expansion in this tier is being propelled by the accessibility of dermatologist-approved ceramide products at affordable price points, bridging the gap between mass-market affordability and premium credibility. This democratization of advanced skincare is expected to deepen penetration across emerging and developed economies. Masstige growth is further supported by strong retail and e-commerce distribution, ensuring wider consumer reach. While premium offerings are likely to gain traction through innovation and luxury positioning, masstige products will continue to capture the largest consumer base, reinforcing their role as a critical pillar of volume and value growth across the global ceramide complexes market.

What are the Drivers, Restraints, and Key Trends of the Ceramide Complexes Market?

The ceramide complexes market is being shaped by evolving consumer expectations, clinical validation, and technological advancement, while challenges related to cost efficiency, formulation complexity, and claim substantiation continue to define the balance between accelerated adoption and structural limitations across global skincare portfolios.

Clinical Validation and Dermatological Endorsement

Clinical validation and strong dermatological endorsement have been identified as a primary accelerator for ceramide complexes adoption. Unlike generic moisturizers, ceramide formulations are supported by reproducible clinical outcomes linked to barrier strengthening and hydration retention. This medical alignment has reinforced trust among consumers and practitioners, ensuring long-term inclusion within preventative and corrective skincare routines.

The forward-looking potential lies in deeper integration with tele-dermatology platforms, where digital consultations are expected to amplify product credibility and expand reach. As global healthcare systems increasingly recognize skin health as part of holistic wellness, ceramide complexes are positioned to become medical-grade actives accessible to both mass and premium audiences, thereby strengthening their market penetration.

Ingredient Sourcing Complexity and Cost Pressure

A significant restraint in the ceramide complexes market is associated with sourcing complexity and raw material cost volatility. High-quality ceramides often require specialized bioengineering or lipid extraction processes, which elevate production costs and limit scalability for smaller players. These challenges have restricted price competitiveness in markets dominated by mass skincare, where affordability dictates consumer choice.

In the forward-looking scenario, this restraint is expected to shape consolidation, as larger multinational firms with integrated supply chains and R&D capabilities are better positioned to absorb cost fluctuations. Sustainability concerns around sourcing methods could further elevate pressure, compelling manufacturers to invest in synthetic biology or green chemistry solutions. Such transitions are anticipated to transform cost structures but will require significant upfront investment, creating uneven adoption patterns across geographies.
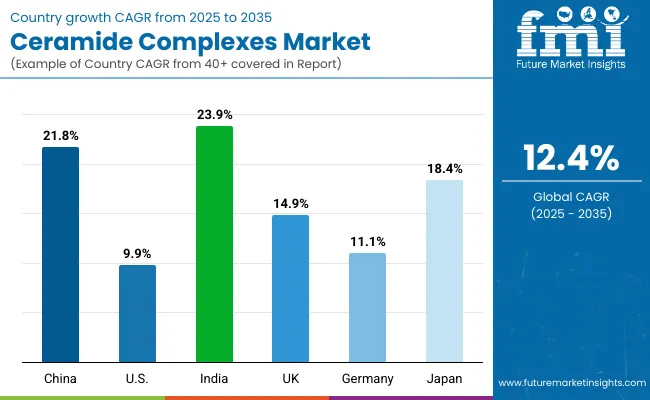
Analysis of Ceramide Complexes Market By Key Countries

Ceramide Complexes Market By Country

Countries CAGR
China 21.8%
USA 9.9%
India 23.9%
UK 14.9%
Germany 11.1%
Japan 18.4%

The global ceramide complexes market is expected to display marked variation in adoption and growth when assessed by country-level dynamics, shaped by consumer awareness, healthcare integration, and retail modernization. Emerging Asia is projected to outperform due to strong demand drivers and favorable growth conditions. India is forecast to deliver the fastest expansion, with a 23.9% CAGR, underpinned by growing middle-class incomes, masstige positioning, and rapid e-commerce penetration. China is expected to follow closely at 21.8% CAGR, supported by dermatology-driven endorsements and a rising focus on preventive skincare within urban populations. Japan’s growth at 18.4% CAGR reflects both premium positioning and strong consumer affinity for clinically validated formulations.

Europe is expected to maintain steady progress, with the UK and Germany advancing at 14.9% and 11.1% CAGR respectively, driven by regulatory alignment, strong pharmacy channels, and increasing investment in dermatological research. Adoption in these countries will be reinforced by premium and masstige strategies that combine efficacy with clinical validation.

The USA, while expanding at a more moderate 9.9% CAGR, is expected to remain a critical revenue contributor due to scale, established brands, and consumer trust in dermatologist-endorsed skincare. Overall, high-growth Asian markets are expected to reshape global share distribution, while Europe and North America maintain strong but steadier contributions.
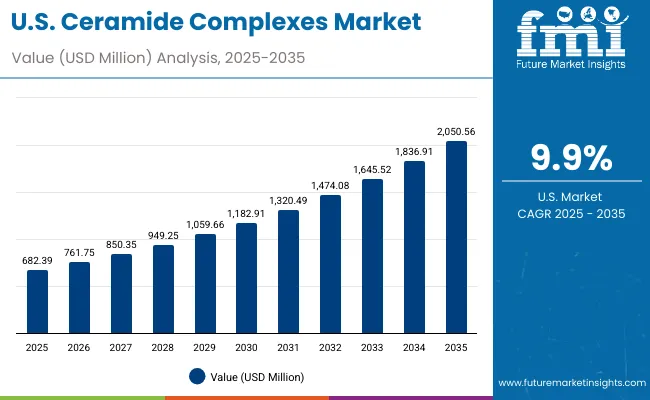
Sales Outlook for Ceramide Complexes in the United States

Ceramide Complexes Market  Usa

Year USA Ceramide Complexes Market (USD Million)
2025 682.39
2026 761.75
2027 850.35
2028 949.25
2029 1,059.66
2030 1,182.91
2031 1,320.49
2032 1,474.08
2033 1,645.52
2034 1,836.91
2035 2,050.56

The ceramide complexes market in the United States is projected to grow at a CAGR of 9.9% between 2025 and 2035. The market is estimated at USD 682.39 million in 2025 and is forecast to reach USD 2,050.56 million by 2035, with steady growth recorded across the decade. In 2026, the value is expected at USD 761.75 million, followed by USD 850.35 million in 2027 and USD 949.25 million in 2028. By 2029, the market is anticipated to reach USD 1,059.66 million and climb further to USD 1,182.91 million in 2030. The upward trajectory continues in 2031 with USD 1,320.49 million, USD 1,474.08 million in 2032, USD 1,645.52 million in 2033, USD 1,836.91 million in 2034, and USD 2,050.56 million in 2035.

The decade-long progression highlights sustained momentum, supported by consumer reliance on dermatologist-endorsed skincare, expansion of masstige products, and strong visibility across pharmacy and online channels. Early growth will be shaped by increased trust in ceramide-led barrier repair solutions, while the latter years are expected to accelerate through innovations in bioengineered ceramides and sustainability-driven sourcing. The USA is projected to remain a leading revenue generator globally, despite faster relative growth rates in emerging Asian markets.

  • Dermatologist-led awareness campaigns and mass retail partnerships are expected to strengthen adoption during the early forecast period.
  • Premiumization trends and bioengineered ceramide innovation are projected to elevate long-term value creation in the USA market.

Growth and Expansion Outlook for Ceramide Complexes Market in the United Kingdom

The ceramide complexes market in the United Kingdom is projected to grow at a CAGR of 14.9% between 2025 and 2035. This growth will be underpinned by increasing consumer focus on skin barrier health, expansion of dermocosmetic retail channels, and heightened awareness of clinically validated formulations. Pharmacies and online platforms are expected to act as the mainstay of market expansion, with masstige offerings bridging affordability and efficacy. By the latter half of the decade, the market will likely be accelerated by rising premiumization trends, sustainability-focused branding, and enhanced integration of ceramide complexes into multi-functional anti-aging skincare lines. Regulatory standards for product claims and labeling are expected to maintain credibility while fostering consumer trust.

  • Pharmacy and online platforms are expected to strengthen product accessibility.
  • Masstige positioning is projected to capture the largest consumer base.
  • Premium innovation and sustainability will reinforce long-term growth.
  • Strict compliance standards are expected to support consumer trust.

Growth and Expansion Outlook for Ceramide Complexes Market in India

The ceramide complexes market in India is projected to grow at a CAGR of 23.9% between 2025 and 2035. This makes the country the fastest-growing market globally, driven by rising disposable incomes, urbanization, and a shift toward preventative skincare practices. Increasing adoption of ceramide formulations is expected to be amplified by digital-first beauty platforms, e-commerce penetration, and the masstige category that balances affordability with dermatologist-backed credibility. In the early years, market expansion will be supported by strong pharmacy sales and heightened visibility in modern retail. Toward the latter half of the decade, premium adoption will be shaped by the aspirational consumer segment and rising demand for sustainable formulations. India’s trajectory is expected to reshape the regional balance of revenues in Asia-Pacific by 2035.

  • India is projected to post the highest global CAGR at 23.9%.
  • E-commerce penetration will play a pivotal role in scaling adoption.
  • Masstige formulations are expected to lead volume growth.
  • Premiumization will accelerate during the latter forecast years.

Sales Outlook for Ceramide Complexes in China

The ceramide complexes market in China is projected to grow at a CAGR of 21.8% between 2025 and 2035. Growth will be supported by heightened awareness of barrier repair skincare, urban lifestyle stressors driving dermatology adoption, and endorsement of ceramide formulations by medical professionals. Early market expansion will be driven by mass and masstige categories, reflecting strong demand for affordable, clinically proven skincare. In the latter half of the forecast period, premium lines and sustainable, bioengineered ceramides are expected to elevate market momentum. Digital platforms and social commerce are projected to act as critical accelerators, shaping consumer education and driving trial-to-purchase conversions. China’s role as a hub for dermocosmetic innovation will reinforce its position as a leading Asian market.
  • Dermatology-driven awareness will anchor long-term demand.
  • Social commerce is expected to accelerate consumer education and adoption.
  • Masstige offerings will dominate near-term volumes.
  • Premium and sustainable innovations will fuel late-decade growth.

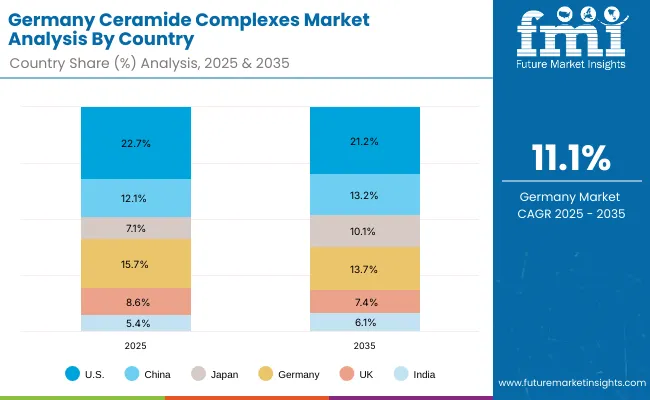
In-depth Analysis of Ceramide Complexes in Germany

Ceramide Complexes Market Germany

Countries 2025
USA 22.7%
China 12.1%
Japan 7.1%
Germany 15.7%
UK 8.6%
India 5.4%
Countries 2035
USA 21.2%
China 13.2%
Japan 10.1%
Germany 13.7%
UK 7.4%
India 6.1%

The ceramide complexes market in Germany is projected to grow at a CAGR of 11.1% between 2025 and 2035. Growth will be driven by the country’s established dermocosmetic culture, strong pharmacy networks, and stringent regulatory standards that reinforce product credibility. In the early phase, adoption will be centered on functional skincare anchored in barrier repair claims and dermatologist endorsements.

By the later years, innovation in sustainable ceramide sourcing, premium anti-aging formulations, and hybrid masstige offerings are expected to accelerate demand. Germany is also projected to remain an influential market in shaping EU-wide compliance benchmarks for claims, thereby elevating trust in ceramide-based products. While its growth rate is moderate compared to Asia, Germany’s high-value consumer base and medical credibility will sustain steady expansion.
  • Strong pharmacy networks will reinforce consumer accessibility.
  • Regulatory alignment will continue to elevate trust and compliance.
  • Sustainable ceramide innovations are expected to gain traction.
  • Premium anti-aging solutions will shape long-term adoption.

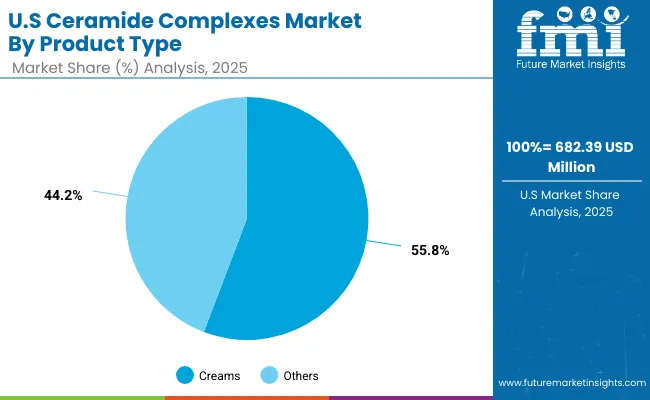
Growth Outlook for Ceramide Complexes Market in USA

Ceramide Complexes Market Usa 2

Segment Market Value Share, 2025
Creams 55.8%
Others 44.2%

The ceramide complexes market in the United States is projected at USD 682.39 million in 2025. Cream formulations contribute 55.8%, equivalent to USD 380 million, while other product types account for 44.2%, valued at USD 301.92 million. The dominance of creams reflects their superior efficacy in delivering active ceramides, ensuring deeper penetration and higher stability compared to lighter formats such as gels or lotions. This preference is reinforced by dermatologist endorsements and consumer familiarity with cream-based regimens as the foundation of barrier-repair and hydration solutions.

Over the forecast period, growth in creams is expected to be supported by strong visibility across pharmacy chains and e-commerce platforms. Other formats are anticipated to remain complementary, catering to consumer demand for texture variety and situational use, but creams will continue to anchor the USA market due to proven outcomes and consistent user trust.
  • Creams hold the leading share at 55.8% in 2025.
  • Dermatologist endorsement strengthens consumer reliance on creams.
  • Pharmacy and e-commerce channels reinforce sustained demand.
  • Other product types remain secondary, catering to niche preferences.

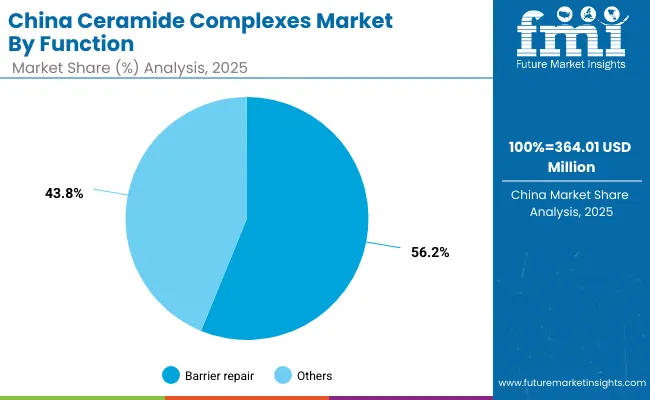
Opportunity Analysis of China Ceramide Complexes Market

Ceramide Complexes Market China

Segment Market Value Share, 2025
Barrier repair 56.2%
Others 43.8%

The ceramide complexes market in China is projected at USD 364.01 million in 2025. Barrier repair contributes 56.2%, equivalent to USD 205 million, while other functions represent 43.8%, valued at USD 159.31 million. The clear leadership of barrier repair reflects the growing recognition of ceramides as essential in strengthening the skin’s defense against pollution, stress, and environmental aggressors common in urban areas.

Clinical validation and dermatologist endorsement have elevated consumer trust, making barrier repair the anchor benefit across skincare routines. Unlike secondary functions such as hydration or soothing, barrier repair provides measurable outcomes, which resonate strongly with Chinese consumers seeking visible efficacy. Over the forecast period, digital-first beauty ecosystems, social commerce, and masstige affordability are expected to broaden access, while premium innovation in sustainable ceramides is anticipated to reinforce long-term market expansion.
  • Barrier repair leads with 56.2% share in 2025.
  • Dermatologist endorsements are expected to anchor trust.
  • Social commerce will drive education and trial adoption.
  • Sustainable and premium innovations will support late-decade momentum.

Competitive Landscape of Ceramide Complexes Market

Ceramide Complexes Market By Company

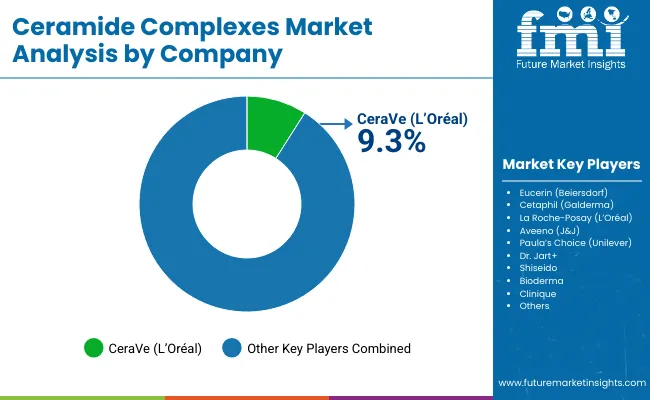
The ceramide complexes market is moderately fragmented, with global leaders, multinational personal care companies, and niche dermocosmetic specialists competing for share. Global leaders such as L’Oréal, Beiersdorf, Johnson & Johnson, Unilever, Galderma, and Shiseido have been recognized as key participants, leveraging strong dermatological credibility and widespread retail distribution. Among them, CeraVe (L’Oréal) is the dominant brand, holding a 9.3% global value share in 2025 and slightly lower at 9.1% in 2024, making it the largest single contributor to global revenues.

Established mid-sized players, including Bioderma, Paula’s Choice, and Dr. Jart+, focus on dermatology-driven formulations with a balance of accessibility and clinical positioning. These companies are accelerating adoption by engaging through pharmacies, e-commerce platforms, and masstige pricing strategies that blend affordability with dermatologist endorsement.

Niche-focused providers, such as Aveeno and Clinique, have been expanding their role in barrier-focused skincare but remain regionally stronger rather than globally dominant. Their strategies emphasize specific consumer needs, such as sensitive-skin relief or premium anti-aging regimens, while maintaining loyal customer bases.

Competitive differentiation is shifting from product type alone toward integrated strategies that combine clinical validation, digital education, and sustainable sourcing. Long-term success will likely be determined by the ability of companies to merge affordability, dermatologist credibility, and eco-friendly innovations, ensuring wider penetration across both developed and emerging markets.

Key Developments in Ceramide Complexes Market

  • In January 2025, Ole Henriksen’s Après Skin Multi Use Rescue Crème was launched, featuring ceramides, electrolytes, and vitamins for intensive hydration. It was positioned as both an overnight moisturizer and mask, with barrier repair benefits highlighted, reflecting growing demand for multifunctional, restorative ceramide skincare solutions.
  • In August 2025, Burt’s Bees introduced its “Boosted” Body Lotion, infused with ceramides, niacinamide, and peptides to reinforce skin barrier function. It was deliberately timed ahead of fall routines and designed to meet rising consumer expectations for accessible, science backed barrier repair in mass retail markets.

Scope of the Report

Item Value
Market size (2025) USD 3,002.5 million
Market size (2035) USD 9,652.8 million
Growth rate (CAGR, 2025-2035) 12.4% CAGR
Forecast window 2025-2035
Product type segmentation Creams; Others
Function segmentation Barrier repair; Others
Tier segmentation Masstige; Others
Distribution channels covered Pharmacies; E-commerce; Mass retail; Dermatology clinics
Regions covered North America; Europe; Asia-Pacific; Latin America; Middle East & Africa
Countries covered United States; China; India; Japan; Germany; United Kingdom
Key companies profiled CeraVe (L’Oréal); Eucerin (Beiersdorf); Cetaphil (Galderma); La Roche-Posay (L’Oréal); Aveeno (J&J); Paula’s Choice (Unilever); Dr. Jart+; Shiseido; Bioderma; Clinique
Competitive baseline (2025) CeraVe global value share 9.3%; Others 90.7%
Additional quantitative attributes Creams share 54.5% (USD 1,636.4 million); Barrier repair share 53.5% (USD 1,606.1 million); Masstige share 49.5% (USD 1,484.8 million); United States 2025 size USD 682.39 million

Key Segments

By Function:

  • Barrier repair
  • Anti-aging
  • Sensitive skin relief
  • Hydration

By Product Type:

  • Creams
  • Lotions
  • Gels
  • Balms

By Channel:

  • Pharmacies
  • E-commerce
  • Mass retail
  • Dermatology clinics

By Tier:

  • Mass
  • Masstige
  • Premium

By Region:

  • North America
  • Latin America
  • Europe
  • East Asia
  • South Asia & Pacific
  • Middle East and Africa

Table of Content

  1. Executive Summary
    • Global Market Outlook
    • Demand-side Trends
    • Supply-side Trends
    • Technology Roadmap Analysis
    • Analysis and Recommendations
  2. Market Overview
    • Market Coverage / Taxonomy
    • Market Definition / Scope / Limitations
  3. Market Background
    • Market Dynamics
      • Drivers
      • Restraints
      • Opportunity
      • Trends
    • Scenario Forecast
      • Demand in Optimistic Scenario
      • Demand in Likely Scenario
      • Demand in Conservative Scenario
    • Opportunity Map Analysis
    • Product Life Cycle Analysis
    • Supply Chain Analysis
      • Supply Side Participants and their Roles
        • Producers
        • Mid-Level Participants (Traders/ Agents/ Brokers)
        • Wholesalers and Distributors
      • Value Added and Value Created at Node in the Supply Chain
      • List of Raw Material Suppliers
      • List of Existing and Potential Buyer’s
    • Investment Feasibility Matrix
    • Value Chain Analysis
      • Profit Margin Analysis
      • Wholesalers and Distributors
      • Retailers
    • PESTLE and Porter’s Analysis
    • Regulatory Landscape
      • By Key Regions
      • By Key Countries
    • Regional Parent Market Outlook
    • Production and Consumption Statistics
    • Import and Export Statistics
  4. Global Market Analysis 2020 to 2024 and Forecast, 2025 to 2035
    • Historical Market Size Value (USD Million) & Volume (Units) Analysis, 2020 to 2024
    • Current and Future Market Size Value (USD Million) & Volume (Units) Projections, 2025 to 2035
      • Y-o-Y Growth Trend Analysis
      • Absolute $ Opportunity Analysis
  5. Global Market Analysis 2020 to 2024 and Forecast 2025 to 2035, By Function
    • Introduction / Key Findings
    • Historical Market Size Value (USD Million) & Volume (Units) Analysis By Function, 2020 to 2024
    • Current and Future Market Size Value (USD Million) & Volume (Units) Analysis and Forecast By Function, 2025 to 2035
      • Barrier repair
      • Anti-aging
      • Sensitive skin relief
      • Hydration
    • Y-o-Y Growth Trend Analysis By Function, 2020 to 2024
    • Absolute $ Opportunity Analysis By Function, 2025 to 2035
  6. Global Market Analysis 2020 to 2024 and Forecast 2025 to 2035, By Product Type
    • Introduction / Key Findings
    • Historical Market Size Value (USD Million) & Volume (Units) Analysis By Product Type, 2020 to 2024
    • Current and Future Market Size Value (USD Million) & Volume (Units) Analysis and Forecast By Product Type, 2025 to 2035
      • Creams
      • Lotions
      • Gels
      • Balms
    • Y-o-Y Growth Trend Analysis By Product Type, 2020 to 2024
    • Absolute $ Opportunity Analysis By Product Type, 2025 to 2035
  7. Global Market Analysis 2020 to 2024 and Forecast 2025 to 2035, By Channel
    • Introduction / Key Findings
    • Historical Market Size Value (USD Million) & Volume (Units) Analysis By Channel, 2020 to 2024
    • Current and Future Market Size Value (USD Million) & Volume (Units) Analysis and Forecast By Channel, 2025 to 2035
      • Pharmacies
      • E-commerce
      • Mass retail
      • Dermatology clinics
    • Y-o-Y Growth Trend Analysis By Channel, 2020 to 2024
    • Absolute $ Opportunity Analysis By Channel, 2025 to 2035
  8. Global Market Analysis 2020 to 2024 and Forecast 2025 to 2035, By Tier
    • Introduction / Key Findings
    • Historical Market Size Value (USD Million) & Volume (Units) Analysis By Tier, 2020 to 2024
    • Current and Future Market Size Value (USD Million) & Volume (Units) Analysis and Forecast By Tier, 2025 to 2035
      • Mass
      • Masstige
      • Premium
    • Y-o-Y Growth Trend Analysis By Tier, 2020 to 2024
    • Absolute $ Opportunity Analysis By Tier, 2025 to 2035
  9. Global Market Analysis 2020 to 2024 and Forecast 2025 to 2035, By Region
    • Introduction
    • Historical Market Size Value (USD Million) & Volume (Units) Analysis By Region, 2020 to 2024
    • Current Market Size Value (USD Million) & Volume (Units) Analysis and Forecast By Region, 2025 to 2035
      • North America
      • Latin America
      • Europe
      • East Asia
      • South Asia & Pacific
      • Middle East and Africa
    • Market Attractiveness Analysis By Region
  10. North America Market Analysis 2020 to 2024 and Forecast 2025 to 2035, By Country
    • Historical Market Size Value (USD Million) & Volume (Units) Trend Analysis By Market Taxonomy, 2020 to 2024
    • Market Size Value (USD Million) & Volume (Units) Forecast By Market Taxonomy, 2025 to 2035
      • By Country
        • USA
        • Canada
      • By Function
      • By Product Type
      • By Channel
      • By Tier
    • Market Attractiveness Analysis
      • By Country
      • By Function
      • By Product Type
      • By Channel
      • By Tier
    • Key Takeaways
  11. Latin America Market Analysis 2020 to 2024 and Forecast 2025 to 2035, By Country
    • Historical Market Size Value (USD Million) & Volume (Units) Trend Analysis By Market Taxonomy, 2020 to 2024
    • Market Size Value (USD Million) & Volume (Units) Forecast By Market Taxonomy, 2025 to 2035
      • By Country
        • Brazil
        • Mexico
        • Colombia
        • Rest of Latin America
      • By Function
      • By Product Type
      • By Channel
      • By Tier
    • Market Attractiveness Analysis
      • By Country
      • By Function
      • By Product Type
      • By Channel
      • By Tier
    • Key Takeaways
  12. Europe Market Analysis 2020 to 2024 and Forecast 2025 to 2035, By Country
    • Historical Market Size Value (USD Million) & Volume (Units) Trend Analysis By Market Taxonomy, 2020 to 2024
    • Market Size Value (USD Million) & Volume (Units) Forecast By Market Taxonomy, 2025 to 2035
      • By Country
        • Germany
        • UK
        • France
        • Italy
        • Spain
        • Belgium
        • Netherlands
        • Nordic
        • Switzerland
        • Russia
        • Poland
        • Rest of Europe
      • By Function
      • By Product Type
      • By Channel
      • By Tier
    • Market Attractiveness Analysis
      • By Country
      • By Function
      • By Product Type
      • By Channel
      • By Tier
    • Key Takeaways
  13. East Asia Market Analysis 2020 to 2024 and Forecast 2025 to 2035, By Country
    • Historical Market Size Value (USD Million) & Volume (Units) Trend Analysis By Market Taxonomy, 2020 to 2024
    • Market Size Value (USD Million) & Volume (Units) Forecast By Market Taxonomy, 2025 to 2035
      • By Country
        • China
        • Japan
        • South Korea
      • By Function
      • By Product Type
      • By Channel
      • By Tier
    • Market Attractiveness Analysis
      • By Country
      • By Function
      • By Product Type
      • By Channel
      • By Tier
    • Key Takeaways
  14. South Asia & Pacific Market Analysis 2020 to 2024 and Forecast 2025 to 2035, By Country
    • Historical Market Size Value (USD Million) & Volume (Units) Trend Analysis By Market Taxonomy, 2020 to 2024
    • Market Size Value (USD Million) & Volume (Units) Forecast By Market Taxonomy, 2025 to 2035
      • By Country
        • India
        • Thailand
        • Malaysia
        • Indonesia
        • Singapore
        • Vietnam
        • Australia
        • New Zealand
        • Rest of South Asia
      • By Function
      • By Product Type
      • By Channel
      • By Tier
    • Market Attractiveness Analysis
      • By Country
      • By Function
      • By Product Type
      • By Channel
      • By Tier
    • Key Takeaways
  15. Middle East and Africa Market Analysis 2020 to 2024 and Forecast 2025 to 2035, By Country
    • Historical Market Size Value (USD Million) & Volume (Units) Trend Analysis By Market Taxonomy, 2020 to 2024
    • Market Size Value (USD Million) & Volume (Units) Forecast By Market Taxonomy, 2025 to 2035
      • By Country
        • Turkey
        • UAE
        • Saudi Arabia
        • Israel
        • Other GCC Countries
        • North Africa
        • South Africa
      • By Function
      • By Product Type
      • By Channel
      • By Tier
    • Market Attractiveness Analysis
      • By Country
      • By Function
      • By Product Type
      • By Channel
      • By Tier
    • Key Takeaways
  16. Key Countries Market Analysis
    • USA
      • Pricing Analysis
      • Market Share Analysis, 2024
        • By Function
        • By Product Type
        • By Channel
        • By Tier
    • Canada
      • Pricing Analysis
      • Market Share Analysis, 2024
        • By Function
        • By Product Type
        • By Channel
        • By Tier
    • Brazil
      • Pricing Analysis
      • Market Share Analysis, 2024
        • By Function
        • By Product Type
        • By Channel
        • By Tier
    • Mexico
      • Pricing Analysis
      • Market Share Analysis, 2024
        • By Function
        • By Product Type
        • By Channel
        • By Tier
    • Colombia
      • Pricing Analysis
      • Market Share Analysis, 2024
        • By Function
        • By Product Type
        • By Channel
        • By Tier
    • Germany
      • Pricing Analysis
      • Market Share Analysis, 2024
        • By Function
        • By Product Type
        • By Channel
        • By Tier
    • UK
      • Pricing Analysis
      • Market Share Analysis, 2024
        • By Function
        • By Product Type
        • By Channel
        • By Tier
    • France
      • Pricing Analysis
      • Market Share Analysis, 2024
        • By Function
        • By Product Type
        • By Channel
        • By Tier
    • Italy
      • Pricing Analysis
      • Market Share Analysis, 2024
        • By Function
        • By Product Type
        • By Channel
        • By Tier
    • Spain
      • Pricing Analysis
      • Market Share Analysis, 2024
        • By Function
        • By Product Type
        • By Channel
        • By Tier
    • Belgium
      • Pricing Analysis
      • Market Share Analysis, 2024
        • By Function
        • By Product Type
        • By Channel
        • By Tier
    • Netherlands
      • Pricing Analysis
      • Market Share Analysis, 2024
        • By Function
        • By Product Type
        • By Channel
        • By Tier
    • Nordic
      • Pricing Analysis
      • Market Share Analysis, 2024
        • By Function
        • By Product Type
        • By Channel
        • By Tier
    • Switzerland
      • Pricing Analysis
      • Market Share Analysis, 2024
        • By Function
        • By Product Type
        • By Channel
        • By Tier
    • Russia
      • Pricing Analysis
      • Market Share Analysis, 2024
        • By Function
        • By Product Type
        • By Channel
        • By Tier
    • Poland
      • Pricing Analysis
      • Market Share Analysis, 2024
        • By Function
        • By Product Type
        • By Channel
        • By Tier
    • China
      • Pricing Analysis
      • Market Share Analysis, 2024
        • By Function
        • By Product Type
        • By Channel
        • By Tier
    • Japan
      • Pricing Analysis
      • Market Share Analysis, 2024
        • By Function
        • By Product Type
        • By Channel
        • By Tier
    • South Korea
      • Pricing Analysis
      • Market Share Analysis, 2024
        • By Function
        • By Product Type
        • By Channel
        • By Tier
    • India
      • Pricing Analysis
      • Market Share Analysis, 2024
        • By Function
        • By Product Type
        • By Channel
        • By Tier
    • Thailand
      • Pricing Analysis
      • Market Share Analysis, 2024
        • By Function
        • By Product Type
        • By Channel
        • By Tier
    • Indonesia
      • Pricing Analysis
      • Market Share Analysis, 2024
        • By Function
        • By Product Type
        • By Channel
        • By Tier
    • Australia
      • Pricing Analysis
      • Market Share Analysis, 2024
        • By Function
        • By Product Type
        • By Channel
        • By Tier
    • New Zealand
      • Pricing Analysis
      • Market Share Analysis, 2024
        • By Function
        • By Product Type
        • By Channel
        • By Tier
    • Turkey
      • Pricing Analysis
      • Market Share Analysis, 2024
        • By Function
        • By Product Type
        • By Channel
        • By Tier
    • UAE
      • Pricing Analysis
      • Market Share Analysis, 2024
        • By Function
        • By Product Type
        • By Channel
        • By Tier
    • Saudi Arabia
      • Pricing Analysis
      • Market Share Analysis, 2024
        • By Function
        • By Product Type
        • By Channel
        • By Tier
    • Israel
      • Pricing Analysis
      • Market Share Analysis, 2024
        • By Function
        • By Product Type
        • By Channel
        • By Tier
    • North Africa
      • Pricing Analysis
      • Market Share Analysis, 2024
        • By Function
        • By Product Type
        • By Channel
        • By Tier
    • South Africa
      • Pricing Analysis
      • Market Share Analysis, 2024
        • By Function
        • By Product Type
        • By Channel
        • By Tier
  17. Market Structure Analysis
    • Competition Dashboard
    • Competition Benchmarking
    • Market Share Analysis of Top Players
      • By Regional
      • By Function
      • By Product Type
      • By Channel
      • By Tier
  18. Competition Analysis
    • Competition Deep Dive
      • CeraVe (L’Oréal)
        • Overview
        • Product Portfolio
        • Profitability by Market Segments (Product/Age /Sales Channel/Region)
        • Sales Footprint
        • Strategy Overview
          • Marketing Strategy
          • Product Strategy
          • Channel Strategy
      • Eucerin (Beiersdorf)
        • Overview
        • Product Portfolio
        • Profitability by Market Segments (Product/Age /Sales Channel/Region)
        • Sales Footprint
        • Strategy Overview
          • Marketing Strategy
          • Product Strategy
          • Channel Strategy
      • Cetaphil (Galderma)
        • Overview
        • Product Portfolio
        • Profitability by Market Segments (Product/Age /Sales Channel/Region)
        • Sales Footprint
        • Strategy Overview
          • Marketing Strategy
          • Product Strategy
          • Channel Strategy
      • La Roche-Posay (L’Oréal)
        • Overview
        • Product Portfolio
        • Profitability by Market Segments (Product/Age /Sales Channel/Region)
        • Sales Footprint
        • Strategy Overview
          • Marketing Strategy
          • Product Strategy
          • Channel Strategy
      • Aveeno (J&J)
        • Overview
        • Product Portfolio
        • Profitability by Market Segments (Product/Age /Sales Channel/Region)
        • Sales Footprint
        • Strategy Overview
          • Marketing Strategy
          • Product Strategy
          • Channel Strategy
      • Paula’s Choice (Unilever)
        • Overview
        • Product Portfolio
        • Profitability by Market Segments (Product/Age /Sales Channel/Region)
        • Sales Footprint
        • Strategy Overview
          • Marketing Strategy
          • Product Strategy
          • Channel Strategy
      • Dr. Jart+
        • Overview
        • Product Portfolio
        • Profitability by Market Segments (Product/Age /Sales Channel/Region)
        • Sales Footprint
        • Strategy Overview
          • Marketing Strategy
          • Product Strategy
          • Channel Strategy
      • Shiseido
        • Overview
        • Product Portfolio
        • Profitability by Market Segments (Product/Age /Sales Channel/Region)
        • Sales Footprint
        • Strategy Overview
          • Marketing Strategy
          • Product Strategy
          • Channel Strategy
      • Bioderma
        • Overview
        • Product Portfolio
        • Profitability by Market Segments (Product/Age /Sales Channel/Region)
        • Sales Footprint
        • Strategy Overview
          • Marketing Strategy
          • Product Strategy
          • Channel Strategy
      • Clinique
        • Overview
        • Product Portfolio
        • Profitability by Market Segments (Product/Age /Sales Channel/Region)
        • Sales Footprint
        • Strategy Overview
          • Marketing Strategy
          • Product Strategy
          • Channel Strategy
      • Others
        • Overview
        • Product Portfolio
        • Profitability by Market Segments (Product/Age /Sales Channel/Region)
        • Sales Footprint
        • Strategy Overview
          • Marketing Strategy
          • Product Strategy
          • Channel Strategy
  19. Assumptions & Acronyms Used
  20. Research Methodology

List of Tables

  • Table 1: Global Market Value (USD Million) Forecast by Region, 2020-2035
  • Table 2: Global Market Volume (Units) Forecast by Region, 2020-2035
  • Table 3: Global Market Value (USD Million) Forecast by Function, 2020-2035
  • Table 4: Global Market Volume (Units) Forecast by Function, 2020-2035
  • Table 5: Global Market Value (USD Million) Forecast by Product Type, 2020-2035
  • Table 6: Global Market Volume (Units) Forecast by Product Type, 2020-2035
  • Table 7: Global Market Value (USD Million) Forecast by Channel, 2020-2035
  • Table 8: Global Market Volume (Units) Forecast by Channel, 2020-2035
  • Table 9: Global Market Value (USD Million) Forecast by Tier, 2020-2035
  • Table 10: Global Market Volume (Units) Forecast by Tier, 2020-2035
  • Table 11: North America Market Value (USD Million) Forecast by Country, 2020-2035
  • Table 12: North America Market Volume (Units) Forecast by Country, 2020-2035
  • Table 13: North America Market Value (USD Million) Forecast by Function, 2020-2035
  • Table 14: North America Market Volume (Units) Forecast by Function, 2020-2035
  • Table 15: North America Market Value (USD Million) Forecast by Product Type, 2020-2035
  • Table 16: North America Market Volume (Units) Forecast by Product Type, 2020-2035
  • Table 17: North America Market Value (USD Million) Forecast by Channel, 2020-2035
  • Table 18: North America Market Volume (Units) Forecast by Channel, 2020-2035
  • Table 19: North America Market Value (USD Million) Forecast by Tier, 2020-2035
  • Table 20: North America Market Volume (Units) Forecast by Tier, 2020-2035
  • Table 21: Latin America Market Value (USD Million) Forecast by Country, 2020-2035
  • Table 22: Latin America Market Volume (Units) Forecast by Country, 2020-2035
  • Table 23: Latin America Market Value (USD Million) Forecast by Function, 2020-2035
  • Table 24: Latin America Market Volume (Units) Forecast by Function, 2020-2035
  • Table 25: Latin America Market Value (USD Million) Forecast by Product Type, 2020-2035
  • Table 26: Latin America Market Volume (Units) Forecast by Product Type, 2020-2035
  • Table 27: Latin America Market Value (USD Million) Forecast by Channel, 2020-2035
  • Table 28: Latin America Market Volume (Units) Forecast by Channel, 2020-2035
  • Table 29: Latin America Market Value (USD Million) Forecast by Tier, 2020-2035
  • Table 30: Latin America Market Volume (Units) Forecast by Tier, 2020-2035
  • Table 31: Europe Market Value (USD Million) Forecast by Country, 2020-2035
  • Table 32: Europe Market Volume (Units) Forecast by Country, 2020-2035
  • Table 33: Europe Market Value (USD Million) Forecast by Function, 2020-2035
  • Table 34: Europe Market Volume (Units) Forecast by Function, 2020-2035
  • Table 35: Europe Market Value (USD Million) Forecast by Product Type, 2020-2035
  • Table 36: Europe Market Volume (Units) Forecast by Product Type, 2020-2035
  • Table 37: Europe Market Value (USD Million) Forecast by Channel, 2020-2035
  • Table 38: Europe Market Volume (Units) Forecast by Channel, 2020-2035
  • Table 39: Europe Market Value (USD Million) Forecast by Tier, 2020-2035
  • Table 40: Europe Market Volume (Units) Forecast by Tier, 2020-2035
  • Table 41: East Asia Market Value (USD Million) Forecast by Country, 2020-2035
  • Table 42: East Asia Market Volume (Units) Forecast by Country, 2020-2035
  • Table 43: East Asia Market Value (USD Million) Forecast by Function, 2020-2035
  • Table 44: East Asia Market Volume (Units) Forecast by Function, 2020-2035
  • Table 45: East Asia Market Value (USD Million) Forecast by Product Type, 2020-2035
  • Table 46: East Asia Market Volume (Units) Forecast by Product Type, 2020-2035
  • Table 47: East Asia Market Value (USD Million) Forecast by Channel, 2020-2035
  • Table 48: East Asia Market Volume (Units) Forecast by Channel, 2020-2035
  • Table 49: East Asia Market Value (USD Million) Forecast by Tier, 2020-2035
  • Table 50: East Asia Market Volume (Units) Forecast by Tier, 2020-2035
  • Table 51: South Asia & Pacific Market Value (USD Million) Forecast by Country, 2020-2035
  • Table 52: South Asia & Pacific Market Volume (Units) Forecast by Country, 2020-2035
  • Table 53: South Asia & Pacific Market Value (USD Million) Forecast by Function, 2020-2035
  • Table 54: South Asia & Pacific Market Volume (Units) Forecast by Function, 2020-2035
  • Table 55: South Asia & Pacific Market Value (USD Million) Forecast by Product Type, 2020-2035
  • Table 56: South Asia & Pacific Market Volume (Units) Forecast by Product Type, 2020-2035
  • Table 57: South Asia & Pacific Market Value (USD Million) Forecast by Channel, 2020-2035
  • Table 58: South Asia & Pacific Market Volume (Units) Forecast by Channel, 2020-2035
  • Table 59: South Asia & Pacific Market Value (USD Million) Forecast by Tier, 2020-2035
  • Table 60: South Asia & Pacific Market Volume (Units) Forecast by Tier, 2020-2035
  • Table 61: Middle East and Africa Market Value (USD Million) Forecast by Country, 2020-2035
  • Table 62: Middle East and Africa Market Volume (Units) Forecast by Country, 2020-2035
  • Table 63: Middle East and Africa Market Value (USD Million) Forecast by Function, 2020-2035
  • Table 64: Middle East and Africa Market Volume (Units) Forecast by Function, 2020-2035
  • Table 65: Middle East and Africa Market Value (USD Million) Forecast by Product Type, 2020-2035
  • Table 66: Middle East and Africa Market Volume (Units) Forecast by Product Type, 2020-2035
  • Table 67: Middle East and Africa Market Value (USD Million) Forecast by Channel, 2020-2035
  • Table 68: Middle East and Africa Market Volume (Units) Forecast by Channel, 2020-2035
  • Table 69: Middle East and Africa Market Value (USD Million) Forecast by Tier, 2020-2035
  • Table 70: Middle East and Africa Market Volume (Units) Forecast by Tier, 2020-2035

List of Figures

  • Figure 1: Global Market Value (USD Million) by Function, 2025-2035
  • Figure 2: Global Market Value (USD Million) by Product Type, 2025-2035
  • Figure 3: Global Market Value (USD Million) by Channel, 2025-2035
  • Figure 4: Global Market Value (USD Million) by Tier, 2025-2035
  • Figure 5: Global Market Value (USD Million) by Region, 2025-2035
  • Figure 6: Global Market Value (USD Million) Analysis by Region, 2020-2035
  • Figure 7: Global Market Volume (Units) Analysis by Region, 2020-2035
  • Figure 8: Global Market Value Share (%) and BPS Analysis by Region, 2025-2035
  • Figure 9: Global Market Y-o-Y Growth (%) Projections by Region, 2025-2035
  • Figure 10: Global Market Value (USD Million) Analysis by Function, 2020-2035
  • Figure 11: Global Market Volume (Units) Analysis by Function, 2020-2035
  • Figure 12: Global Market Value Share (%) and BPS Analysis by Function, 2025-2035
  • Figure 13: Global Market Y-o-Y Growth (%) Projections by Function, 2025-2035
  • Figure 14: Global Market Value (USD Million) Analysis by Product Type, 2020-2035
  • Figure 15: Global Market Volume (Units) Analysis by Product Type, 2020-2035
  • Figure 16: Global Market Value Share (%) and BPS Analysis by Product Type, 2025-2035
  • Figure 17: Global Market Y-o-Y Growth (%) Projections by Product Type, 2025-2035
  • Figure 18: Global Market Value (USD Million) Analysis by Channel, 2020-2035
  • Figure 19: Global Market Volume (Units) Analysis by Channel, 2020-2035
  • Figure 20: Global Market Value Share (%) and BPS Analysis by Channel, 2025-2035
  • Figure 21: Global Market Y-o-Y Growth (%) Projections by Channel, 2025-2035
  • Figure 22: Global Market Value (USD Million) Analysis by Tier, 2020-2035
  • Figure 23: Global Market Volume (Units) Analysis by Tier, 2020-2035
  • Figure 24: Global Market Value Share (%) and BPS Analysis by Tier, 2025-2035
  • Figure 25: Global Market Y-o-Y Growth (%) Projections by Tier, 2025-2035
  • Figure 26: Global Market Attractiveness by Function, 2025-2035
  • Figure 27: Global Market Attractiveness by Product Type, 2025-2035
  • Figure 28: Global Market Attractiveness by Channel, 2025-2035
  • Figure 29: Global Market Attractiveness by Tier, 2025-2035
  • Figure 30: Global Market Attractiveness by Region, 2025-2035
  • Figure 31: North America Market Value (USD Million) by Function, 2025-2035
  • Figure 32: North America Market Value (USD Million) by Product Type, 2025-2035
  • Figure 33: North America Market Value (USD Million) by Channel, 2025-2035
  • Figure 34: North America Market Value (USD Million) by Tier, 2025-2035
  • Figure 35: North America Market Value (USD Million) by Country, 2025-2035
  • Figure 36: North America Market Value (USD Million) Analysis by Country, 2020-2035
  • Figure 37: North America Market Volume (Units) Analysis by Country, 2020-2035
  • Figure 38: North America Market Value Share (%) and BPS Analysis by Country, 2025-2035
  • Figure 39: North America Market Y-o-Y Growth (%) Projections by Country, 2025-2035
  • Figure 40: North America Market Value (USD Million) Analysis by Function, 2020-2035
  • Figure 41: North America Market Volume (Units) Analysis by Function, 2020-2035
  • Figure 42: North America Market Value Share (%) and BPS Analysis by Function, 2025-2035
  • Figure 43: North America Market Y-o-Y Growth (%) Projections by Function, 2025-2035
  • Figure 44: North America Market Value (USD Million) Analysis by Product Type, 2020-2035
  • Figure 45: North America Market Volume (Units) Analysis by Product Type, 2020-2035
  • Figure 46: North America Market Value Share (%) and BPS Analysis by Product Type, 2025-2035
  • Figure 47: North America Market Y-o-Y Growth (%) Projections by Product Type, 2025-2035
  • Figure 48: North America Market Value (USD Million) Analysis by Channel, 2020-2035
  • Figure 49: North America Market Volume (Units) Analysis by Channel, 2020-2035
  • Figure 50: North America Market Value Share (%) and BPS Analysis by Channel, 2025-2035
  • Figure 51: North America Market Y-o-Y Growth (%) Projections by Channel, 2025-2035
  • Figure 52: North America Market Value (USD Million) Analysis by Tier, 2020-2035
  • Figure 53: North America Market Volume (Units) Analysis by Tier, 2020-2035
  • Figure 54: North America Market Value Share (%) and BPS Analysis by Tier, 2025-2035
  • Figure 55: North America Market Y-o-Y Growth (%) Projections by Tier, 2025-2035
  • Figure 56: North America Market Attractiveness by Function, 2025-2035
  • Figure 57: North America Market Attractiveness by Product Type, 2025-2035
  • Figure 58: North America Market Attractiveness by Channel, 2025-2035
  • Figure 59: North America Market Attractiveness by Tier, 2025-2035
  • Figure 60: North America Market Attractiveness by Country, 2025-2035
  • Figure 61: Latin America Market Value (USD Million) by Function, 2025-2035
  • Figure 62: Latin America Market Value (USD Million) by Product Type, 2025-2035
  • Figure 63: Latin America Market Value (USD Million) by Channel, 2025-2035
  • Figure 64: Latin America Market Value (USD Million) by Tier, 2025-2035
  • Figure 65: Latin America Market Value (USD Million) by Country, 2025-2035
  • Figure 66: Latin America Market Value (USD Million) Analysis by Country, 2020-2035
  • Figure 67: Latin America Market Volume (Units) Analysis by Country, 2020-2035
  • Figure 68: Latin America Market Value Share (%) and BPS Analysis by Country, 2025-2035
  • Figure 69: Latin America Market Y-o-Y Growth (%) Projections by Country, 2025-2035
  • Figure 70: Latin America Market Value (USD Million) Analysis by Function, 2020-2035
  • Figure 71: Latin America Market Volume (Units) Analysis by Function, 2020-2035
  • Figure 72: Latin America Market Value Share (%) and BPS Analysis by Function, 2025-2035
  • Figure 73: Latin America Market Y-o-Y Growth (%) Projections by Function, 2025-2035
  • Figure 74: Latin America Market Value (USD Million) Analysis by Product Type, 2020-2035
  • Figure 75: Latin America Market Volume (Units) Analysis by Product Type, 2020-2035
  • Figure 76: Latin America Market Value Share (%) and BPS Analysis by Product Type, 2025-2035
  • Figure 77: Latin America Market Y-o-Y Growth (%) Projections by Product Type, 2025-2035
  • Figure 78: Latin America Market Value (USD Million) Analysis by Channel, 2020-2035
  • Figure 79: Latin America Market Volume (Units) Analysis by Channel, 2020-2035
  • Figure 80: Latin America Market Value Share (%) and BPS Analysis by Channel, 2025-2035
  • Figure 81: Latin America Market Y-o-Y Growth (%) Projections by Channel, 2025-2035
  • Figure 82: Latin America Market Value (USD Million) Analysis by Tier, 2020-2035
  • Figure 83: Latin America Market Volume (Units) Analysis by Tier, 2020-2035
  • Figure 84: Latin America Market Value Share (%) and BPS Analysis by Tier, 2025-2035
  • Figure 85: Latin America Market Y-o-Y Growth (%) Projections by Tier, 2025-2035
  • Figure 86: Latin America Market Attractiveness by Function, 2025-2035
  • Figure 87: Latin America Market Attractiveness by Product Type, 2025-2035
  • Figure 88: Latin America Market Attractiveness by Channel, 2025-2035
  • Figure 89: Latin America Market Attractiveness by Tier, 2025-2035
  • Figure 90: Latin America Market Attractiveness by Country, 2025-2035
  • Figure 91: Europe Market Value (USD Million) by Function, 2025-2035
  • Figure 92: Europe Market Value (USD Million) by Product Type, 2025-2035
  • Figure 93: Europe Market Value (USD Million) by Channel, 2025-2035
  • Figure 94: Europe Market Value (USD Million) by Tier, 2025-2035
  • Figure 95: Europe Market Value (USD Million) by Country, 2025-2035
  • Figure 96: Europe Market Value (USD Million) Analysis by Country, 2020-2035
  • Figure 97: Europe Market Volume (Units) Analysis by Country, 2020-2035
  • Figure 98: Europe Market Value Share (%) and BPS Analysis by Country, 2025-2035
  • Figure 99: Europe Market Y-o-Y Growth (%) Projections by Country, 2025-2035
  • Figure 100: Europe Market Value (USD Million) Analysis by Function, 2020-2035
  • Figure 101: Europe Market Volume (Units) Analysis by Function, 2020-2035
  • Figure 102: Europe Market Value Share (%) and BPS Analysis by Function, 2025-2035
  • Figure 103: Europe Market Y-o-Y Growth (%) Projections by Function, 2025-2035
  • Figure 104: Europe Market Value (USD Million) Analysis by Product Type, 2020-2035
  • Figure 105: Europe Market Volume (Units) Analysis by Product Type, 2020-2035
  • Figure 106: Europe Market Value Share (%) and BPS Analysis by Product Type, 2025-2035
  • Figure 107: Europe Market Y-o-Y Growth (%) Projections by Product Type, 2025-2035
  • Figure 108: Europe Market Value (USD Million) Analysis by Channel, 2020-2035
  • Figure 109: Europe Market Volume (Units) Analysis by Channel, 2020-2035
  • Figure 110: Europe Market Value Share (%) and BPS Analysis by Channel, 2025-2035
  • Figure 111: Europe Market Y-o-Y Growth (%) Projections by Channel, 2025-2035
  • Figure 112: Europe Market Value (USD Million) Analysis by Tier, 2020-2035
  • Figure 113: Europe Market Volume (Units) Analysis by Tier, 2020-2035
  • Figure 114: Europe Market Value Share (%) and BPS Analysis by Tier, 2025-2035
  • Figure 115: Europe Market Y-o-Y Growth (%) Projections by Tier, 2025-2035
  • Figure 116: Europe Market Attractiveness by Function, 2025-2035
  • Figure 117: Europe Market Attractiveness by Product Type, 2025-2035
  • Figure 118: Europe Market Attractiveness by Channel, 2025-2035
  • Figure 119: Europe Market Attractiveness by Tier, 2025-2035
  • Figure 120: Europe Market Attractiveness by Country, 2025-2035
  • Figure 121: East Asia Market Value (USD Million) by Function, 2025-2035
  • Figure 122: East Asia Market Value (USD Million) by Product Type, 2025-2035
  • Figure 123: East Asia Market Value (USD Million) by Channel, 2025-2035
  • Figure 124: East Asia Market Value (USD Million) by Tier, 2025-2035
  • Figure 125: East Asia Market Value (USD Million) by Country, 2025-2035
  • Figure 126: East Asia Market Value (USD Million) Analysis by Country, 2020-2035
  • Figure 127: East Asia Market Volume (Units) Analysis by Country, 2020-2035
  • Figure 128: East Asia Market Value Share (%) and BPS Analysis by Country, 2025-2035
  • Figure 129: East Asia Market Y-o-Y Growth (%) Projections by Country, 2025-2035
  • Figure 130: East Asia Market Value (USD Million) Analysis by Function, 2020-2035
  • Figure 131: East Asia Market Volume (Units) Analysis by Function, 2020-2035
  • Figure 132: East Asia Market Value Share (%) and BPS Analysis by Function, 2025-2035
  • Figure 133: East Asia Market Y-o-Y Growth (%) Projections by Function, 2025-2035
  • Figure 134: East Asia Market Value (USD Million) Analysis by Product Type, 2020-2035
  • Figure 135: East Asia Market Volume (Units) Analysis by Product Type, 2020-2035
  • Figure 136: East Asia Market Value Share (%) and BPS Analysis by Product Type, 2025-2035
  • Figure 137: East Asia Market Y-o-Y Growth (%) Projections by Product Type, 2025-2035
  • Figure 138: East Asia Market Value (USD Million) Analysis by Channel, 2020-2035
  • Figure 139: East Asia Market Volume (Units) Analysis by Channel, 2020-2035
  • Figure 140: East Asia Market Value Share (%) and BPS Analysis by Channel, 2025-2035
  • Figure 141: East Asia Market Y-o-Y Growth (%) Projections by Channel, 2025-2035
  • Figure 142: East Asia Market Value (USD Million) Analysis by Tier, 2020-2035
  • Figure 143: East Asia Market Volume (Units) Analysis by Tier, 2020-2035
  • Figure 144: East Asia Market Value Share (%) and BPS Analysis by Tier, 2025-2035
  • Figure 145: East Asia Market Y-o-Y Growth (%) Projections by Tier, 2025-2035
  • Figure 146: East Asia Market Attractiveness by Function, 2025-2035
  • Figure 147: East Asia Market Attractiveness by Product Type, 2025-2035
  • Figure 148: East Asia Market Attractiveness by Channel, 2025-2035
  • Figure 149: East Asia Market Attractiveness by Tier, 2025-2035
  • Figure 150: East Asia Market Attractiveness by Country, 2025-2035
  • Figure 151: South Asia & Pacific Market Value (USD Million) by Function, 2025-2035
  • Figure 152: South Asia & Pacific Market Value (USD Million) by Product Type, 2025-2035
  • Figure 153: South Asia & Pacific Market Value (USD Million) by Channel, 2025-2035
  • Figure 154: South Asia & Pacific Market Value (USD Million) by Tier, 2025-2035
  • Figure 155: South Asia & Pacific Market Value (USD Million) by Country, 2025-2035
  • Figure 156: South Asia & Pacific Market Value (USD Million) Analysis by Country, 2020-2035
  • Figure 157: South Asia & Pacific Market Volume (Units) Analysis by Country, 2020-2035
  • Figure 158: South Asia & Pacific Market Value Share (%) and BPS Analysis by Country, 2025-2035
  • Figure 159: South Asia & Pacific Market Y-o-Y Growth (%) Projections by Country, 2025-2035
  • Figure 160: South Asia & Pacific Market Value (USD Million) Analysis by Function, 2020-2035
  • Figure 161: South Asia & Pacific Market Volume (Units) Analysis by Function, 2020-2035
  • Figure 162: South Asia & Pacific Market Value Share (%) and BPS Analysis by Function, 2025-2035
  • Figure 163: South Asia & Pacific Market Y-o-Y Growth (%) Projections by Function, 2025-2035
  • Figure 164: South Asia & Pacific Market Value (USD Million) Analysis by Product Type, 2020-2035
  • Figure 165: South Asia & Pacific Market Volume (Units) Analysis by Product Type, 2020-2035
  • Figure 166: South Asia & Pacific Market Value Share (%) and BPS Analysis by Product Type, 2025-2035
  • Figure 167: South Asia & Pacific Market Y-o-Y Growth (%) Projections by Product Type, 2025-2035
  • Figure 168: South Asia & Pacific Market Value (USD Million) Analysis by Channel, 2020-2035
  • Figure 169: South Asia & Pacific Market Volume (Units) Analysis by Channel, 2020-2035
  • Figure 170: South Asia & Pacific Market Value Share (%) and BPS Analysis by Channel, 2025-2035
  • Figure 171: South Asia & Pacific Market Y-o-Y Growth (%) Projections by Channel, 2025-2035
  • Figure 172: South Asia & Pacific Market Value (USD Million) Analysis by Tier, 2020-2035
  • Figure 173: South Asia & Pacific Market Volume (Units) Analysis by Tier, 2020-2035
  • Figure 174: South Asia & Pacific Market Value Share (%) and BPS Analysis by Tier, 2025-2035
  • Figure 175: South Asia & Pacific Market Y-o-Y Growth (%) Projections by Tier, 2025-2035
  • Figure 176: South Asia & Pacific Market Attractiveness by Function, 2025-2035
  • Figure 177: South Asia & Pacific Market Attractiveness by Product Type, 2025-2035
  • Figure 178: South Asia & Pacific Market Attractiveness by Channel, 2025-2035
  • Figure 179: South Asia & Pacific Market Attractiveness by Tier, 2025-2035
  • Figure 180: South Asia & Pacific Market Attractiveness by Country, 2025-2035
  • Figure 181: Middle East and Africa Market Value (USD Million) by Function, 2025-2035
  • Figure 182: Middle East and Africa Market Value (USD Million) by Product Type, 2025-2035
  • Figure 183: Middle East and Africa Market Value (USD Million) by Channel, 2025-2035
  • Figure 184: Middle East and Africa Market Value (USD Million) by Tier, 2025-2035
  • Figure 185: Middle East and Africa Market Value (USD Million) by Country, 2025-2035
  • Figure 186: Middle East and Africa Market Value (USD Million) Analysis by Country, 2020-2035
  • Figure 187: Middle East and Africa Market Volume (Units) Analysis by Country, 2020-2035
  • Figure 188: Middle East and Africa Market Value Share (%) and BPS Analysis by Country, 2025-2035
  • Figure 189: Middle East and Africa Market Y-o-Y Growth (%) Projections by Country, 2025-2035
  • Figure 190: Middle East and Africa Market Value (USD Million) Analysis by Function, 2020-2035
  • Figure 191: Middle East and Africa Market Volume (Units) Analysis by Function, 2020-2035
  • Figure 192: Middle East and Africa Market Value Share (%) and BPS Analysis by Function, 2025-2035
  • Figure 193: Middle East and Africa Market Y-o-Y Growth (%) Projections by Function, 2025-2035
  • Figure 194: Middle East and Africa Market Value (USD Million) Analysis by Product Type, 2020-2035
  • Figure 195: Middle East and Africa Market Volume (Units) Analysis by Product Type, 2020-2035
  • Figure 196: Middle East and Africa Market Value Share (%) and BPS Analysis by Product Type, 2025-2035
  • Figure 197: Middle East and Africa Market Y-o-Y Growth (%) Projections by Product Type, 2025-2035
  • Figure 198: Middle East and Africa Market Value (USD Million) Analysis by Channel, 2020-2035
  • Figure 199: Middle East and Africa Market Volume (Units) Analysis by Channel, 2020-2035
  • Figure 200: Middle East and Africa Market Value Share (%) and BPS Analysis by Channel, 2025-2035
  • Figure 201: Middle East and Africa Market Y-o-Y Growth (%) Projections by Channel, 2025-2035
  • Figure 202: Middle East and Africa Market Value (USD Million) Analysis by Tier, 2020-2035
  • Figure 203: Middle East and Africa Market Volume (Units) Analysis by Tier, 2020-2035
  • Figure 204: Middle East and Africa Market Value Share (%) and BPS Analysis by Tier, 2025-2035
  • Figure 205: Middle East and Africa Market Y-o-Y Growth (%) Projections by Tier, 2025-2035
  • Figure 206: Middle East and Africa Market Attractiveness by Function, 2025-2035
  • Figure 207: Middle East and Africa Market Attractiveness by Product Type, 2025-2035
  • Figure 208: Middle East and Africa Market Attractiveness by Channel, 2025-2035
  • Figure 209: Middle East and Africa Market Attractiveness by Tier, 2025-2035
  • Figure 210: Middle East and Africa Market Attractiveness by Country, 2025-2035

Frequently Asked Questions

How big is the Ceramide Complexes Market in 2025?

The global Ceramide Complexes Market is estimated to be valued at USD 3,002.5 million in 2025.

What will be the size of the Ceramide Complexes Market in 2035?

The market size for the Ceramide Complexes Market is projected to reach USD 9,652.8 million by 2035.

How much will be the Ceramide Complexes Market growth between 2025 and 2035?

The Ceramide Complexes Market is expected to grow at a 12.4% CAGR between 2025 and 2035.

What are the key product types in the Ceramide Complexes Market?

The key product types in the Ceramide Complexes Market are creams and other skincare formulations such as lotions, gels, and balms.

Which functional segment is expected to contribute significant share in the Ceramide Complexes Market in 2025?

In terms of function, the barrier repair segment is expected to command 53.5% share in the Ceramide Complexes Market in 2025.

Explore Similar Insights

Future Market Insights

Ceramide Complexes Market

Chat With

MaRIA

Hi There, I am MaRIA, Your Market Research Intelligence Assistant. How may I help you?