Energizing ATP Complexes Market Size and Share Forecast Outlook 2025 to 2035

A valuation of USD 1,201.5 million is estimated for the global Energizing ATP Complexes Market in 2025, with revenues expected to reach USD 4,001.8 million by 2035. This growth represents an expansion of nearly USD 2,800 million over the decade, reflecting a 193% increase in overall size. A CAGR of 12.8% is projected for the forecast period, highlighting strong and sustained demand momentum across regions.
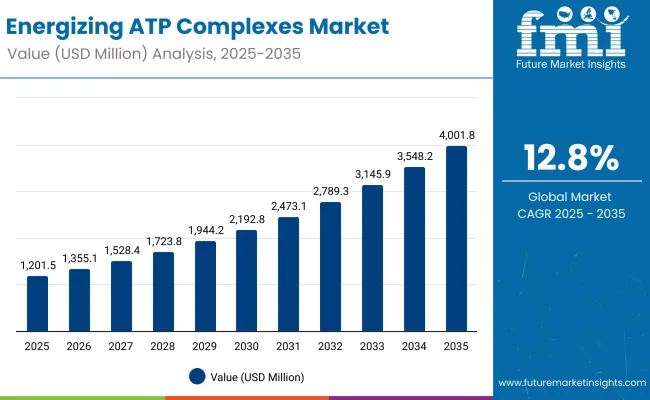
Quick Stats for Energizing ATP Complexes Market

  • Market Value (2025): USD 1,201.5 million
  • Market Forecast Value (2035): USD 4,001.8 million
  • Market Forecast CAGR (2025 to 2035): 12.8%
  • Leading Segment in 2025: Anti-fatigue & Energizing Function (56.6%)
  • Key Growth Regions: Asia-Pacific (China, India), North America, Europe
  • Top Key Players: Shiseido, Estée Lauder, Lancôme, Clarins, SK-II, Laneige, Kiehl’s, La Prairie, DSM-Firmenich, Givaudan

Energizing Atp Complexes Market Value Analysis

Energizing ATP Complexes Market Key Takeaways

Metric Value
Energizing ATP Complexes Market Estimated Value in (2025E) USD 1,201.5 million
Energizing ATP Complexes Market Forecast Value in (2035F) USD 4,001.8 million
Forecast CAGR (2025 to 2035) 12.80%

During the initial phase from 2025 to 2030, the market is expected to advance from USD 1,201.5 million to USD 2,192.8 million, contributing approximately USD 991 million. This portion accounts for more than one-third of the decade’s total growth, with consumer demand being shaped by rising focus on anti-fatigue and energizing functions.

These formulations are anticipated to dominate with a 56.6% market share in 2025, supported by widespread recognition of their role in revitalizing skin energy. In terms of product formats, serums and ampoules are forecast to capture 52.5% share in 2025, benefiting from high efficacy positioning and convenience of application.

The second half of the forecast period, from 2030 to 2035, is projected to deliver stronger momentum, with the market accelerating from USD 2,192.8 million to USD 4,001.8 million. This stage contributes nearly USD 1,809 million, or about two-thirds of decade growth, reflecting greater adoption in Asia and broader premiumization trends. Expansion is further expected to be reinforced by the rising preference for clinical-grade claims, which are forecast to hold 51.5% share in 2025 and gain additional traction through the period.

From 2020 to 2024, awareness of skin vitality and cellular energy renewal was strengthened by innovations in bioactive complexes and consumer preference for high-performance skincare. In 2025, the market is expected to be valued at USD 1,201.5 million, with functional dominance observed in anti-fatigue and energizing benefits.

Competitive dynamics are anticipated to remain fragmented, as over 90% of value is projected to be distributed among multiple global and regional players. By 2035, revenues are forecast to climb to USD 4,001.8 million, driven by premiumization, clinical-grade claims, and growing adoption in emerging economies.

Traditional beauty leaders are expected to pivot toward hybrid models that combine efficacy-driven ingredients with clean-label innovation. Competitive advantage is likely to be shaped less by brand legacy alone and more by innovation pipelines, dermatological credibility, and the ability to address stress-related skin concerns through science-backed formulations.

Why the Energizing ATP Complexes Market is growing?

Growth of the Energizing ATP Complexes Market is being propelled by rising consumer demand for formulations that restore vitality and address skin fatigue. Strong emphasis has been placed on anti-fatigue and energizing benefits, which are projected to dominate the functional landscape with a 56.6% share in 2025.

Expansion is being reinforced by the popularity of serums and ampoules, expected to hold 52.5% share, as concentrated formats are increasingly perceived as effective solutions for skin energy renewal. The shift toward clinical-grade positioning, with a 51.5% share in 2025, is being supported by consumer trust in dermatologist-tested and efficacy-driven claims.

Rapid urbanization and lifestyle-induced stress are anticipated to further boost demand, particularly in Asia-Pacific markets where China and India are forecast to lead growth. Innovation in peptide-based boosters and synergy systems is expected to open new opportunities, while premiumization trends are likely to accelerate adoption across global beauty markets.

Segmental Analysis

The Energizing ATP Complexes Market has been segmented across multiple functional and product-based dimensions to highlight diverse consumer needs and growth opportunities. Segmentation by function emphasizes the dominance of anti-fatigue and energizing benefits, which are increasingly viewed as critical in addressing lifestyle-driven skin stress. Product type segmentation demonstrates how concentrated formats such as serums and ampoules are set to outperform others due to their perceived efficacy and faster results.

Segmentation by claim underlines the rising importance of clinical-grade positioning, where credibility and dermatologist validation are driving adoption. Collectively, these segments showcase how evolving consumer priorities, scientific innovation, and the pursuit of performance-driven formulations are expected to shape competitive strategies and determine long-term market leadership.
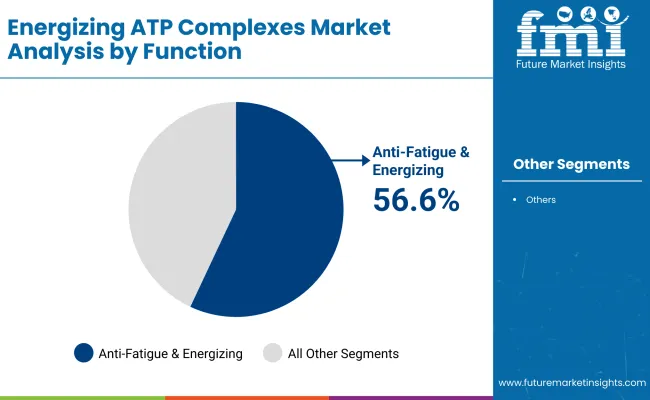
Insights into the Function Segment with Anti-fatigue & Energizing Leading in Market Share

Energizing Atp Complexes Market By Function

Segment Market Value Share, 2025
Anti-fatigue & energizing 56.6%
Others 43.4%

The anti-fatigue and energizing segment is projected to maintain leadership with a 56.6% share in 2025, representing USD 678.8 million. Its dominance is expected to be reinforced by growing consumer awareness of cellular energy renewal and skin revitalization benefits. Adoption will likely accelerate as stress-induced fatigue and environmental aggressors continue to influence skin health.

Broader integration into both premium and accessible skincare ranges is anticipated, extending market reach across diverse demographics. Over the forecast period, the segment’s strong position is expected to be sustained through active ingredient innovation, particularly in bio-complexes and peptide boosters, which will drive consumer confidence. By 2035, anti-fatigue and energizing claims are expected to act as the core growth catalyst of the overall market.
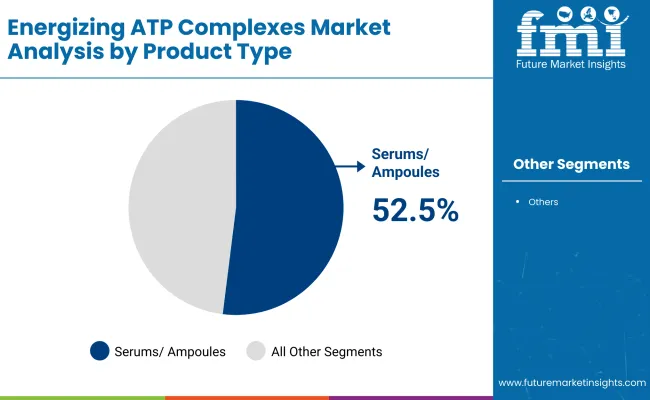
Insights into the Product Type Segment with Serums & Ampoules Dominating Demand

Energizing Atp Complexes Market By Product Type

Segment Market Value Share, 2025
Serums/ampoules 52.5%
Others 47.5%

Serums and ampoules are forecast to hold 52.5% share in 2025, equivalent to USD 630.3 million. Their rapid absorption and concentrated efficacy are projected to keep them ahead of other product categories. Increasing consumer trust in high-potency delivery formats is expected to create strong repeat purchase behavior, especially in urban and premium markets.

Rising demand for lightweight yet effective solutions is anticipated to support their widespread application across multiple geographies. The segment’s expansion will be reinforced by ongoing innovation in formulation textures and active combinations, enhancing both performance and sensorial appeal. By 2035, serums and ampoules are expected to remain the preferred choice, reflecting the convergence of efficacy, convenience, and premium positioning.
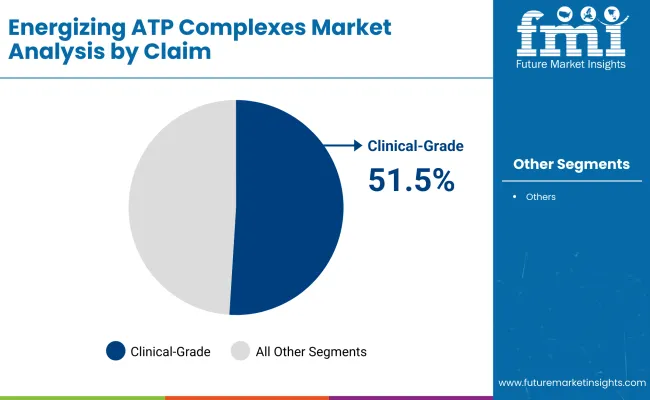
Insights into the Claim Segment with Clinical-grade Dominating Trust-based Adoption

Energizing Atp Complexes Market By Claim

Segment Market Value Share, 2025
Clinical-grade 51.5%
Others 48.5%

Clinical-grade claims are projected to command a 51.5% share in 2025, representing USD 618.2 million. This dominance is expected to be driven by increasing demand for products validated by dermatologists and supported by efficacy trials. Consumer trust in performance-based solutions is likely to enhance willingness to pay premium prices.

Growth is anticipated to be particularly strong in regions where skincare science and safety are prioritized, such as North America and Europe. Expansion in Asia-Pacific is also expected as clinical-grade branding gains traction among younger, health-conscious consumers. Over the forecast period, clinical-grade positioning is projected to become a key differentiator, helping brands navigate competitive intensity while reinforcing authenticity in product offerings.

What are the Drivers, Restraints, and Key Trends of the Energizing ATP Complexes Market?

Complex innovation cycles and evolving consumer expectations are reshaping the Energizing ATP Complexes Market, where high-performing formulations must balance scientific validation with premium positioning. Despite regulatory hurdles and pricing sensitivities, demand is expected to accelerate, supported by global adoption of science-backed skincare solutions.

Clinical-grade Validation and Dermatological Endorsements

Clinical-grade positioning is being advanced as a pivotal growth catalyst, with efficacy validation and dermatological backing transforming consumer decision-making frameworks. Skincare buyers are increasingly expected to prioritize products that demonstrate quantifiable improvements in skin vitality, fatigue reduction, and energy renewal. As transparency in ingredient efficacy becomes a market standard, brands capable of substantiating claims through independent trials are projected to secure both premium pricing power and stronger market penetration.

Over the forecast horizon, clinical-grade validation is anticipated to shift from a differentiator into a baseline requirement, effectively reshaping brand strategies and investment pipelines. This driver is expected to reinforce consumer loyalty while raising the competitive barrier for newer entrants lacking scientific credibility.

Cost Intensification in Bioactive Ingredient Development

The pursuit of next-generation bio-complexes, peptides, and synergy systems is being hindered by rising costs of R&D and manufacturing complexity. Development of advanced energizing formulations requires extensive testing for stability, compatibility, and long-term performance validation, which elevates entry barriers and limits scalability. These escalating costs are expected to pressure mid-tier brands, which may find difficulty sustaining innovation cycles while maintaining competitive pricing.

Furthermore, regional disparities in regulatory frameworks add to compliance burdens, stretching financial resources. Over the long term, cost intensification could lead to consolidation, as only larger multinational players may be able to absorb the rising investment demands. This restraint is anticipated to slow innovation diffusion, delaying widespread adoption of breakthrough formulations in price-sensitive markets.
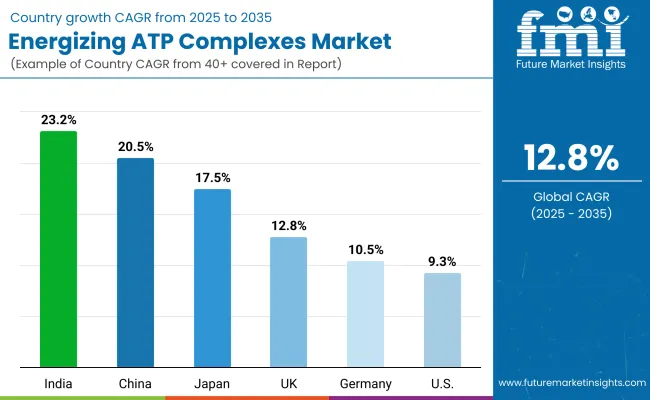
Analysis of Energizing ATP Complexes Market By Key Countries

Energizing Atp Complexes Market Country Wise Analysis

Country CAGR
China 20.5%
USA 9.3%
India 23.2%
UK 12.8%
Germany 10.5%
Japan 17.5%

Growth of the Energizing ATP Complexes Market is expected to display notable regional variation, shaped by consumer awareness, income levels, and innovation pipelines. Asia-Pacific is projected to emerge as the fastest-expanding region, anchored by China with a 20.5% CAGR and India with 23.2% CAGR during 2025 to 2035.

Expansion in these countries is anticipated to be supported by rapid urbanization, lifestyle-driven fatigue concerns, and surging investments in premium skincare. India’s momentum is projected to be reinforced by a young demographic base and a rising preference for clinical-grade solutions, while China’s scale advantages and digital retail ecosystems are expected to accelerate penetration.

Japan is forecast to record a 17.5% CAGR, driven by established consumer trust in science-backed formulations and strong adoption of anti-fatigue skincare. In Europe, steady performance is anticipated, with Germany at 10.5% CAGR and the UK at 12.8%, supported by advanced cosmetic R&D ecosystems and strict quality regulations that prioritize dermatologist-tested solutions.

The USA is projected to expand at a moderate 9.3% CAGR, reflecting market maturity but continued adoption of high-potency serums and ampoules. Overall, Asia-Pacific is expected to outpace global averages, while Europe and North America maintain resilient but comparatively slower growth trajectories.
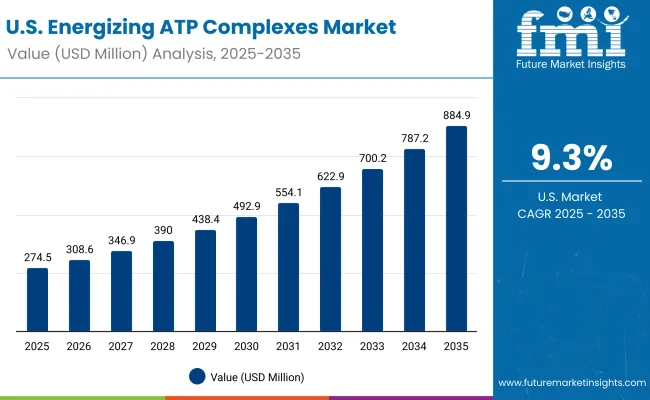
Sales Outlook for Energizing ATP Complexes in the United States

Usa Energizing Atp Complexes Market

Year USA Energizing ATP Complexes Market (USD Million)
2025 274.56
2026 308.65
2027 346.98
2028 390.06
2029 438.49
2030 492.93
2031 554.14
2032 622.94
2033 700.29
2034 787.23
2035 884.98

The USA Energizing ATP Complexes Market is projected to expand at a CAGR of 12.8% between 2025 and 2035, increasing from USD 274.56 million to USD 884.98 million over the period. This sustained momentum is expected to be driven by rising adoption of anti-fatigue and energizing formulations, which accounted for 58% share in 2025. Clinical-grade positioning, supported by dermatologist validation, is anticipated to enhance consumer trust and strengthen premium pricing.

Market progression during the first half of the decade is expected to be gradual, reflecting steady awareness growth, while stronger acceleration is projected in the second half as clean-label and efficacy-driven innovations gain wider traction. Digital retail penetration is forecast to amplify accessibility, ensuring faster uptake across consumer segments.

  • Clinical-grade skincare in the USA is anticipated to consolidate leadership through scientific validation.
  • Premiumization and digital retail strategies are projected to unlock significant long-term growth opportunities.

Growth and Expansion Outlook for Energizing ATP Complexes Market in the United Kingdom

The Energizing ATP Complexes Market in the UK is projected to expand at a CAGR of 12.8% between 2025 and 2035, reflecting resilient growth supported by strong consumer demand for performance-driven skincare. Premium brands are expected to dominate, with clinical-grade positioning gaining prominence as trust in science-backed solutions strengthens.

Digital retail ecosystems are anticipated to accelerate product accessibility, with e-commerce platforms playing a critical role in consumer engagement. The market is projected to benefit from growing emphasis on dermatological testing and clean-label claims, aligning with stringent European quality expectations. By 2035, the UK is expected to represent a significant share of Europe’s overall market, driven by high adoption of serums and ampoules.

  • Premiumization in clinical-grade skincare is anticipated to anchor growth.
  • Digital retail expansion is expected to fuel accessibility and adoption.
  • Regulatory credibility is projected to enhance consumer confidence.

Growth and Expansion Outlook for Energizing ATP Complexes Market in India

The Energizing ATP Complexes Market in India is forecast to grow at a CAGR of 23.2% from 2025 to 2035, making it one of the fastest-expanding markets globally. Rising urbanization and lifestyle-related fatigue are expected to create robust demand for anti-fatigue and energizing solutions. The young demographic base is anticipated to drive adoption of serums and ampoules, particularly in premium urban centers.

Increasing interest in clinical-grade claims is projected to reinforce consumer trust, while affordability concerns are expected to shape localized innovation strategies. Digital-first distribution channels are forecast to amplify reach, creating growth opportunities across both metro and tier-2 cities. By 2035, India is expected to emerge as a leading growth engine within Asia-Pacific, supported by a blend of affordability-driven mass adoption and aspirational premiumization.

  • Young demographics are projected to drive demand momentum.
  • Digital-first channels are expected to expand market penetration.
  • Clinical-grade credibility is anticipated to reinforce consumer trust.

Sales Outlook for Energizing ATP Complexes in China

The Energizing ATP Complexes Market in China is anticipated to grow at a CAGR of 20.5% from 2025 to 2035, cementing its role as the largest growth hub in Asia-Pacific. Expansion is expected to be supported by rapid digital retail adoption and the popularity of energy-boosting serums.

Strong consumer focus on efficacy-driven skincare is projected to strengthen demand for clinical-grade formulations, which are increasingly associated with trust and performance. Cross-border e-commerce channels are anticipated to further diversify product availability, enhancing exposure to global brands. By 2035, China is forecast to consolidate its leadership in both volume and value, reflecting robust consumer spending power and advanced distribution networks.
  • Digital commerce is projected to accelerate national adoption.
  • Serums and ampoules are expected to dominate product preferences.
  • Clinical-grade positioning is anticipated to enhance premium brand visibility.

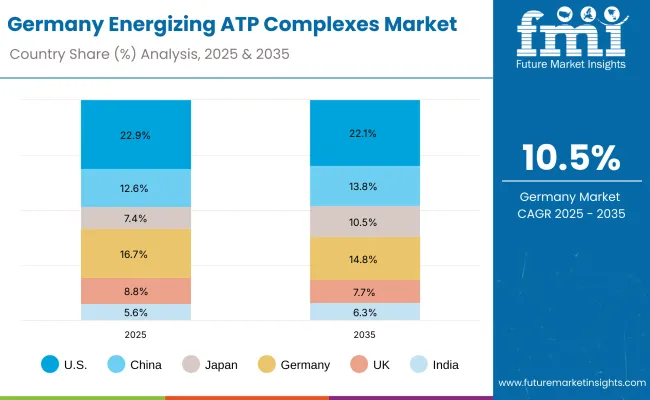
In-depth Analysis of Energizing ATP Complexes in Germany

Germany Energizing Atp Complexes Market

Country 2025
USA 22.9%
China 12.6%
Japan 7.4%
Germany 16.7%
UK 8.8%
India 5.6%
Country 2035
USA 22.1%
China 13.8%
Japan 10.5%
Germany 14.8%
UK 7.7%
India 6.3%

The Energizing ATP Complexes Market in Germany is projected to advance at a CAGR of 10.5% during 2025 to 2035, reflecting steady expansion anchored in Europe’s regulated skincare landscape. German consumers are expected to favor dermatologist-tested and clinical-grade claims, creating sustained demand for validated formulations.

Adoption of serums and ampoules is anticipated to accelerate, supported by strong innovation ecosystems in the country’s cosmetic R&D sector. Growth is also expected to be influenced by rising preference for clean-label and eco-friendly claims, aligning with Europe’s sustainability agenda. Although expansion will be moderate compared with Asia, Germany is projected to remain a key European hub for premium skincare adoption, backed by a discerning consumer base.
  • Clinical-grade claims are expected to reinforce market credibility.
  • Sustainability-driven clean-label positioning is anticipated to gain traction.
  • R&D ecosystems are projected to sustain innovation-led growth.

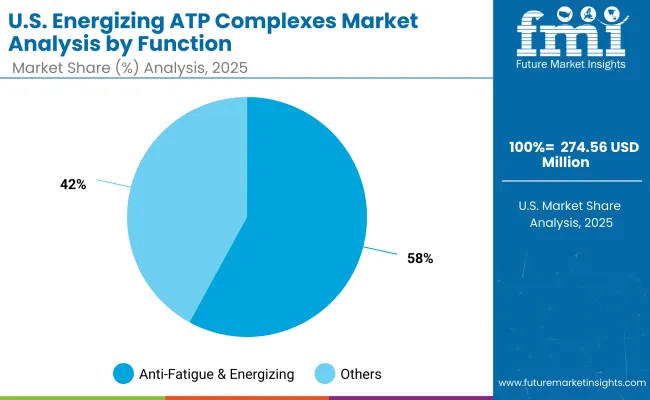
Growth Outlook for Energizing ATP Complexes Market in USA

Usa Energizing Atp Complexes Market By Function

Segment Market Value Share, 2025
Anti-fatigue & energizing 58.0%
Others 42.0%

The Energizing ATP Complexes Market in the United States is projected at USD 274.56 million in 2025. Anti-fatigue & energizing contributes 58.0%, while other functions account for 42.0%, underscoring a clear consumer focus on energy-restoring formulations. This functional dominance reflects heightened awareness of lifestyle-induced skin fatigue, where solutions offering revitalization and energy renewal are perceived as essential.

Growth is further supported by strong adoption of serums and ampoules, which align with consumer expectations for efficacy and convenience. Clinical-grade positioning is anticipated to amplify trust in anti-fatigue solutions, particularly among premium skincare buyers. Over the coming years, integration of scientific validation and clean-label formulations is expected to reinforce the leadership of the anti-fatigue & energizing function, while complementary categories contribute steadily.
  • The USA market accounts for USD 274.56 million in 2025.
  • Anti-fatigue & energizing leads with 58.0% share.
  • Growth is expected to be reinforced by clinical-grade claims and urban lifestyle needs

Opportunity Analysis of China Energizing ATP Complexes Market

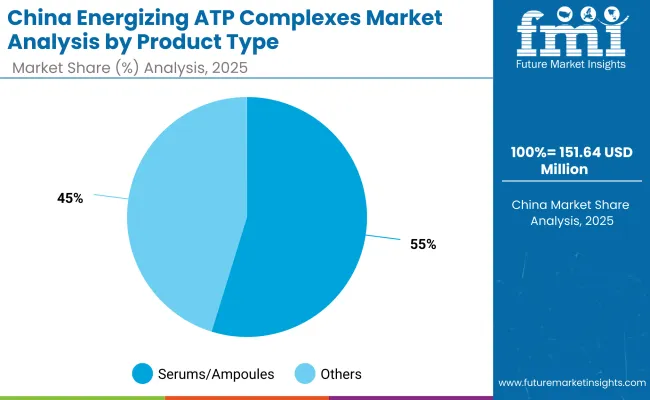
China Energizing Atp Complexes Market By Product Type

Segment Market Value Share, 2025
Serums/ampoules 54.8%
Others 45.2%

The Energizing ATP Complexes Market in China is projected at USD 151.64 million in 2025. Serums and ampoules contribute 54.8%, while other product types account for 45.2%, reflecting consumer preference for concentrated, performance-driven formulations.

This dominance has been reinforced by strong efficacy perception, with serums and ampoules being positioned as fast-acting solutions for fatigue-related skin concerns. Adoption is expected to intensify through digital retail channels, where Chinese consumers are highly responsive to science-backed claims and dermatologist validation.

Clinical-grade positioning is anticipated to further strengthen demand for serums, aligning with the broader cultural emphasis on proof of effectiveness and high-value skincare. Competitive advantage is projected to be driven by innovative textures and ingredient synergies, particularly peptide-based boosters and bioactive complexes. Over the forecast horizon, the serums and ampoules category is expected to consolidate leadership, while other product types maintain a steady but complementary role in China’s rapidly expanding market.
  • China’s market is valued at USD 151.64 million in 2025.
  • Serums and ampoules lead with 54.8% share.
  • Growth is expected to be fueled by digital retail and clinical-grade positioning.

Competitive Landscape of Energizing ATP Complexes Market

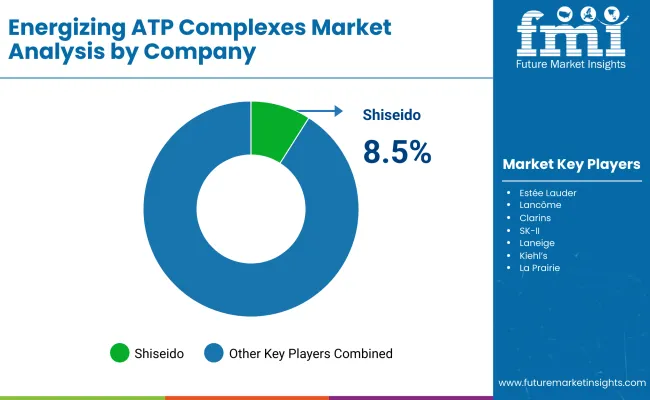
Energizing Atp Complexes Market By Comapany

Company Global Value Share 2025
Shiseido 8.5%
Others 91.5%

The Energizing ATP Complexes Market is moderately fragmented, with global leaders, established mid-sized players, and innovation-driven specialists competing for share. Shiseido is recognized as the leading global player, holding 8.5% of value share in 2025, supported by its strong heritage in skincare innovation and diversified product portfolio across Asia-Pacific, North America, and Europe. Its focus on energizing formulations and clinical-grade positioning has reinforced consumer trust, helping it consolidate leadership.

Other global beauty leaders, including Estée Lauder, Lancôme, Clarins, SK-II, Laneige, Kiehl’s, and La Prairie, are expected to maintain relevance through premium skincare positioning and expansion in digital retail. Their strategies are anticipated to emphasize advanced peptide complexes, clinical-grade claims, and clean-label innovations, aligning with evolving consumer expectations.

Ingredient specialists such as DSM-Firmenich and Givaudan are expected to shape the upstream ecosystem by supplying bioactive complexes and functional boosters to branded manufacturers. This positions them as key enablers of innovation rather than direct competitors in retail channels.

Competitive differentiation is projected to shift toward efficacy validation, dermatological testing, and consumer transparency. Integration of bio-science innovation, digital engagement, and sustainability-driven clean-label claims is expected to define the next phase of competition, with market share concentration anticipated to remain limited beyond the top-tier players.

Key Developments in Energizing ATP Complexes Market

  • In April 2025, Aramore introduced an NAD+ serum treatment designed to enhance cellular energy production by using NAD+ precursors and synergistic compounds. The launch was touted as the first of its kind by a Harvard scientist-founded brand in this formulation category, expanding the functional space for ATP-booster solutions.
  • In August 2025, the skin care market witnessed amplification of barrier-repair formulations and regenerative ingredients such as polynucleotides and bio-scientific boosters. These developments were highlighted in trend reports, with ATP-related energy support being positioned within long-term skin health and injury recovery, rather than just aesthetic revival.

Scope of the Report

Item Value
Quantitative Units USD 1,201.5 million (2025E); USD 4,001.8 million (2035F); 12.8% CAGR (2025 to 2035)
Time Horizon 2025 to 2035 (forecast period)
Functions (2025 share & value) Anti-fatigue & energizing (56.6%; USD 678.8 million); Others (43.4%; USD 521.86 million)
Product Types (2025 share & value) Serums/ampoules (52.5%; USD 630.3 million); Others (47.5%; USD 570.41 million)
Claims (2025 share & value) Clinical-grade (51.5%; USD 618.2 million); Others (48.5%; USD 582.55 million)
Ingredient Systems Covered Adenosine/ribose complexes, CoQ10 blends, Niacinamide synergy systems, Peptide-energy boosters
Distribution Channels Covered E-commerce, Pharmacies, Premium beauty retail, Dermatology clinics
Regions Covered North America, Europe, Asia-Pacific, Latin America, Middle East & Africa
Countries Covered United States, China, India, Japan, Germany, United Kingdom
Key Companies Profiled Shiseido; Estée Lauder; Lancôme; Clarins; SK-II; Laneige; Kiehl’s; La Prairie; DSM-Firmenich; Givaudan
Competitive Snapshot (2025) Shiseido global value share 8.5%; Others 91.5%
Additional Attributes Country CAGRs: India 23.2%, China 20.5%, Japan 17.5%, UK 12.8%, Germany 10.5%, USA 9.3%; leadership expected for serums/ampoules; clinical-grade claims projected to strengthen premium pricing; growth anticipated via digital retail and science-backed efficacy.

Key Segments

By Function:

  • Anti-fatigue & energizing
  • Firming & elasticity support
  • Radiance/brightening
  • Repair & barrier support

By Ingredient Type:

  • Adenosine/ribose complexes
  • CoQ10 blends
  • Niacinamide synergy systems
  • Peptide-energy boosters

By Product Type:

  • Serums/ampoules
  • Creams/lotions
  • Gel creams
  • Sheets/masks

By Sales Channel:

  • E-commerce
  • Pharmacies
  • Dermatology clinics
  • Premium beauty retail

By Claim:

  • Clinical-grade
  • Dermatologist-tested
  • Clean-label
  • Fragrance-free

By Region:

  • North America
  • Latin America
  • Europe
  • East Asia
  • South Asia & Pacific
  • Middle East and Africa

Table of Content

  1. Executive Summary
    • Global Market Outlook
    • Demand-side Trends
    • Supply-side Trends
    • Technology Roadmap Analysis
    • Analysis and Recommendations
  2. Market Overview
    • Market Coverage / Taxonomy
    • Market Definition / Scope / Limitations
  3. Market Background
    • Market Dynamics
      • Drivers
      • Restraints
      • Opportunity
      • Trends
    • Scenario Forecast
      • Demand in Optimistic Scenario
      • Demand in Likely Scenario
      • Demand in Conservative Scenario
    • Opportunity Map Analysis
    • Product Life Cycle Analysis
    • Supply Chain Analysis
    • Investment Feasibility Matrix
    • Value Chain Analysis
    • PESTLE and Porter’s Analysis
    • Regulatory Landscape
    • Regional Parent Market Outlook
    • Production and Consumption Statistics
    • Import and Export Statistics
  4. Global Market Analysis 2020 to 2024 and Forecast, 2025 to 2035
    • Historical Market Size Value (USD Million) & Volume (MT) Analysis, 2020 to 2024
    • Current and Future Market Size Value (USD Million) & Volume (MT) Projections, 2025 to 2035
      • Y-o-Y Growth Trend Analysis
      • Absolute $ Opportunity Analysis
  5. Global Market Pricing Analysis 2020 to 2024 and Forecast 2025 to 2035
  6. Global Market Analysis 2020 to 2024 and Forecast 2025 to 2035, By Function
    • Introduction / Key Findings
    • Historical Market Size Value (USD Million) & Volume (MT) Analysis By Function, 2020 to 2024
    • Current and Future Market Size Value (USD Million) & Volume (MT) Analysis and Forecast By Function, 2025 to 2035
      • Anti-fatigue & energizing
      • Firming & elasticity support
      • Radiance/brightening
      • Repair & barrier support
    • Y-o-Y Growth Trend Analysis By Function, 2020 to 2024
    • Absolute $ Opportunity Analysis By Function, 2025 to 2035
  7. Global Market Analysis 2020 to 2024 and Forecast 2025 to 2035, By Ingredient Type
    • Introduction / Key Findings
    • Historical Market Size Value (USD Million) & Volume (MT) Analysis By Ingredient Type, 2020 to 2024
    • Current and Future Market Size Value (USD Million) & Volume (MT) Analysis and Forecast By Ingredient Type, 2025 to 2035
      • Adenosine/ribose complexes
      • CoQ10 blends
      • Niacinamide synergy systems
      • Peptide-energy boosters
    • Y-o-Y Growth Trend Analysis By Ingredient Type, 2020 to 2024
    • Absolute $ Opportunity Analysis By Ingredient Type, 2025 to 2035
  8. Global Market Analysis 2020 to 2024 and Forecast 2025 to 2035, By Product Type
    • Introduction / Key Findings
    • Historical Market Size Value (USD Million) & Volume (MT) Analysis By Product Type, 2020 to 2024
    • Current and Future Market Size Value (USD Million) & Volume (MT) Analysis and Forecast By Product Type, 2025 to 2035
      • Serums/ampoules
      • Creams/lotions
      • Gel creams
      • Sheets/masks
    • Y-o-Y Growth Trend Analysis By Product Type, 2020 to 2024
    • Absolute $ Opportunity Analysis By Product Type, 2025 to 2035
  9. Global Market Analysis 2020 to 2024 and Forecast 2025 to 2035, By Sales Channel
    • Introduction / Key Findings
    • Historical Market Size Value (USD Million) & Volume (MT) Analysis By Sales Channel, 2020 to 2024
    • Current and Future Market Size Value (USD Million) & Volume (MT) Analysis and Forecast By Sales Channel, 2025 to 2035
      • E-commerce
      • Pharmacies
      • Dermatology clinics
      • Premium beauty retail
    • Y-o-Y Growth Trend Analysis By Sales Channel, 2020 to 2024
    • Absolute $ Opportunity Analysis By Sales Channel, 2025 to 2035
  10. Global Market Analysis 2020 to 2024 and Forecast 2025 to 2035, By Claim
    • Introduction / Key Findings
    • Historical Market Size Value (USD Million) & Volume (MT) Analysis By Claim, 2020 to 2024
    • Current and Future Market Size Value (USD Million) & Volume (MT) Analysis and Forecast By Claim, 2025 to 2035
      • Clinical-grade
      • Dermatologist-tested
      • Clean-label
      • Fragrance-free
    • Y-o-Y Growth Trend Analysis By Claim, 2020 to 2024
    • Absolute $ Opportunity Analysis By Claim, 2025 to 2035
  11. Global Market Analysis 2020 to 2024 and Forecast 2025 to 2035, By Region
    • Introduction
    • Historical Market Size Value (USD Million) & Volume (MT) Analysis By Region, 2020 to 2024
    • Current Market Size Value (USD Million) & Volume (MT) Analysis and Forecast By Region, 2025 to 2035
      • North America
      • Latin America
      • Europe
      • East Asia
      • South Asia & Pacific
      • Middle East and Africa
    • Market Attractiveness Analysis By Region
  12. North America Market Analysis 2020 to 2024 and Forecast 2025 to 2035, By Country
    • Historical Market Size Value (USD Million) & Volume (MT) Trend Analysis By Market Taxonomy, 2020 to 2024
    • Market Size Value (USD Million) & Volume (MT) Forecast By Market Taxonomy, 2025 to 2035
      • By Country
        • USA
        • Canada
      • By Function
      • By Ingredient Type
      • By Product Type
      • By Sales Channel
      • By Claim
    • Market Attractiveness Analysis
      • By Country
      • By Function
      • By Ingredient Type
      • By Product Type
      • By Sales Channel
      • By Claim
    • Key Takeaways
  13. Latin America Market Analysis 2020 to 2024 and Forecast 2025 to 2035, By Country
    • Historical Market Size Value (USD Million) & Volume (MT) Trend Analysis By Market Taxonomy, 2020 to 2024
    • Market Size Value (USD Million) & Volume (MT) Forecast By Market Taxonomy, 2025 to 2035
      • By Country
        • Brazil
        • Mexico
        • Colombia
        • Rest of Latin America
      • By Function
      • By Ingredient Type
      • By Product Type
      • By Sales Channel
      • By Claim
    • Market Attractiveness Analysis
      • By Country
      • By Function
      • By Ingredient Type
      • By Product Type
      • By Sales Channel
      • By Claim
    • Key Takeaways
  14. Europe Market Analysis 2020 to 2024 and Forecast 2025 to 2035, By Country
    • Historical Market Size Value (USD Million) & Volume (MT) Trend Analysis By Market Taxonomy, 2020 to 2024
    • Market Size Value (USD Million) & Volume (MT) Forecast By Market Taxonomy, 2025 to 2035
      • By Country
        • Germany
        • UK
        • France
        • Italy
        • Spain
        • Belgium
        • Netherlands
        • Nordic
        • Switzerland
        • Russia
        • Poland
        • Rest of Europe
      • By Function
      • By Ingredient Type
      • By Product Type
      • By Sales Channel
      • By Claim
    • Market Attractiveness Analysis
      • By Country
      • By Function
      • By Ingredient Type
      • By Product Type
      • By Sales Channel
      • By Claim
    • Key Takeaways
  15. East Asia Market Analysis 2020 to 2024 and Forecast 2025 to 2035, By Country
    • Historical Market Size Value (USD Million) & Volume (MT) Trend Analysis By Market Taxonomy, 2020 to 2024
    • Market Size Value (USD Million) & Volume (MT) Forecast By Market Taxonomy, 2025 to 2035
      • By Country
        • China
        • Japan
        • South Korea
      • By Function
      • By Ingredient Type
      • By Product Type
      • By Sales Channel
      • By Claim
    • Market Attractiveness Analysis
      • By Country
      • By Function
      • By Ingredient Type
      • By Product Type
      • By Sales Channel
      • By Claim
    • Key Takeaways
  16. South Asia & Pacific Market Analysis 2020 to 2024 and Forecast 2025 to 2035, By Country
    • Historical Market Size Value (USD Million) & Volume (MT) Trend Analysis By Market Taxonomy, 2020 to 2024
    • Market Size Value (USD Million) & Volume (MT) Forecast By Market Taxonomy, 2025 to 2035
      • By Country
        • India
        • Thailand
        • Malaysia
        • Indonesia
        • Singapore
        • Vietnam
        • Australia
        • New Zealand
        • Rest of South Asia
      • By Function
      • By Ingredient Type
      • By Product Type
      • By Sales Channel
      • By Claim
    • Market Attractiveness Analysis
      • By Country
      • By Function
      • By Ingredient Type
      • By Product Type
      • By Sales Channel
      • By Claim
    • Key Takeaways
  17. Middle East and Africa Market Analysis 2020 to 2024 and Forecast 2025 to 2035, By Country
    • Historical Market Size Value (USD Million) & Volume (MT) Trend Analysis By Market Taxonomy, 2020 to 2024
    • Market Size Value (USD Million) & Volume (MT) Forecast By Market Taxonomy, 2025 to 2035
      • By Country
        • Turkey
        • UAE
        • Saudi Arabia
        • Israel
        • Other GCC Countries
        • North Africa
        • South Africa
      • By Function
      • By Ingredient Type
      • By Product Type
      • By Sales Channel
      • By Claim
    • Market Attractiveness Analysis
      • By Country
      • By Function
      • By Ingredient Type
      • By Product Type
      • By Sales Channel
      • By Claim
    • Key Takeaways
  18. Key Countries Market Analysis
    • USA
      • Pricing Analysis
      • Market Share Analysis, 2024
        • By Function
        • By Ingredient Type
        • By Product Type
        • By Sales Channel
        • By Claim
    • Canada
      • Pricing Analysis
      • Market Share Analysis, 2024
        • By Function
        • By Ingredient Type
        • By Product Type
        • By Sales Channel
        • By Claim
    • Mexico
      • Pricing Analysis
      • Market Share Analysis, 2024
        • By Function
        • By Ingredient Type
        • By Product Type
        • By Sales Channel
        • By Claim
    • Brazil
      • Pricing Analysis
      • Market Share Analysis, 2024
        • By Function
        • By Ingredient Type
        • By Product Type
        • By Sales Channel
        • By Claim
    • Chile
      • Pricing Analysis
      • Market Share Analysis, 2024
        • By Function
        • By Ingredient Type
        • By Product Type
        • By Sales Channel
        • By Claim
    • Germany
      • Pricing Analysis
      • Market Share Analysis, 2024
        • By Function
        • By Ingredient Type
        • By Product Type
        • By Sales Channel
        • By Claim
    • UK
      • Pricing Analysis
      • Market Share Analysis, 2024
        • By Function
        • By Ingredient Type
        • By Product Type
        • By Sales Channel
        • By Claim
    • Italy
      • Pricing Analysis
      • Market Share Analysis, 2024
        • By Function
        • By Ingredient Type
        • By Product Type
        • By Sales Channel
        • By Claim
    • Spain
      • Pricing Analysis
      • Market Share Analysis, 2024
        • By Function
        • By Ingredient Type
        • By Product Type
        • By Sales Channel
        • By Claim
    • France
      • Pricing Analysis
      • Market Share Analysis, 2024
        • By Function
        • By Ingredient Type
        • By Product Type
        • By Sales Channel
        • By Claim
    • India
      • Pricing Analysis
      • Market Share Analysis, 2024
        • By Function
        • By Ingredient Type
        • By Product Type
        • By Sales Channel
        • By Claim
    • ASEAN
      • Pricing Analysis
      • Market Share Analysis, 2024
        • By Function
        • By Ingredient Type
        • By Product Type
        • By Sales Channel
        • By Claim
    • Australia & New Zealand
      • Pricing Analysis
      • Market Share Analysis, 2024
        • By Function
        • By Ingredient Type
        • By Product Type
        • By Sales Channel
        • By Claim
    • China
      • Pricing Analysis
      • Market Share Analysis, 2024
        • By Function
        • By Ingredient Type
        • By Product Type
        • By Sales Channel
        • By Claim
    • Japan
      • Pricing Analysis
      • Market Share Analysis, 2024
        • By Function
        • By Ingredient Type
        • By Product Type
        • By Sales Channel
        • By Claim
    • South Korea
      • Pricing Analysis
      • Market Share Analysis, 2024
        • By Function
        • By Ingredient Type
        • By Product Type
        • By Sales Channel
        • By Claim
    • Russia
      • Pricing Analysis
      • Market Share Analysis, 2024
        • By Function
        • By Ingredient Type
        • By Product Type
        • By Sales Channel
        • By Claim
    • Poland
      • Pricing Analysis
      • Market Share Analysis, 2024
        • By Function
        • By Ingredient Type
        • By Product Type
        • By Sales Channel
        • By Claim
    • Hungary
      • Pricing Analysis
      • Market Share Analysis, 2024
        • By Function
        • By Ingredient Type
        • By Product Type
        • By Sales Channel
        • By Claim
    • Kingdom of Saudi Arabia
      • Pricing Analysis
      • Market Share Analysis, 2024
        • By Function
        • By Ingredient Type
        • By Product Type
        • By Sales Channel
        • By Claim
    • Turkiye
      • Pricing Analysis
      • Market Share Analysis, 2024
        • By Function
        • By Ingredient Type
        • By Product Type
        • By Sales Channel
        • By Claim
    • South Africa
      • Pricing Analysis
      • Market Share Analysis, 2024
        • By Function
        • By Ingredient Type
        • By Product Type
        • By Sales Channel
        • By Claim
  19. Market Structure Analysis
    • Competition Dashboard
    • Competition Benchmarking
    • Market Share Analysis of Top Players
      • By Regional
      • By Function
      • By Ingredient Type
      • By Product Type
      • By Sales Channel
      • By Claim
  20. Competition Analysis
    • Competition Deep Dive
      • Shiseido
        • Overview
        • Product Portfolio
        • Profitability by Market Segments (Product/Age /Sales Channel/Region)
        • Sales Footprint
        • Strategy Overview
        • Estée Lauder
        • Lancôme
        • Clarins
        • SK-II
        • Laneige
        • Kiehl’s
        • La Prairie
        • DSM-Firmenich
        • Givaudan
  21. Assumptions & Acronyms Used
  22. Research Methodology

List of Tables

  • Table 1: Global Market Value (USD Million) Forecast by Region, 2020-2035
  • Table 2: Global Market Volume (MT) Forecast by Region, 2020-2035
  • Table 3: Global Market Value (USD Million) Forecast by Function, 2020-2035
  • Table 4: Global Market Volume (MT) Forecast by Function, 2020-2035
  • Table 5: Global Market Value (USD Million) Forecast by Ingredient Type, 2020-2035
  • Table 6: Global Market Volume (MT) Forecast by Ingredient Type, 2020-2035
  • Table 7: Global Market Value (USD Million) Forecast by Product Type, 2020-2035
  • Table 8: Global Market Volume (MT) Forecast by Product Type, 2020-2035
  • Table 9: Global Market Value (USD Million) Forecast by Sales Channel, 2020-2035
  • Table 10: Global Market Volume (MT) Forecast by Sales Channel, 2020-2035
  • Table 11: Global Market Value (USD Million) Forecast by Claim, 2020-2035
  • Table 12: Global Market Volume (MT) Forecast by Claim, 2020-2035
  • Table 13: North America Market Value (USD Million) Forecast by Country, 2020-2035
  • Table 14: North America Market Volume (MT) Forecast by Country, 2020-2035
  • Table 15: North America Market Value (USD Million) Forecast by Function, 2020-2035
  • Table 16: North America Market Volume (MT) Forecast by Function, 2020-2035
  • Table 17: North America Market Value (USD Million) Forecast by Ingredient Type, 2020-2035
  • Table 18: North America Market Volume (MT) Forecast by Ingredient Type, 2020-2035
  • Table 19: North America Market Value (USD Million) Forecast by Product Type, 2020-2035
  • Table 20: North America Market Volume (MT) Forecast by Product Type, 2020-2035
  • Table 21: North America Market Value (USD Million) Forecast by Sales Channel, 2020-2035
  • Table 22: North America Market Volume (MT) Forecast by Sales Channel, 2020-2035
  • Table 23: North America Market Value (USD Million) Forecast by Claim, 2020-2035
  • Table 24: North America Market Volume (MT) Forecast by Claim, 2020-2035
  • Table 25: Latin America Market Value (USD Million) Forecast by Country, 2020-2035
  • Table 26: Latin America Market Volume (MT) Forecast by Country, 2020-2035
  • Table 27: Latin America Market Value (USD Million) Forecast by Function, 2020-2035
  • Table 28: Latin America Market Volume (MT) Forecast by Function, 2020-2035
  • Table 29: Latin America Market Value (USD Million) Forecast by Ingredient Type, 2020-2035
  • Table 30: Latin America Market Volume (MT) Forecast by Ingredient Type, 2020-2035
  • Table 31: Latin America Market Value (USD Million) Forecast by Product Type, 2020-2035
  • Table 32: Latin America Market Volume (MT) Forecast by Product Type, 2020-2035
  • Table 33: Latin America Market Value (USD Million) Forecast by Sales Channel, 2020-2035
  • Table 34: Latin America Market Volume (MT) Forecast by Sales Channel, 2020-2035
  • Table 35: Latin America Market Value (USD Million) Forecast by Claim, 2020-2035
  • Table 36: Latin America Market Volume (MT) Forecast by Claim, 2020-2035
  • Table 37: Europe Market Value (USD Million) Forecast by Country, 2020-2035
  • Table 38: Europe Market Volume (MT) Forecast by Country, 2020-2035
  • Table 39: Europe Market Value (USD Million) Forecast by Function, 2020-2035
  • Table 40: Europe Market Volume (MT) Forecast by Function, 2020-2035
  • Table 41: Europe Market Value (USD Million) Forecast by Ingredient Type, 2020-2035
  • Table 42: Europe Market Volume (MT) Forecast by Ingredient Type, 2020-2035
  • Table 43: Europe Market Value (USD Million) Forecast by Product Type, 2020-2035
  • Table 44: Europe Market Volume (MT) Forecast by Product Type, 2020-2035
  • Table 45: Europe Market Value (USD Million) Forecast by Sales Channel, 2020-2035
  • Table 46: Europe Market Volume (MT) Forecast by Sales Channel, 2020-2035
  • Table 47: Europe Market Value (USD Million) Forecast by Claim, 2020-2035
  • Table 48: Europe Market Volume (MT) Forecast by Claim, 2020-2035
  • Table 49: East Asia Market Value (USD Million) Forecast by Country, 2020-2035
  • Table 50: East Asia Market Volume (MT) Forecast by Country, 2020-2035
  • Table 51: East Asia Market Value (USD Million) Forecast by Function, 2020-2035
  • Table 52: East Asia Market Volume (MT) Forecast by Function, 2020-2035
  • Table 53: East Asia Market Value (USD Million) Forecast by Ingredient Type, 2020-2035
  • Table 54: East Asia Market Volume (MT) Forecast by Ingredient Type, 2020-2035
  • Table 55: East Asia Market Value (USD Million) Forecast by Product Type, 2020-2035
  • Table 56: East Asia Market Volume (MT) Forecast by Product Type, 2020-2035
  • Table 57: East Asia Market Value (USD Million) Forecast by Sales Channel, 2020-2035
  • Table 58: East Asia Market Volume (MT) Forecast by Sales Channel, 2020-2035
  • Table 59: East Asia Market Value (USD Million) Forecast by Claim, 2020-2035
  • Table 60: East Asia Market Volume (MT) Forecast by Claim, 2020-2035
  • Table 61: South Asia & Pacific Market Value (USD Million) Forecast by Country, 2020-2035
  • Table 62: South Asia & Pacific Market Volume (MT) Forecast by Country, 2020-2035
  • Table 63: South Asia & Pacific Market Value (USD Million) Forecast by Function, 2020-2035
  • Table 64: South Asia & Pacific Market Volume (MT) Forecast by Function, 2020-2035
  • Table 65: South Asia & Pacific Market Value (USD Million) Forecast by Ingredient Type, 2020-2035
  • Table 66: South Asia & Pacific Market Volume (MT) Forecast by Ingredient Type, 2020-2035
  • Table 67: South Asia & Pacific Market Value (USD Million) Forecast by Product Type, 2020-2035
  • Table 68: South Asia & Pacific Market Volume (MT) Forecast by Product Type, 2020-2035
  • Table 69: South Asia & Pacific Market Value (USD Million) Forecast by Sales Channel, 2020-2035
  • Table 70: South Asia & Pacific Market Volume (MT) Forecast by Sales Channel, 2020-2035
  • Table 71: South Asia & Pacific Market Value (USD Million) Forecast by Claim, 2020-2035
  • Table 72: South Asia & Pacific Market Volume (MT) Forecast by Claim, 2020-2035
  • Table 73: Middle East and Africa Market Value (USD Million) Forecast by Country, 2020-2035
  • Table 74: Middle East and Africa Market Volume (MT) Forecast by Country, 2020-2035
  • Table 75: Middle East and Africa Market Value (USD Million) Forecast by Function, 2020-2035
  • Table 76: Middle East and Africa Market Volume (MT) Forecast by Function, 2020-2035
  • Table 77: Middle East and Africa Market Value (USD Million) Forecast by Ingredient Type, 2020-2035
  • Table 78: Middle East and Africa Market Volume (MT) Forecast by Ingredient Type, 2020-2035
  • Table 79: Middle East and Africa Market Value (USD Million) Forecast by Product Type, 2020-2035
  • Table 80: Middle East and Africa Market Volume (MT) Forecast by Product Type, 2020-2035
  • Table 81: Middle East and Africa Market Value (USD Million) Forecast by Sales Channel, 2020-2035
  • Table 82: Middle East and Africa Market Volume (MT) Forecast by Sales Channel, 2020-2035
  • Table 83: Middle East and Africa Market Value (USD Million) Forecast by Claim, 2020-2035
  • Table 84: Middle East and Africa Market Volume (MT) Forecast by Claim, 2020-2035

List of Figures

  • Figure 1: Global Market Volume (MT) Forecast 2020-2035
  • Figure 2: Global Market Pricing Analysis
  • Figure 3: Global Market Value (USD Million) Forecast 2020-2035
  • Figure 4: Global Market Value Share and BPS Analysis by Function, 2025 and 2035
  • Figure 5: Global Market Y-o-Y Growth Comparison by Function, 2025-2035
  • Figure 6: Global Market Attractiveness Analysis by Function
  • Figure 7: Global Market Value Share and BPS Analysis by Ingredient Type, 2025 and 2035
  • Figure 8: Global Market Y-o-Y Growth Comparison by Ingredient Type, 2025-2035
  • Figure 9: Global Market Attractiveness Analysis by Ingredient Type
  • Figure 10: Global Market Value Share and BPS Analysis by Product Type, 2025 and 2035
  • Figure 11: Global Market Y-o-Y Growth Comparison by Product Type, 2025-2035
  • Figure 12: Global Market Attractiveness Analysis by Product Type
  • Figure 13: Global Market Value Share and BPS Analysis by Sales Channel, 2025 and 2035
  • Figure 14: Global Market Y-o-Y Growth Comparison by Sales Channel, 2025-2035
  • Figure 15: Global Market Attractiveness Analysis by Sales Channel
  • Figure 16: Global Market Value Share and BPS Analysis by Claim, 2025 and 2035
  • Figure 17: Global Market Y-o-Y Growth Comparison by Claim, 2025-2035
  • Figure 18: Global Market Attractiveness Analysis by Claim
  • Figure 19: Global Market Value (USD Million) Share and BPS Analysis by Region, 2025 and 2035
  • Figure 20: Global Market Y-o-Y Growth Comparison by Region, 2025-2035
  • Figure 21: Global Market Attractiveness Analysis by Region
  • Figure 22: North America Market Incremental $ Opportunity, 2025-2035
  • Figure 23: Latin America Market Incremental $ Opportunity, 2025-2035
  • Figure 24: Europe Market Incremental $ Opportunity, 2025-2035
  • Figure 25: East Asia Market Incremental $ Opportunity, 2025-2035
  • Figure 26: South Asia & Pacific Market Incremental $ Opportunity, 2025-2035
  • Figure 27: Middle East and Africa Market Incremental $ Opportunity, 2025-2035
  • Figure 28: North America Market Value Share and BPS Analysis by Country, 2025 and 2035
  • Figure 29: North America Market Value Share and BPS Analysis by Function, 2025 and 2035
  • Figure 30: North America Market Y-o-Y Growth Comparison by Function, 2025-2035
  • Figure 31: North America Market Attractiveness Analysis by Function
  • Figure 32: North America Market Value Share and BPS Analysis by Ingredient Type, 2025 and 2035
  • Figure 33: North America Market Y-o-Y Growth Comparison by Ingredient Type, 2025-2035
  • Figure 34: North America Market Attractiveness Analysis by Ingredient Type
  • Figure 35: North America Market Value Share and BPS Analysis by Product Type, 2025 and 2035
  • Figure 36: North America Market Y-o-Y Growth Comparison by Product Type, 2025-2035
  • Figure 37: North America Market Attractiveness Analysis by Product Type
  • Figure 38: North America Market Value Share and BPS Analysis by Sales Channel, 2025 and 2035
  • Figure 39: North America Market Y-o-Y Growth Comparison by Sales Channel, 2025-2035
  • Figure 40: North America Market Attractiveness Analysis by Sales Channel
  • Figure 41: North America Market Value Share and BPS Analysis by Claim, 2025 and 2035
  • Figure 42: North America Market Y-o-Y Growth Comparison by Claim, 2025-2035
  • Figure 43: North America Market Attractiveness Analysis by Claim
  • Figure 44: Latin America Market Value Share and BPS Analysis by Country, 2025 and 2035
  • Figure 45: Latin America Market Value Share and BPS Analysis by Function, 2025 and 2035
  • Figure 46: Latin America Market Y-o-Y Growth Comparison by Function, 2025-2035
  • Figure 47: Latin America Market Attractiveness Analysis by Function
  • Figure 48: Latin America Market Value Share and BPS Analysis by Ingredient Type, 2025 and 2035
  • Figure 49: Latin America Market Y-o-Y Growth Comparison by Ingredient Type, 2025-2035
  • Figure 50: Latin America Market Attractiveness Analysis by Ingredient Type
  • Figure 51: Latin America Market Value Share and BPS Analysis by Product Type, 2025 and 2035
  • Figure 52: Latin America Market Y-o-Y Growth Comparison by Product Type, 2025-2035
  • Figure 53: Latin America Market Attractiveness Analysis by Product Type
  • Figure 54: Latin America Market Value Share and BPS Analysis by Sales Channel, 2025 and 2035
  • Figure 55: Latin America Market Y-o-Y Growth Comparison by Sales Channel, 2025-2035
  • Figure 56: Latin America Market Attractiveness Analysis by Sales Channel
  • Figure 57: Latin America Market Value Share and BPS Analysis by Claim, 2025 and 2035
  • Figure 58: Latin America Market Y-o-Y Growth Comparison by Claim, 2025-2035
  • Figure 59: Latin America Market Attractiveness Analysis by Claim
  • Figure 60: Europe Market Value Share and BPS Analysis by Country, 2025 and 2035
  • Figure 61: Europe Market Value Share and BPS Analysis by Function, 2025 and 2035
  • Figure 62: Europe Market Y-o-Y Growth Comparison by Function, 2025-2035
  • Figure 63: Europe Market Attractiveness Analysis by Function
  • Figure 64: Europe Market Value Share and BPS Analysis by Ingredient Type, 2025 and 2035
  • Figure 65: Europe Market Y-o-Y Growth Comparison by Ingredient Type, 2025-2035
  • Figure 66: Europe Market Attractiveness Analysis by Ingredient Type
  • Figure 67: Europe Market Value Share and BPS Analysis by Product Type, 2025 and 2035
  • Figure 68: Europe Market Y-o-Y Growth Comparison by Product Type, 2025-2035
  • Figure 69: Europe Market Attractiveness Analysis by Product Type
  • Figure 70: Europe Market Value Share and BPS Analysis by Sales Channel, 2025 and 2035
  • Figure 71: Europe Market Y-o-Y Growth Comparison by Sales Channel, 2025-2035
  • Figure 72: Europe Market Attractiveness Analysis by Sales Channel
  • Figure 73: Europe Market Value Share and BPS Analysis by Claim, 2025 and 2035
  • Figure 74: Europe Market Y-o-Y Growth Comparison by Claim, 2025-2035
  • Figure 75: Europe Market Attractiveness Analysis by Claim
  • Figure 76: East Asia Market Value Share and BPS Analysis by Country, 2025 and 2035
  • Figure 77: East Asia Market Value Share and BPS Analysis by Function, 2025 and 2035
  • Figure 78: East Asia Market Y-o-Y Growth Comparison by Function, 2025-2035
  • Figure 79: East Asia Market Attractiveness Analysis by Function
  • Figure 80: East Asia Market Value Share and BPS Analysis by Ingredient Type, 2025 and 2035
  • Figure 81: East Asia Market Y-o-Y Growth Comparison by Ingredient Type, 2025-2035
  • Figure 82: East Asia Market Attractiveness Analysis by Ingredient Type
  • Figure 83: East Asia Market Value Share and BPS Analysis by Product Type, 2025 and 2035
  • Figure 84: East Asia Market Y-o-Y Growth Comparison by Product Type, 2025-2035
  • Figure 85: East Asia Market Attractiveness Analysis by Product Type
  • Figure 86: East Asia Market Value Share and BPS Analysis by Sales Channel, 2025 and 2035
  • Figure 87: East Asia Market Y-o-Y Growth Comparison by Sales Channel, 2025-2035
  • Figure 88: East Asia Market Attractiveness Analysis by Sales Channel
  • Figure 89: East Asia Market Value Share and BPS Analysis by Claim, 2025 and 2035
  • Figure 90: East Asia Market Y-o-Y Growth Comparison by Claim, 2025-2035
  • Figure 91: East Asia Market Attractiveness Analysis by Claim
  • Figure 92: South Asia & Pacific Market Value Share and BPS Analysis by Country, 2025 and 2035
  • Figure 93: South Asia & Pacific Market Value Share and BPS Analysis by Function, 2025 and 2035
  • Figure 94: South Asia & Pacific Market Y-o-Y Growth Comparison by Function, 2025-2035
  • Figure 95: South Asia & Pacific Market Attractiveness Analysis by Function
  • Figure 96: South Asia & Pacific Market Value Share and BPS Analysis by Ingredient Type, 2025 and 2035
  • Figure 97: South Asia & Pacific Market Y-o-Y Growth Comparison by Ingredient Type, 2025-2035
  • Figure 98: South Asia & Pacific Market Attractiveness Analysis by Ingredient Type
  • Figure 99: South Asia & Pacific Market Value Share and BPS Analysis by Product Type, 2025 and 2035
  • Figure 100: South Asia & Pacific Market Y-o-Y Growth Comparison by Product Type, 2025-2035
  • Figure 101: South Asia & Pacific Market Attractiveness Analysis by Product Type
  • Figure 102: South Asia & Pacific Market Value Share and BPS Analysis by Sales Channel, 2025 and 2035
  • Figure 103: South Asia & Pacific Market Y-o-Y Growth Comparison by Sales Channel, 2025-2035
  • Figure 104: South Asia & Pacific Market Attractiveness Analysis by Sales Channel
  • Figure 105: South Asia & Pacific Market Value Share and BPS Analysis by Claim, 2025 and 2035
  • Figure 106: South Asia & Pacific Market Y-o-Y Growth Comparison by Claim, 2025-2035
  • Figure 107: South Asia & Pacific Market Attractiveness Analysis by Claim
  • Figure 108: Middle East and Africa Market Value Share and BPS Analysis by Country, 2025 and 2035
  • Figure 109: Middle East and Africa Market Value Share and BPS Analysis by Function, 2025 and 2035
  • Figure 110: Middle East and Africa Market Y-o-Y Growth Comparison by Function, 2025-2035
  • Figure 111: Middle East and Africa Market Attractiveness Analysis by Function
  • Figure 112: Middle East and Africa Market Value Share and BPS Analysis by Ingredient Type, 2025 and 2035
  • Figure 113: Middle East and Africa Market Y-o-Y Growth Comparison by Ingredient Type, 2025-2035
  • Figure 114: Middle East and Africa Market Attractiveness Analysis by Ingredient Type
  • Figure 115: Middle East and Africa Market Value Share and BPS Analysis by Product Type, 2025 and 2035
  • Figure 116: Middle East and Africa Market Y-o-Y Growth Comparison by Product Type, 2025-2035
  • Figure 117: Middle East and Africa Market Attractiveness Analysis by Product Type
  • Figure 118: Middle East and Africa Market Value Share and BPS Analysis by Sales Channel, 2025 and 2035
  • Figure 119: Middle East and Africa Market Y-o-Y Growth Comparison by Sales Channel, 2025-2035
  • Figure 120: Middle East and Africa Market Attractiveness Analysis by Sales Channel
  • Figure 121: Middle East and Africa Market Value Share and BPS Analysis by Claim, 2025 and 2035
  • Figure 122: Middle East and Africa Market Y-o-Y Growth Comparison by Claim, 2025-2035
  • Figure 123: Middle East and Africa Market Attractiveness Analysis by Claim
  • Figure 124: Global Market - Tier Structure Analysis
  • Figure 125: Global Market - Company Share Analysis

Frequently Asked Questions

How big is the Energizing ATP Complexes Market in 2025?

The global Energizing ATP Complexes Market is estimated to be valued at USD 1,201.5 million in 2025.

What will be the size of the Energizing ATP Complexes Market in 2035?

The market size for the Energizing ATP Complexes Market is projected to reach USD 4,001.8 million by 2035.

How much will be the Energizing ATP Complexes Market growth between 2025 and 2035?

The Energizing ATP Complexes Market is expected to grow at a CAGR of 12.8% between 2025 and 2035.

What are the key product types in the Energizing ATP Complexes Market?

The key product types in the Energizing ATP Complexes Market are serums/ampoules and other skincare formats such as creams, gels, and masks.

Which function segment will contribute significant share in the Energizing ATP Complexes Market in 2025?

In terms of function, the anti-fatigue & energizing segment is projected to command 56.6% share of the Energizing ATP Complexes Market in 2025.

Explore Similar Insights

Future Market Insights

Energizing ATP Complexes Market

Chat With

MaRIA

Hi There, I am MaRIA, Your Market Research Intelligence Assistant. How may I help you?