Smart SPF Complexes Market Size and Share Forecast Outlook 2025 to 2035

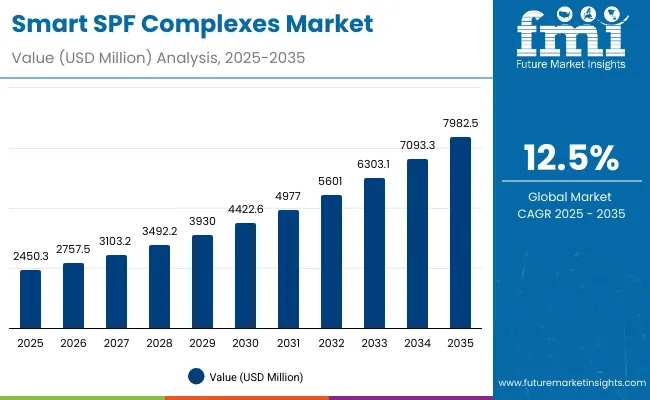
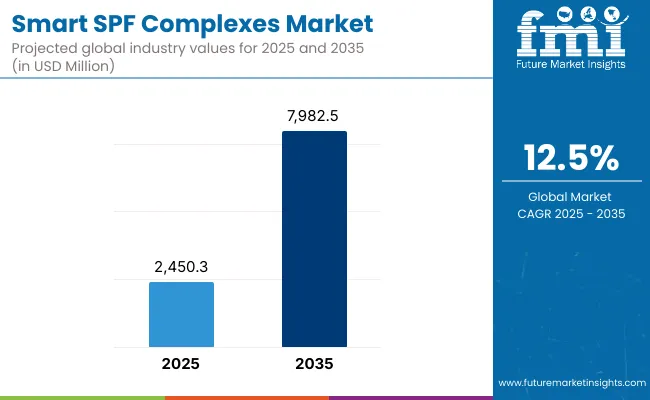
The global Smart SPF Complexes Market is expected to record a valuation of USD 2,450.3 million in 2025 and USD 7,982.5 million in 2035, with an increase of USD 5,532.2 million, which equals a growth of 193% over the decade. The overall expansion represents a CAGR of 12.5% and a 2X increase in market size.
Smart Spf Complexes Market Value Analysis

Quick Stats for Global Smart SPF Complexes Market

  • Global Smart SPF Complexes Market Value (2025): USD 2,450.3 million
  • Global Smart SPF Complexes Market Forecast Value (2035): USD 7,982.5 million
  • Global Smart SPF Complexes Market Forecast CAGR: 12.5%
  • Leading Segment in Global Smart SPF Complexes Market in 2025: UV protection (57.6%)
  • Key Growth Regions in the Global Smart SPF Complexes Market: Asia-Pacific, North America, Europe
  • Top Key Players in Global Smart SPF Complexes Market: Supergoop!, La Roche-Posay, Shiseido, Neutrogena, EltaMD, Coola, Bioderma, ISDIN, Dr. Dennis Gross, Olay

Smart Spf Complexes Market

Global Smart SPF Complexes Market Key Takeaways

Metric Value
Global Smart SPF Complexes Market Estimated Value in (2025E) USD 2,450.3 million
Global Smart SPF Complexes Market Forecast Value in (2035F) USD 7,982.5 million
Forecast CAGR (2025 to 2035) 12.5%

During the first five-year period from 2025 to 2030, the market increases from USD 2,450.3 million to USD 4,422.6 million, adding USD 1,972.3 million, which accounts for 36% of the total decade growth. This phase records steady adoption in advanced sun protection products, multi-functional skin formulations, and premium beauty innovations, driven by the rising consumer preference for daily-use UV shields. UV protection dominates this period as it caters to over 57% of market demand, reflecting strong consumer awareness of photoaging and skin cancer risks.

The second half from 2030 to 2035 contributes USD 3,559.9 million, equal to 64% of total growth, as the market jumps from USD 4,422.6 million to USD 7,982.5 million. This acceleration is powered by widespread deployment of smart skincare hybrids combining SPF with anti-aging peptides, brightening actives, and pollution defense complexes.

Serums and sprays/mists gain traction, while creams/lotions retain a significant baseline due to mass consumer familiarity. Digital-first distribution, including e-commerce platforms and subscription-based models, propels rapid expansion. The claim segment shifts toward dermatologist-tested and vegan products, with dermatologist-tested formulations alone accounting for USD 1,286.9 million in 2025.

From 2020 to 2024, the global Smart SPF Complexes Market grew steadily from niche multifunctional sun care to a broader mainstream adoption, reaching close to USD 2.2 billion in value. During this period, the competitive landscape was dominated by clinical-grade skincare brands and dermatology-backed labels, controlling nearly 70% of revenue, with leaders such as Supergoop!, La Roche-Posay, and Shiseido focusing on combining superior sun protection with added skin health benefits. Competitive differentiation relied on scientific validation, skin compatibility, and lightweight formulations, while digital channels became an essential driver of consumer reach. Service-based offerings such as personalized SPF routines had minimal traction, contributing less than 8% of the total market value.

Demand for Smart SPF Complexes will expand to USD 2,450.3 million in 2025, and the revenue mix will shift as multifunctional claims (anti-aging, brightening, and pollution defense) grow to over 42% share. Traditional SPF leaders face rising competition from indie clean-label players offering vegan, dermatologist-tested, and natural/organic certifications.

Major global vendors are pivoting to hybrid positioning, integrating antioxidant complexes, DNA repair enzymes, and AI-driven skin testing kits to retain consumer relevance. Emerging entrants specializing in e-commerce-first models, subscription services, and K-beauty-inspired SPF textures are gaining share. The competitive advantage is moving away from SPF strength alone to brand trust, dermatological endorsement, and holistic skin wellness integration.

Why the Global Smart SPF Complexes Market is growing?

Advances in dermatological research and skincare formulations have improved efficacy and safety, allowing for multifunctional SPF products that go beyond basic sun protection. UV protection remains the leading driver as rising skin cancer cases and photoaging concerns push consumers toward high-SPF, broad-spectrum complexes.

The addition of anti-aging peptides, niacinamide-based brightening, and pollution defense antioxidants has turned Smart SPF into an everyday skincare essential. Consumers, particularly in urban and high-pollution areas, are increasingly demanding products that protect against UVA, UVB, blue light, and environmental toxins simultaneously.

Expansion of dermatologist-tested, vegan, and clean-label formulations has fueled consumer trust and adoption. Innovations in lightweight serums, sprays, and stick formats have made SPF reapplication easier, addressing one of the biggest compliance challenges in sun care.

Segment growth is expected to be led by UV protection under function, creams/lotions under product type, and dermatologist-tested under claims due to their proven safety and efficacy. E-commerce platforms, beauty specialty stores, and pharmacy chains are expected to open new application and distribution areas, boosting both accessibility and premium positioning.

Segmental Analysis

The market is segmented by function, product type, channel, claim, and region. Functions include UV protection, anti-aging, brightening, and pollution defense, highlighting the core elements driving adoption. Product type classification covers creams/lotions, serums, sticks, and sprays/mists to cater to different consumer usage patterns.

Based on channel, the segmentation includes pharmacies, e-commerce, mass retail, and specialty beauty stores. In terms of claims, categories encompass dermatologist-tested, vegan, clean-label, and natural/organic certifications. Regionally, the scope spans North America, Latin America, Europe, Asia-Pacific, and the Middle East & Africa.
Insights into the Function Segment with UV Protection Leading in Market Share

Smart Spf Complexes Market By Function

Function Segment Market Value Share, 2025
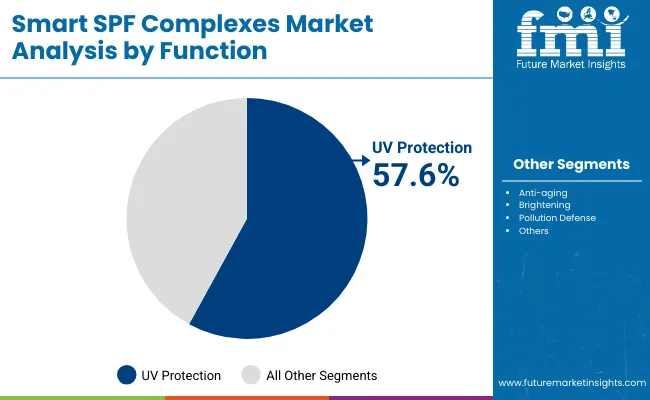
UV protection 57.6%
Others 42.4%

The UV protection segment is projected to contribute 57.6% of the global Smart SPF Complexes Market revenue in 2025, maintaining its lead as the dominant functional category. This is driven by ongoing demand for broad-spectrum sun protection that shields against UVA and UVB radiation, addressing both health and cosmetic skin concerns. UV protection remains the entry point for most consumers, but the rise of anti-aging and brightening actives as add-ons shows the evolving consumer preference for multi-dimensional skincare solutions.

The segment’s growth is also supported by increased consumer education on SPF compliance and global campaigns highlighting the risks of unprotected exposure. With innovations such as hybrid sunscreen-serums, breathable textures, and antioxidant-boosted UV shields, UV protection is expected to retain its position as the backbone of smart SPF innovation.
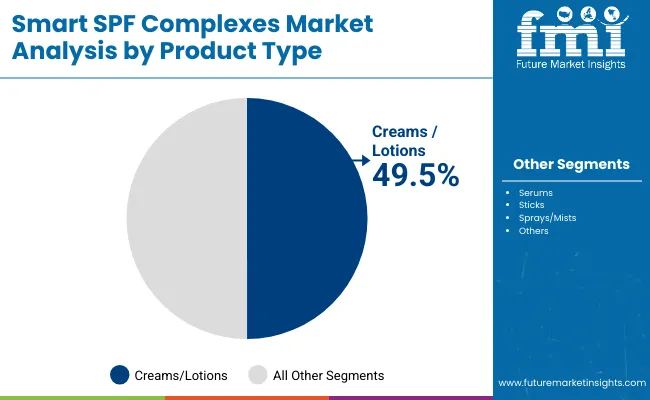
Insights into the Product Type Segment with Creams/Lotions Dominating the Demand

Smart Spf Complexes Market Product Type

Product Type Segment Market Value Share, 2025
Creams/lotions 49.5%
Others 50.5%

The creams/lotions segment is forecasted to hold 49.5% of the market share in 2025, led by its widespread consumer familiarity and role as the most trusted format for sun care. Creams and lotions offer versatility across age groups and skin types, making them the preferred choice for both dermatology prescriptions and over-the-counter retail.

Their ease of formulation allows brands to integrate multiple actives, such as retinol for anti-aging, niacinamide for brightening, and antioxidants for pollution defense. As lightweight and quick-absorbing textures continue to evolve, creams and lotions remain highly adaptable for daily routines, while serums and sprays are emerging as strong complements for specific use cases such as layering and reapplication.

Insights into the Claim Segment with Dermatologist-Tested Leading in Market Share

Smart Spf Complexes Market By Claim

Claim Segment Market Value Share, 2025
Dermatologist-tested 52.5 %
Others 47.5 %

The global Smart SPF Complexes Market in 2025 is strongly anchored by dermatologist-tested formulations, which account for 52.5% of total value, equal to USD 1,286.9 million. This dominance reflects a global shift toward clinical validation and consumer trust in products that guarantee safety, efficacy, and skin tolerance.

Dermatologist endorsements serve as a credibility anchor, especially in developed markets like the USA, Germany, and the UK, where medical associations and pharmacy-led distribution heavily influence purchase decisions. The segment’s strength is also tied to consumer concerns over SPF label controversies and efficacy transparency, making clinically backed SPF complexes the most preferred choice worldwide.

The “Others” category, comprising vegan, clean-label, and natural/organic claims, represents 47.5% (USD 1,163.27 million) in 2025 and is expanding rapidly across Asia-Pacific and emerging markets. Clean-label claims resonate with eco-conscious consumers, while vegan and natural/organic options appeal to millennials and Gen Z seeking ethical skincare.

Although smaller than dermatologist-tested, this segment is driving innovation in lightweight, plant-derived SPF hybrids and refillable packaging solutions. Over the next decade, convergence between dermatologist-tested rigor and clean-label positioning is expected to define brand success, as consumers increasingly demand both clinical validation and ingredient transparency from their SPF choices.

What are the Drivers, Restraints, and Key Trends of the Global Smart SPF Complexes Market?

Drivers

Rising Demand for Hybrid Skincare Products Integrating SPF with Anti-Aging and Brightening Complexes

One of the strongest growth drivers in the global Smart SPF Complexes Market is the consumer preference for hybrid skincare formats that combine sun protection with active benefits like anti-aging peptides, antioxidants, and brightening actives. Traditionally, SPF products were perceived as functional and often left behind in the skincare hierarchy. However, the global demand is shifting towards "value-stacked" products where SPF is seamlessly embedded into daily-use creams, serums, and even color cosmetics.

This transition is particularly evident in premium and mass segments in Asia-Pacific and the USA, where dermatologist-tested and vegan SPF complexes with claims such as anti-pollution or skin barrier repair are gaining rapid adoption. Brands like Supergoop! and La Roche-Posay are leading this narrative by innovating with SPF serums and lightweight lotions that not only prevent photoaging but also deliver long-term skin health benefits.

Expansion of E-commerce and Subscription-Based Distribution Models for Daily SPF Products

E-commerce is becoming a dominant distribution channel for SPF complexes, accounting for a rising share of global sales. Unlike traditional sun care, Smart SPF Complexes benefit heavily from digital-first positioning, influencer-driven campaigns, and targeted skincare education online. Subscription models, pioneered by niche indie players and increasingly adopted by leading brands, are fueling recurring sales by embedding SPF use into daily routines.

This is particularly important because one of the historic challenges of sun care was low reapplication compliance but subscription boxes with auto-renewals and bundled skincare kits are improving penetration rates. In markets like China and India, where CAGR is projected above 20%, e-commerce-first SPF launches are not only expanding brand reach but also shaping new consumer habits around regular and multi-step sun protection.

Restraints

Formulation Complexity and High R&D Costs in Smart SPF Integration

Unlike traditional sunscreens, Smart SPF Complexes must integrate photostable filters with additional active ingredients such as antioxidants, peptides, and brightening agents all while maintaining compatibility, stability, and skin tolerance. This significantly raises formulation challenges and R&D investment requirements for brands. Stability issues such as oxidation of vitamin C in SPF serums or the interaction of retinoids with UV filters can compromise product safety and efficacy.

These scientific complexities slow down product pipelines and make scaling difficult, particularly for mid-tier or indie players. For multinational brands, this means higher production costs and longer launch cycles, limiting their ability to compete with fast-moving K-beauty or clean-label brands that thrive on speed-to-market.

Consumer Distrust Stemming from SPF Efficacy and Labeling Controversies

The market continues to face restraint due to skepticism over SPF label accuracy, especially after regulatory recalls and lawsuits questioning the actual UV protection delivered compared to advertised claims. In markets like the USA and Europe, some SPF products have come under scrutiny for containing benzene impurities or providing lower-than-claimed SPF ratings under real-use conditions.

This has eroded trust and made consumers more selective, favoring dermatologist-tested or clinically validated SPF complexes. While this creates opportunities for medically endorsed brands like La Roche-Posay or EltaMD, it restrains overall growth by making adoption slower in emerging markets where consumers are wary of premium price tags without clear regulatory assurances.

Key Trends

Surge of Dermatologist-Tested and Clinical-Grade SPF Complexes as a Consumer Trust Anchor

With dermatologist-tested products already capturing 52.5% of global market share in 2025 (USD 1,286.9 million), clinical-grade validation is becoming the cornerstone of competitive positioning. Consumers increasingly look for evidence-backed claims, driving major players like ISDIN and Bioderma to emphasize dermatological testing and medical endorsements.

This trend is particularly pronounced in China, where dermatologist-tested SPF complexes dominate the claim segment. In parallel, clinical aesthetics and dermatology clinics are integrating SPF complexes as part of prescribed post-treatment skincare, further embedding them into everyday routines. This blurs the line between medical-grade skincare and consumer beauty, positioning dermatologist-tested Smart SPF Complexes as the default choice for risk-averse consumers.

Regional Innovation Driven by Asia-Pacific: K-Beauty and J-Beauty Leading Global SPF Textures

Asia-Pacific, with China (CAGR 23.1%) and Japan (CAGR 18.0%), is setting the innovation tone for global Smart SPF Complexes. K-beauty and J-beauty brands are pioneering formats like SPF mists, sticks, and essence-like serums that integrate seamlessly into multi-step skincare routines. These innovations are influencing Western brands to adapt lightweight, reapplication-friendly textures that move beyond heavy creams.

For example, sprays and sticks are becoming more popular in the USA as consumers seek convenience for on-the-go application. The cross-pollination of formats and textures between Asia and Western markets is establishing a trend where "SPF reapplication made easy" is central to innovation. This trend also extends into packaging, with eco-friendly, refillable SPF applicators gaining traction under the clean-label and sustainable beauty movement.
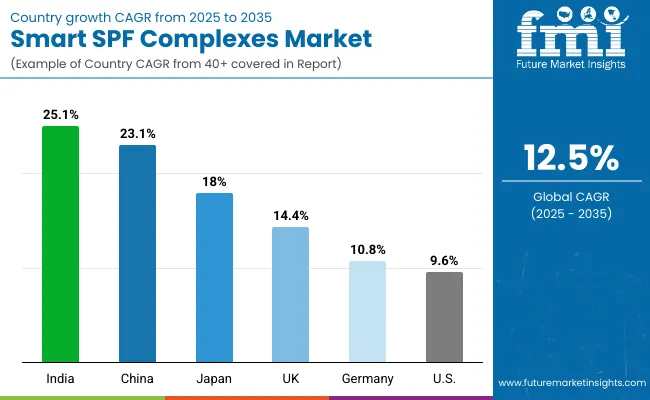
Analysis of Global Smart SPF Complexes Market By Key Countries

Smart Spf Complexes Market Country Wise Analysis

Country Estimated CAGR (2025 to 2035)
China 23.1%
USA 9.6%
India 25.1%
UK 14.4%
Germany 10.8%
Japan 18.0%

The country-wise outlook for the global Smart SPF Complexes Market highlights significant regional variations in growth trajectories, reflecting differences in consumer behavior, dermatological awareness, and retail infrastructure. India is expected to lead with the highest CAGR of 25.1% between 2025 and 2035, driven by a young demographic, increasing disposable incomes, and rapid urbanization that amplifies pollution and UV exposure concerns.

China follows closely at 23.1%, benefitting from its strong e-commerce ecosystem, influencer-led beauty marketing, and rising preference for dermatologist-tested and multi-functional SPF complexes. Japan, with an 18.0% CAGR, demonstrates its established culture of daily SPF usage, where beauty and prevention are deeply embedded in skincare routines. These Asian markets are shaping innovation in SPF formats from lightweight serums and mists to convenient sticks and are driving global adoption trends.

In contrast, mature Western markets such as the USA, UK, and Germany show more moderate yet steady growth, reflecting their already established consumer bases. The USA is projected to expand at a 9.6% CAGR, underpinned by dermatologist-recommended products, strong pharmacy distribution, and premiumization trends in daily SPF.

The UK, at 14.4%, reflects a growing consumer shift toward clean-label and vegan claims, while Germany’s 10.8% CAGR is supported by a strong dermocosmetic market and regulatory confidence in clinically validated products. Together, these markets will continue to provide stability, but the sharper growth curve is clearly in Asia-Pacific, positioning it as the engine of innovation and expansion for global Smart SPF Complexes over the forecast period.
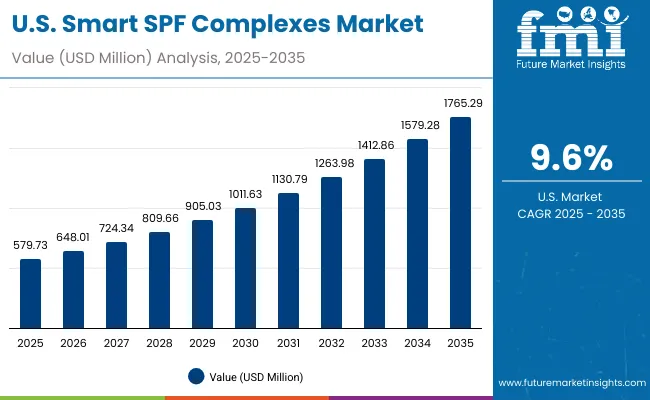
Sales Outlook for Smart SPF Complexes in the United States

Usa Smart Spf Complexes Market

Year USA Smart SPF Complexes Market (USD Million)
2025 579.7
2026 648.0
2027 724.3
2028 809.7
2029 905.0
2030 1011.6
2031 1130.8
2032 1264.0
2033 1412.9
2034 1579.3
2035 1765.3

The Smart SPF Complexes Market in the United States is projected to grow at a CAGR of 9.6%, led by rising demand for dermatologist-tested and daily-use multifunctional SPF products. Dermatology clinics and pharmacies are central to consumer adoption, with UV protection-based creams and lotions dominating sales. Growth is further supported by heightened awareness of photoaging and skin cancer prevention, reinforced by strong medical endorsements.

Digital-first consumer engagement, including social media influencers and DTC subscription models, is reshaping retail. Premium players like Supergoop! and La Roche-Posay are expanding beyond UV-only claims by integrating anti-aging and pollution-defense complexes.

  • UV protection remains the dominant use case, with dermatologist-prescribed SPF routines driving adoption.
  • Pharmacies and e-commerce are the leading distribution channels, supported by trust in clinical validation.
  • Subscription-based DTC strategies are increasing reapplication compliance and boosting recurring revenues.

Growth and Expansion Outlook for Smart SPF Complexes in the United Kingdom

The Smart SPF Complexes Market in the United Kingdom is expected to grow at a CAGR of 14.4%, supported by consumer preferences for vegan, clean-label, and natural/organic SPF claims. The UK market is shaped by strong consumer movements toward transparency and sustainability in beauty, with SPF products increasingly marketed as part of eco-conscious routines.

Retailers and specialty beauty stores are expanding premium shelf space for SPF serums, sprays, and mists. Heritage skincare brands are also adopting digital marketing to emphasize dermatologist-tested benefits. Growth is further reinforced by governmental skin cancer awareness campaigns and rising adoption of multifunctional daily-use products across men’s grooming and unisex skincare.

  • Consumers are actively seeking clean-label SPF complexes aligned with vegan and eco-friendly claims.
  • Specialty beauty stores and premium retailers are driving the expansion of SPF hybrids and serums.
  • Dermatologist-tested validation is becoming a core purchase trigger across urban and suburban consumers.

Growth and Expansion Outlook for Smart SPF Complexes in India

India is witnessing rapid growth in the Smart SPF Complexes Market, which is forecast to expand at a CAGR of 25.1% through 2035, the highest globally. Rising disposable incomes, growing pollution levels in urban centers, and increasing awareness of UV damage are accelerating adoption. Tier-2 and Tier-3 cities are emerging growth hubs, where affordable dermatologist-tested SPF lotions and creams are entering pharmacies and retail chains.

Premium brands are capturing metros with brightening and anti-aging SPF complexes, while e-commerce platforms are extending reach to younger consumers. Education on daily SPF use is being driven by dermatologists, social media influencers, and regional KOLs.
  • Affordable SPF creams are penetrating mid-tier cities, making adoption more widespread.
  • Anti-aging and brightening SPF complexes are resonating strongly with aspirational consumers.
  • E-commerce is serving as a primary growth driver, particularly among millennials and Gen Z.

Sales Outlook for Smart SPF Complexes in China

China Smart Spf Complexes Market

The Smart SPF Complexes Market in China is expected to grow at a CAGR of 23.1%, one of the fastest among global markets. This momentum is driven by the country’s advanced e-commerce infrastructure, rapid premiumization in skincare, and consumer preference for dermatologist-tested formulations. Urban consumers are shifting toward hybrid SPF products with multifunctional claims, particularly brightening and pollution defense.

Local brands are increasingly competitive, offering affordable but clinically validated products that cater to Gen Z and millennials. Influencer-led marketing, combined with K-beauty and J-beauty inspired formats such as mists, sticks, and essence-SPFs, is shaping demand.

  • E-commerce platforms and live-streaming campaigns are fueling mass adoption across demographics.
  • Dermatologist-tested SPF complexes dominate claims, reflecting consumer demand for safety and efficacy.
  • Local and international players compete on lightweight formats, with sticks and sprays gaining strong traction.
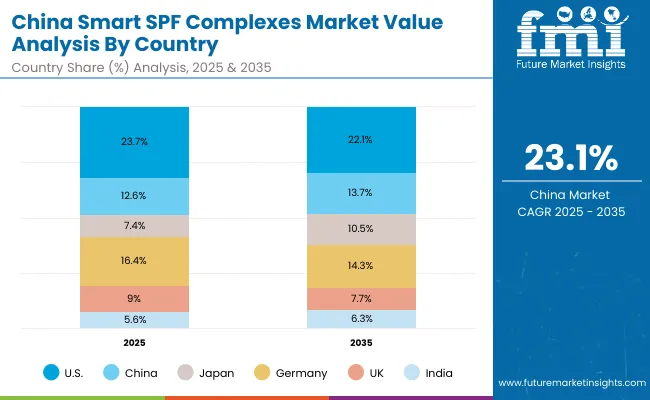
Country 2025 Share (%)
USA 23.7%
China 12.6%
Japan 7.4%
Germany 16.4%
UK 9.0%
India 5.6%
Country 2035 Share (%)
USA 22.1%
China 13.7%
Japan 10.5%
Germany 14.3%
UK 7.7%
India 6.3%

Opportunity Analysis of United States Smart SPF Complexes Market

Usa Smart Spf Complexes Market By Function

Function Segment Market Value Share, 2025
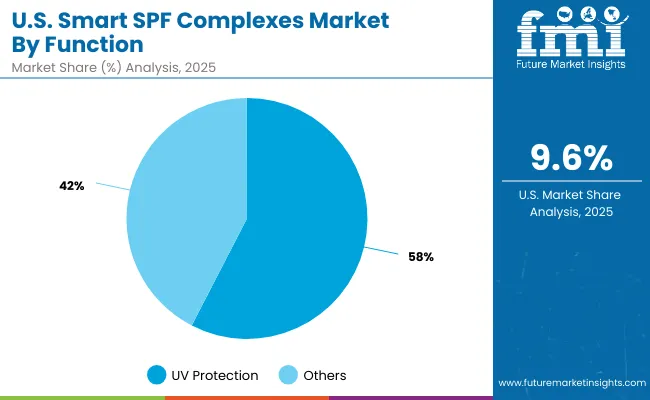
UV protection 54.6%
Others 45.4%

The Smart SPF Complexes Market in the United States is valued at USD 579.73 million in 2025, with UV protection leading at 54.6%, reflecting deep dermatology-led awareness and daily-wear habits. UV-first routines are anchored in pharmacy and clinic channels where dermatologist-tested claims drive trust, compliance, and repeat purchase.

Lightweight creams and lotions remain the baseline for broad-spectrum coverage, while premium lines layer anti-aging peptides and brightening actives to convert sunscreen from a seasonal item to a 365-day skincare essential. The opportunity is strongest at the intersection of medical endorsement and consumer convenience, where stick and spray formats support on-the-go reapplication without sacrificing photostability or skin feel. Digital-native brands are also leveraging subscriptions to fix reapplication behavior, translating medical guidance into predictable basket sizes.

This advantage positions UV-led Smart SPF complexes as the primary entry point into higher-value hybrid regimens in the United States. E-commerce and omnichannel pharmacy chains amplify this effect through targeted education and sampling, while tinted SPF, mineral-forward options, and sensitive-skin variants expand reach across diverse skin tones and conditions.

As retailers elevate dermocosmetic assortments, the upside shifts toward serums that stack SPF with antioxidants and pollution defense for urban lifestyles. Brands that can validate claims with clinical data and transparent filter systems will outpace peers as consumers scrutinize efficacy and ingredient integrity.
  • Market size for the United States in 2025 is USD 579.73 million
  • Global market share is approximately 23.7%
  • UV protection leads at 54.6% due to dermatologist-driven daily protocols and pharmacy trust

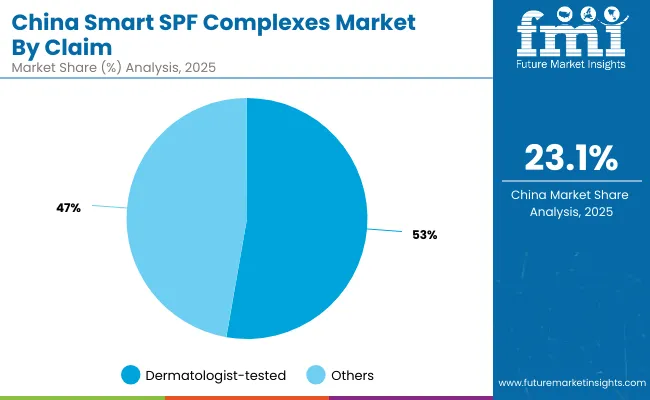
Opportunity Analysis of China Smart SPF Complexes Market

China Smart Spf Complexes Market By Claim

Claim Segment Market Value Share, 2025
Dermatologist-tested 52.5%
Others 47.5%

The Smart SPF Complexes Market in China is valued at approximately USD 308.74 million in 2025, with dermatologist-tested leading at 52.5%. China’s opportunity profile is defined by rapid premiumization in skincare, live commerce that educates at scale, and a consumer pivot toward clinically verified, sensitive-skin-safe formulas. Dermatologist-tested is not only a reassurance signal but also a conversion lever for first-time buyers of hybrid SPF formats.

Brightening and pollution defense co-claims resonate strongly in Tier 1 and Tier 2 cities where air quality and hyperpigmentation concerns push multi-active SPF serums and essence textures into everyday routines. Local champions are competitive on speed-to-market and price, while international brands compete on clinical depth and texture innovation inspired by K-beauty and J-beauty.

This advantage positions dermatologist-tested lines as the de facto standard for growth in China, especially where proof of efficacy and filter transparency are front and center in livestreams and social reviews. Value packs, refillable packaging, and travel minis accelerate trial and reapplication, while mists and sticks unlock incremental occasions throughout the workday. As cross-border and domestic e-commerce platforms refine discovery and sampling mechanics, the segment’s ceiling lifts further for brands that pair lightweight aesthetics with lab-backed outcomes across brightening and barrier repair.
  • Market size for China in 2025 is approximately USD 308.74 million
  • Global market share is approximately 12.6%
  • Dermatologist-tested leads at 52.5% due to strong clinical validation and live-commerce education

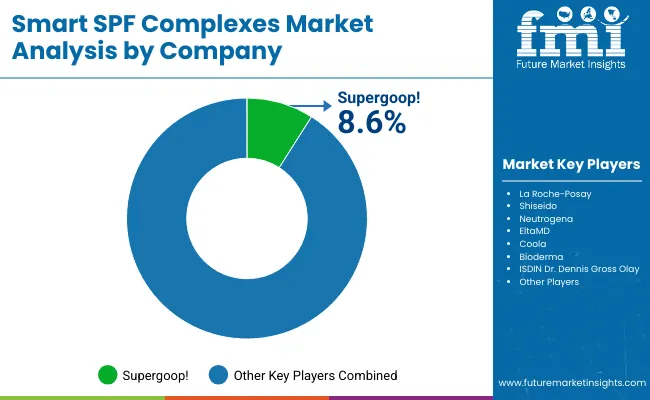
Competitive Landscape of Global Smart SPF Complexes Market

Smart Spf Complexes Market By Comapny

Companies Global Value Share 2025
Supergoop ! 8.6%
Others 91.4%

The global Smart SPF Complexes Market is moderately fragmented, with dermatologist-backed leaders, performance-driven premium brands, and agile clean-label specialists competing across claims, textures, and channels. Supergoop! sets the pace on product architecture and format breadth, translating daily SPF education into stickiness through textures like cloud-light lotions, primer-style SPF, and mini formats that simplify reapplication.

La Roche-Posay, EltaMD, and Bioderma leverage clinical equities and pharmacy distribution to scale dermatologist-tested franchises, anchoring trust for sensitive-skin and post-procedure use. Shiseido and ISDIN differentiate on high-performance filters and elegant wear that suit humid and urban conditions, while Neutrogena and Olay use mass retail and DTC to democratize hybrid SPF with anti-aging and brightening co-claims.

Competitive strategies are shifting from isolated SPF strength to integrated ecosystems where claims validation, texture engineering, and channel design compound advantage. Leaders are investing in clinical substantiation that travels well in physician offices and live-commerce demos, while packaging innovation supports on-the-go top-ups without residue.

Clean-label and vegan positioning create additional lanes for Coola and indie players that win with ingredient transparency and reef-conscious narratives. As specialty beauty stores and pharmacies expand dermocosmetic bays, bundled routines that pair SPF with antioxidant serums and barrier-repair moisturizers unlock higher lifetime value. The next leg of differentiation will come from measurable outcomes, clearer filter disclosures, and frictionless replenishment models that align with how consumers actually use SPF every day.

Key Developments in Global Smart SPF Complexes Market

  • On February 2025, Supergoop! launchedGlowscreen Soft-Radiance Drops Mineral SPF 40, a blendable drop-in solution that integrates into moisturizers or foundation to deliver both glow and UV protection. This innovation was praised by editors for its seamless texture, radiance boost, and compatibility with makeup routines.
  • On 2025, Supergoop! also introduced a travel-friendly collaboration with HBO’s The White Lotus, releasing the Eternal Paradise Suncare Collectiona trio of glow-enhancing, mini-format SPF products designed to make sun care more appealing and share-worthy.

Scope of the Report

Item Value
Quantitative Units USD 2,450.3 million
Function UV protection, Anti-aging, Brightening, and Pollution defense
Product Type Creams/lotions, Serums, Sticks, and Sprays/mists
Channel E-commerce, Pharmacies, Specialty beauty stores, and Mass retail
Claim Dermatologist-tested, Vegan, Clean-label, and Natural/organic
Regions Covered North America, Europe, Asia-Pacific, Latin America, Middle East & Africa
Country Covered United States, Canada, Germany, France, United Kingdom, China, Japan, India, Brazil, South Africa
Key Companies Profiled Supergoop !, La Roche- Posay , Shiseido, Neutrogena, EltaMD , Coola, Bioderma , ISDIN, Dr. Dennis Gross, and Olay
Additional Attributes Dollar sales by function, product type, and channel; adoption trends in UV protection and anti-aging SPF skincare; rising demand for dermatologist-tested and vegan claims; segment-specific growth in creams/lotions and e-commerce; integration of antioxidants such as vitamin C and peptides into SPF complexes; regional trends influenced by K-beauty, J-beauty, and clean-label movements; and innovations in hybrid SPF formats like serums, mists, and sticks designed for daily reapplication. .

Key Segments

By Function:

  • UV protection
  • Anti-aging
  • Brightening
  • Pollution defense

By Product Type:

  • Serums
  • Creams/lotions
  • Sticks
  • Sprays/mists

By Channel:

  • E-commerce
  • Pharmacies
  • Mass retail
  • Specialty beauty stores

By Claim:

  • Natural/organic
  • Vegan
  • Dermatologist-tested
  • Clean-label

By Region:

  • North America
  • Latin America
  • Europe
  • East Asia
  • South Asia & Pacific
  • Middle East and Africa

Table of Content

  1. Executive Summary
    • Global Market Outlook
    • Demand-side Trends
    • Supply-side Trends
    • Technology Roadmap Analysis
    • Analysis and Recommendations
  2. Market Overview
    • Market Coverage / Taxonomy
    • Market Definition / Scope / Limitations
  3. Market Background
    • Market Dynamics
      • Drivers
      • Restraints
      • Opportunity
      • Trends
    • Scenario Forecast
      • Demand in Optimistic Scenario
      • Demand in Likely Scenario
      • Demand in Conservative Scenario
    • Opportunity Map Analysis
    • Product Life Cycle Analysis
    • Supply Chain Analysis
      • Supply Side Participants and their Roles
        • Producers
        • Mid-Level Participants (Traders/ Agents/ Brokers)
        • Wholesalers and Distributors
      • Value Added and Value Created at Node in the Supply Chain
      • List of Raw Material Suppliers
      • List of Existing and Potential Buyer’s
    • Investment Feasibility Matrix
    • Value Chain Analysis
      • Profit Margin Analysis
      • Wholesalers and Distributors
      • Retailers
    • PESTLE and Porter’s Analysis
    • Regulatory Landscape
      • By Key Regions
      • By Key Countries
    • Regional Parent Market Outlook
    • Production and Consumption Statistics
    • Import and Export Statistics
  4. Global Market Analysis 2020 to 2024 and Forecast, 2025 to 2035
    • Historical Market Size Value (USD Million) & Volume (Units) Analysis, 2020 to 2024
    • Current and Future Market Size Value (USD Million) & Volume (Units) Projections, 2025 to 2035
      • Y-o-Y Growth Trend Analysis
      • Absolute $ Opportunity Analysis
  5. Global Market Analysis 2020 to 2024 and Forecast 2025 to 2035, By Function
    • Introduction / Key Findings
    • Historical Market Size Value (USD Million) & Volume (Units) Analysis By Function, 2020 to 2024
    • Current and Future Market Size Value (USD Million) & Volume (Units) Analysis and Forecast By Function, 2025 to 2035
      • UV protection
      • Anti-aging
      • Brightening
      • Pollution defense
    • Y-o-Y Growth Trend Analysis By Function, 2020 to 2024
    • Absolute $ Opportunity Analysis By Function, 2025 to 2035
  6. Global Market Analysis 2020 to 2024 and Forecast 2025 to 2035, By Product Type
    • Introduction / Key Findings
    • Historical Market Size Value (USD Million) & Volume (Units) Analysis By Product Type, 2020 to 2024
    • Current and Future Market Size Value (USD Million) & Volume (Units) Analysis and Forecast By Product Type, 2025 to 2035
      • Serums
      • Creams/lotions
      • Sticks
      • Sprays/mists
    • Y-o-Y Growth Trend Analysis By Product Type, 2020 to 2024
    • Absolute $ Opportunity Analysis By Product Type, 2025 to 2035
  7. Global Market Analysis 2020 to 2024 and Forecast 2025 to 2035, By Channel
    • Introduction / Key Findings
    • Historical Market Size Value (USD Million) & Volume (Units) Analysis By Channel, 2020 to 2024
    • Current and Future Market Size Value (USD Million) & Volume (Units) Analysis and Forecast By Channel, 2025 to 2035
      • E-commerce
      • Pharmacies
      • Mass retail
      • Specialty beauty stores
    • Y-o-Y Growth Trend Analysis By Channel, 2020 to 2024
    • Absolute $ Opportunity Analysis By Channel, 2025 to 2035
  8. Global Market Analysis 2020 to 2024 and Forecast 2025 to 2035, By Claim
    • Introduction / Key Findings
    • Historical Market Size Value (USD Million) & Volume (Units) Analysis By Claim, 2020 to 2024
    • Current and Future Market Size Value (USD Million) & Volume (Units) Analysis and Forecast By Claim, 2025 to 2035
      • Natural/organic
      • Vegan
      • Dermatologist-tested
      • Clean-label
    • Y-o-Y Growth Trend Analysis By Claim, 2020 to 2024
    • Absolute $ Opportunity Analysis By Claim, 2025 to 2035
  9. Global Market Analysis 2020 to 2024 and Forecast 2025 to 2035, By Region
    • Introduction
    • Historical Market Size Value (USD Million) & Volume (Units) Analysis By Region, 2020 to 2024
    • Current Market Size Value (USD Million) & Volume (Units) Analysis and Forecast By Region, 2025 to 2035
      • North America
      • Latin America
      • Europe
      • East Asia
      • South Asia & Pacific
      • Middle East and Africa
    • Market Attractiveness Analysis By Region
  10. North America Market Analysis 2020 to 2024 and Forecast 2025 to 2035, By Country
    • Historical Market Size Value (USD Million) & Volume (Units) Trend Analysis By Market Taxonomy, 2020 to 2024
    • Market Size Value (USD Million) & Volume (Units) Forecast By Market Taxonomy, 2025 to 2035
      • By Country
        • USA
        • Canada
      • By Function
      • By Product Type
      • By Channel
      • By Claim
    • Market Attractiveness Analysis
      • By Country
      • By Function
      • By Product Type
      • By Channel
      • By Claim
    • Key Takeaways
  11. Latin America Market Analysis 2020 to 2024 and Forecast 2025 to 2035, By Country
    • Historical Market Size Value (USD Million) & Volume (Units) Trend Analysis By Market Taxonomy, 2020 to 2024
    • Market Size Value (USD Million) & Volume (Units) Forecast By Market Taxonomy, 2025 to 2035
      • By Country
        • Brazil
        • Mexico
        • Colombia
        • Rest of Latin America
      • By Function
      • By Product Type
      • By Channel
      • By Claim
    • Market Attractiveness Analysis
      • By Country
      • By Function
      • By Product Type
      • By Channel
      • By Claim
    • Key Takeaways
  12. Europe Market Analysis 2020 to 2024 and Forecast 2025 to 2035, By Country
    • Historical Market Size Value (USD Million) & Volume (Units) Trend Analysis By Market Taxonomy, 2020 to 2024
    • Market Size Value (USD Million) & Volume (Units) Forecast By Market Taxonomy, 2025 to 2035
      • By Country
        • Germany
        • UK
        • France
        • Italy
        • Spain
        • Belgium
        • Netherlands
        • Nordic
        • Switzerland
        • Russia
        • Poland
        • Rest of Europe
      • By Function
      • By Product Type
      • By Channel
      • By Claim
    • Market Attractiveness Analysis
      • By Country
      • By Function
      • By Product Type
      • By Channel
      • By Claim
    • Key Takeaways
  13. East Asia Market Analysis 2020 to 2024 and Forecast 2025 to 2035, By Country
    • Historical Market Size Value (USD Million) & Volume (Units) Trend Analysis By Market Taxonomy, 2020 to 2024
    • Market Size Value (USD Million) & Volume (Units) Forecast By Market Taxonomy, 2025 to 2035
      • By Country
        • China
        • Japan
        • South Korea
      • By Function
      • By Product Type
      • By Channel
      • By Claim
    • Market Attractiveness Analysis
      • By Country
      • By Function
      • By Product Type
      • By Channel
      • By Claim
    • Key Takeaways
  14. South Asia & Pacific Market Analysis 2020 to 2024 and Forecast 2025 to 2035, By Country
    • Historical Market Size Value (USD Million) & Volume (Units) Trend Analysis By Market Taxonomy, 2020 to 2024
    • Market Size Value (USD Million) & Volume (Units) Forecast By Market Taxonomy, 2025 to 2035
      • By Country
        • India
        • Thailand
        • Malaysia
        • Indonesia
        • Singapore
        • Vietnam
        • Australia
        • New Zealand
        • Rest of South Asia
      • By Function
      • By Product Type
      • By Channel
      • By Claim
    • Market Attractiveness Analysis
      • By Country
      • By Function
      • By Product Type
      • By Channel
      • By Claim
    • Key Takeaways
  15. Middle East and Africa Market Analysis 2020 to 2024 and Forecast 2025 to 2035, By Country
    • Historical Market Size Value (USD Million) & Volume (Units) Trend Analysis By Market Taxonomy, 2020 to 2024
    • Market Size Value (USD Million) & Volume (Units) Forecast By Market Taxonomy, 2025 to 2035
      • By Country
        • Turkey
        • UAE
        • Saudi Arabia
        • Israel
        • Other GCC Countries
        • North Africa
        • South Africa
      • By Function
      • By Product Type
      • By Channel
      • By Claim
    • Market Attractiveness Analysis
      • By Country
      • By Function
      • By Product Type
      • By Channel
      • By Claim
    • Key Takeaways
  16. Key Countries Market Analysis
    • USA
      • Pricing Analysis
      • Market Share Analysis, 2024
        • By Function
        • By Product Type
        • By Channel
        • By Claim
    • Canada
      • Pricing Analysis
      • Market Share Analysis, 2024
        • By Function
        • By Product Type
        • By Channel
        • By Claim
    • Brazil
      • Pricing Analysis
      • Market Share Analysis, 2024
        • By Function
        • By Product Type
        • By Channel
        • By Claim
    • Mexico
      • Pricing Analysis
      • Market Share Analysis, 2024
        • By Function
        • By Product Type
        • By Channel
        • By Claim
    • Colombia
      • Pricing Analysis
      • Market Share Analysis, 2024
        • By Function
        • By Product Type
        • By Channel
        • By Claim
    • Germany
      • Pricing Analysis
      • Market Share Analysis, 2024
        • By Function
        • By Product Type
        • By Channel
        • By Claim
    • UK
      • Pricing Analysis
      • Market Share Analysis, 2024
        • By Function
        • By Product Type
        • By Channel
        • By Claim
    • France
      • Pricing Analysis
      • Market Share Analysis, 2024
        • By Function
        • By Product Type
        • By Channel
        • By Claim
    • Italy
      • Pricing Analysis
      • Market Share Analysis, 2024
        • By Function
        • By Product Type
        • By Channel
        • By Claim
    • Spain
      • Pricing Analysis
      • Market Share Analysis, 2024
        • By Function
        • By Product Type
        • By Channel
        • By Claim
    • Belgium
      • Pricing Analysis
      • Market Share Analysis, 2024
        • By Function
        • By Product Type
        • By Channel
        • By Claim
    • Netherlands
      • Pricing Analysis
      • Market Share Analysis, 2024
        • By Function
        • By Product Type
        • By Channel
        • By Claim
    • Nordic
      • Pricing Analysis
      • Market Share Analysis, 2024
        • By Function
        • By Product Type
        • By Channel
        • By Claim
    • Switzerland
      • Pricing Analysis
      • Market Share Analysis, 2024
        • By Function
        • By Product Type
        • By Channel
        • By Claim
    • Russia
      • Pricing Analysis
      • Market Share Analysis, 2024
        • By Function
        • By Product Type
        • By Channel
        • By Claim
    • Poland
      • Pricing Analysis
      • Market Share Analysis, 2024
        • By Function
        • By Product Type
        • By Channel
        • By Claim
    • China
      • Pricing Analysis
      • Market Share Analysis, 2024
        • By Function
        • By Product Type
        • By Channel
        • By Claim
    • Japan
      • Pricing Analysis
      • Market Share Analysis, 2024
        • By Function
        • By Product Type
        • By Channel
        • By Claim
    • South Korea
      • Pricing Analysis
      • Market Share Analysis, 2024
        • By Function
        • By Product Type
        • By Channel
        • By Claim
    • India
      • Pricing Analysis
      • Market Share Analysis, 2024
        • By Function
        • By Product Type
        • By Channel
        • By Claim
    • Thailand
      • Pricing Analysis
      • Market Share Analysis, 2024
        • By Function
        • By Product Type
        • By Channel
        • By Claim
    • Indonesia
      • Pricing Analysis
      • Market Share Analysis, 2024
        • By Function
        • By Product Type
        • By Channel
        • By Claim
    • Australia
      • Pricing Analysis
      • Market Share Analysis, 2024
        • By Function
        • By Product Type
        • By Channel
        • By Claim
    • New Zealand
      • Pricing Analysis
      • Market Share Analysis, 2024
        • By Function
        • By Product Type
        • By Channel
        • By Claim
    • Turkey
      • Pricing Analysis
      • Market Share Analysis, 2024
        • By Function
        • By Product Type
        • By Channel
        • By Claim
    • UAE
      • Pricing Analysis
      • Market Share Analysis, 2024
        • By Function
        • By Product Type
        • By Channel
        • By Claim
    • Saudi Arabia
      • Pricing Analysis
      • Market Share Analysis, 2024
        • By Function
        • By Product Type
        • By Channel
        • By Claim
    • Israel
      • Pricing Analysis
      • Market Share Analysis, 2024
        • By Function
        • By Product Type
        • By Channel
        • By Claim
    • North Africa
      • Pricing Analysis
      • Market Share Analysis, 2024
        • By Function
        • By Product Type
        • By Channel
        • By Claim
    • South Africa
      • Pricing Analysis
      • Market Share Analysis, 2024
        • By Function
        • By Product Type
        • By Channel
        • By Claim
  17. Market Structure Analysis
    • Competition Dashboard
    • Competition Benchmarking
    • Market Share Analysis of Top Players
      • By Regional
      • By Function
      • By Product Type
      • By Channel
      • By Claim
  18. Competition Analysis
    • Competition Deep Dive
      • Supergoop!
        • Overview
        • Product Portfolio
        • Profitability by Market Segments (Product/Age /Sales Channel/Region)
        • Sales Footprint
        • Strategy Overview
          • Marketing Strategy
          • Product Strategy
          • Channel Strategy
      • La Roche-Posay
        • Overview
        • Product Portfolio
        • Profitability by Market Segments (Product/Age /Sales Channel/Region)
        • Sales Footprint
        • Strategy Overview
          • Marketing Strategy
          • Product Strategy
          • Channel Strategy
      • Shiseido
        • Overview
        • Product Portfolio
        • Profitability by Market Segments (Product/Age /Sales Channel/Region)
        • Sales Footprint
        • Strategy Overview
          • Marketing Strategy
          • Product Strategy
          • Channel Strategy
      • Neutrogena
        • Overview
        • Product Portfolio
        • Profitability by Market Segments (Product/Age /Sales Channel/Region)
        • Sales Footprint
        • Strategy Overview
          • Marketing Strategy
          • Product Strategy
          • Channel Strategy
      • EltaMD
        • Overview
        • Product Portfolio
        • Profitability by Market Segments (Product/Age /Sales Channel/Region)
        • Sales Footprint
        • Strategy Overview
          • Marketing Strategy
          • Product Strategy
          • Channel Strategy
      • Coola
        • Overview
        • Product Portfolio
        • Profitability by Market Segments (Product/Age /Sales Channel/Region)
        • Sales Footprint
        • Strategy Overview
          • Marketing Strategy
          • Product Strategy
          • Channel Strategy
      • Bioderma
        • Overview
        • Product Portfolio
        • Profitability by Market Segments (Product/Age /Sales Channel/Region)
        • Sales Footprint
        • Strategy Overview
          • Marketing Strategy
          • Product Strategy
          • Channel Strategy
      • ISDIN
        • Overview
        • Product Portfolio
        • Profitability by Market Segments (Product/Age /Sales Channel/Region)
        • Sales Footprint
        • Strategy Overview
          • Marketing Strategy
          • Product Strategy
          • Channel Strategy
      • Dr. Dennis Gross
        • Overview
        • Product Portfolio
        • Profitability by Market Segments (Product/Age /Sales Channel/Region)
        • Sales Footprint
        • Strategy Overview
          • Marketing Strategy
          • Product Strategy
          • Channel Strategy
      • Olay
        • Overview
        • Product Portfolio
        • Profitability by Market Segments (Product/Age /Sales Channel/Region)
        • Sales Footprint
        • Strategy Overview
          • Marketing Strategy
          • Product Strategy
          • Channel Strategy
  19. Assumptions & Acronyms Used
  20. Research Methodology

List of Tables

  • Table 1: Global Market Value (USD Million) Forecast by Region, 2020-2035
  • Table 2: Global Market Volume (Units) Forecast by Region, 2020-2035
  • Table 3: Global Market Value (USD Million) Forecast by Function, 2020-2035
  • Table 4: Global Market Volume (Units) Forecast by Function, 2020-2035
  • Table 5: Global Market Value (USD Million) Forecast by Product Type, 2020-2035
  • Table 6: Global Market Volume (Units) Forecast by Product Type, 2020-2035
  • Table 7: Global Market Value (USD Million) Forecast by Channel, 2020-2035
  • Table 8: Global Market Volume (Units) Forecast by Channel, 2020-2035
  • Table 9: Global Market Value (USD Million) Forecast by Claim, 2020-2035
  • Table 10: Global Market Volume (Units) Forecast by Claim, 2020-2035
  • Table 11: North America Market Value (USD Million) Forecast by Country, 2020-2035
  • Table 12: North America Market Volume (Units) Forecast by Country, 2020-2035
  • Table 13: North America Market Value (USD Million) Forecast by Function, 2020-2035
  • Table 14: North America Market Volume (Units) Forecast by Function, 2020-2035
  • Table 15: North America Market Value (USD Million) Forecast by Product Type, 2020-2035
  • Table 16: North America Market Volume (Units) Forecast by Product Type, 2020-2035
  • Table 17: North America Market Value (USD Million) Forecast by Channel, 2020-2035
  • Table 18: North America Market Volume (Units) Forecast by Channel, 2020-2035
  • Table 19: North America Market Value (USD Million) Forecast by Claim, 2020-2035
  • Table 20: North America Market Volume (Units) Forecast by Claim, 2020-2035
  • Table 21: Latin America Market Value (USD Million) Forecast by Country, 2020-2035
  • Table 22: Latin America Market Volume (Units) Forecast by Country, 2020-2035
  • Table 23: Latin America Market Value (USD Million) Forecast by Function, 2020-2035
  • Table 24: Latin America Market Volume (Units) Forecast by Function, 2020-2035
  • Table 25: Latin America Market Value (USD Million) Forecast by Product Type, 2020-2035
  • Table 26: Latin America Market Volume (Units) Forecast by Product Type, 2020-2035
  • Table 27: Latin America Market Value (USD Million) Forecast by Channel, 2020-2035
  • Table 28: Latin America Market Volume (Units) Forecast by Channel, 2020-2035
  • Table 29: Latin America Market Value (USD Million) Forecast by Claim, 2020-2035
  • Table 30: Latin America Market Volume (Units) Forecast by Claim, 2020-2035
  • Table 31: Europe Market Value (USD Million) Forecast by Country, 2020-2035
  • Table 32: Europe Market Volume (Units) Forecast by Country, 2020-2035
  • Table 33: Europe Market Value (USD Million) Forecast by Function, 2020-2035
  • Table 34: Europe Market Volume (Units) Forecast by Function, 2020-2035
  • Table 35: Europe Market Value (USD Million) Forecast by Product Type, 2020-2035
  • Table 36: Europe Market Volume (Units) Forecast by Product Type, 2020-2035
  • Table 37: Europe Market Value (USD Million) Forecast by Channel, 2020-2035
  • Table 38: Europe Market Volume (Units) Forecast by Channel, 2020-2035
  • Table 39: Europe Market Value (USD Million) Forecast by Claim, 2020-2035
  • Table 40: Europe Market Volume (Units) Forecast by Claim, 2020-2035
  • Table 41: East Asia Market Value (USD Million) Forecast by Country, 2020-2035
  • Table 42: East Asia Market Volume (Units) Forecast by Country, 2020-2035
  • Table 43: East Asia Market Value (USD Million) Forecast by Function, 2020-2035
  • Table 44: East Asia Market Volume (Units) Forecast by Function, 2020-2035
  • Table 45: East Asia Market Value (USD Million) Forecast by Product Type, 2020-2035
  • Table 46: East Asia Market Volume (Units) Forecast by Product Type, 2020-2035
  • Table 47: East Asia Market Value (USD Million) Forecast by Channel, 2020-2035
  • Table 48: East Asia Market Volume (Units) Forecast by Channel, 2020-2035
  • Table 49: East Asia Market Value (USD Million) Forecast by Claim, 2020-2035
  • Table 50: East Asia Market Volume (Units) Forecast by Claim, 2020-2035
  • Table 51: South Asia & Pacific Market Value (USD Million) Forecast by Country, 2020-2035
  • Table 52: South Asia & Pacific Market Volume (Units) Forecast by Country, 2020-2035
  • Table 53: South Asia & Pacific Market Value (USD Million) Forecast by Function, 2020-2035
  • Table 54: South Asia & Pacific Market Volume (Units) Forecast by Function, 2020-2035
  • Table 55: South Asia & Pacific Market Value (USD Million) Forecast by Product Type, 2020-2035
  • Table 56: South Asia & Pacific Market Volume (Units) Forecast by Product Type, 2020-2035
  • Table 57: South Asia & Pacific Market Value (USD Million) Forecast by Channel, 2020-2035
  • Table 58: South Asia & Pacific Market Volume (Units) Forecast by Channel, 2020-2035
  • Table 59: South Asia & Pacific Market Value (USD Million) Forecast by Claim, 2020-2035
  • Table 60: South Asia & Pacific Market Volume (Units) Forecast by Claim, 2020-2035
  • Table 61: Middle East and Africa Market Value (USD Million) Forecast by Country, 2020-2035
  • Table 62: Middle East and Africa Market Volume (Units) Forecast by Country, 2020-2035
  • Table 63: Middle East and Africa Market Value (USD Million) Forecast by Function, 2020-2035
  • Table 64: Middle East and Africa Market Volume (Units) Forecast by Function, 2020-2035
  • Table 65: Middle East and Africa Market Value (USD Million) Forecast by Product Type, 2020-2035
  • Table 66: Middle East and Africa Market Volume (Units) Forecast by Product Type, 2020-2035
  • Table 67: Middle East and Africa Market Value (USD Million) Forecast by Channel, 2020-2035
  • Table 68: Middle East and Africa Market Volume (Units) Forecast by Channel, 2020-2035
  • Table 69: Middle East and Africa Market Value (USD Million) Forecast by Claim, 2020-2035
  • Table 70: Middle East and Africa Market Volume (Units) Forecast by Claim, 2020-2035

List of Figures

  • Figure 1: Global Market Value (USD Million) by Function, 2025-2035
  • Figure 2: Global Market Value (USD Million) by Product Type, 2025-2035
  • Figure 3: Global Market Value (USD Million) by Channel, 2025-2035
  • Figure 4: Global Market Value (USD Million) by Claim, 2025-2035
  • Figure 5: Global Market Value (USD Million) by Region, 2025-2035
  • Figure 6: Global Market Value (USD Million) Analysis by Region, 2020-2035
  • Figure 7: Global Market Volume (Units) Analysis by Region, 2020-2035
  • Figure 8: Global Market Value Share (%) and BPS Analysis by Region, 2025-2035
  • Figure 9: Global Market Y-o-Y Growth (%) Projections by Region, 2025-2035
  • Figure 10: Global Market Value (USD Million) Analysis by Function, 2020-2035
  • Figure 11: Global Market Volume (Units) Analysis by Function, 2020-2035
  • Figure 12: Global Market Value Share (%) and BPS Analysis by Function, 2025-2035
  • Figure 13: Global Market Y-o-Y Growth (%) Projections by Function, 2025-2035
  • Figure 14: Global Market Value (USD Million) Analysis by Product Type, 2020-2035
  • Figure 15: Global Market Volume (Units) Analysis by Product Type, 2020-2035
  • Figure 16: Global Market Value Share (%) and BPS Analysis by Product Type, 2025-2035
  • Figure 17: Global Market Y-o-Y Growth (%) Projections by Product Type, 2025-2035
  • Figure 18: Global Market Value (USD Million) Analysis by Channel, 2020-2035
  • Figure 19: Global Market Volume (Units) Analysis by Channel, 2020-2035
  • Figure 20: Global Market Value Share (%) and BPS Analysis by Channel, 2025-2035
  • Figure 21: Global Market Y-o-Y Growth (%) Projections by Channel, 2025-2035
  • Figure 22: Global Market Value (USD Million) Analysis by Claim, 2020-2035
  • Figure 23: Global Market Volume (Units) Analysis by Claim, 2020-2035
  • Figure 24: Global Market Value Share (%) and BPS Analysis by Claim, 2025-2035
  • Figure 25: Global Market Y-o-Y Growth (%) Projections by Claim, 2025-2035
  • Figure 26: Global Market Attractiveness by Function, 2025-2035
  • Figure 27: Global Market Attractiveness by Product Type, 2025-2035
  • Figure 28: Global Market Attractiveness by Channel, 2025-2035
  • Figure 29: Global Market Attractiveness by Claim, 2025-2035
  • Figure 30: Global Market Attractiveness by Region, 2025-2035
  • Figure 31: North America Market Value (USD Million) by Function, 2025-2035
  • Figure 32: North America Market Value (USD Million) by Product Type, 2025-2035
  • Figure 33: North America Market Value (USD Million) by Channel, 2025-2035
  • Figure 34: North America Market Value (USD Million) by Claim, 2025-2035
  • Figure 35: North America Market Value (USD Million) by Country, 2025-2035
  • Figure 36: North America Market Value (USD Million) Analysis by Country, 2020-2035
  • Figure 37: North America Market Volume (Units) Analysis by Country, 2020-2035
  • Figure 38: North America Market Value Share (%) and BPS Analysis by Country, 2025-2035
  • Figure 39: North America Market Y-o-Y Growth (%) Projections by Country, 2025-2035
  • Figure 40: North America Market Value (USD Million) Analysis by Function, 2020-2035
  • Figure 41: North America Market Volume (Units) Analysis by Function, 2020-2035
  • Figure 42: North America Market Value Share (%) and BPS Analysis by Function, 2025-2035
  • Figure 43: North America Market Y-o-Y Growth (%) Projections by Function, 2025-2035
  • Figure 44: North America Market Value (USD Million) Analysis by Product Type, 2020-2035
  • Figure 45: North America Market Volume (Units) Analysis by Product Type, 2020-2035
  • Figure 46: North America Market Value Share (%) and BPS Analysis by Product Type, 2025-2035
  • Figure 47: North America Market Y-o-Y Growth (%) Projections by Product Type, 2025-2035
  • Figure 48: North America Market Value (USD Million) Analysis by Channel, 2020-2035
  • Figure 49: North America Market Volume (Units) Analysis by Channel, 2020-2035
  • Figure 50: North America Market Value Share (%) and BPS Analysis by Channel, 2025-2035
  • Figure 51: North America Market Y-o-Y Growth (%) Projections by Channel, 2025-2035
  • Figure 52: North America Market Value (USD Million) Analysis by Claim, 2020-2035
  • Figure 53: North America Market Volume (Units) Analysis by Claim, 2020-2035
  • Figure 54: North America Market Value Share (%) and BPS Analysis by Claim, 2025-2035
  • Figure 55: North America Market Y-o-Y Growth (%) Projections by Claim, 2025-2035
  • Figure 56: North America Market Attractiveness by Function, 2025-2035
  • Figure 57: North America Market Attractiveness by Product Type, 2025-2035
  • Figure 58: North America Market Attractiveness by Channel, 2025-2035
  • Figure 59: North America Market Attractiveness by Claim, 2025-2035
  • Figure 60: North America Market Attractiveness by Country, 2025-2035
  • Figure 61: Latin America Market Value (USD Million) by Function, 2025-2035
  • Figure 62: Latin America Market Value (USD Million) by Product Type, 2025-2035
  • Figure 63: Latin America Market Value (USD Million) by Channel, 2025-2035
  • Figure 64: Latin America Market Value (USD Million) by Claim, 2025-2035
  • Figure 65: Latin America Market Value (USD Million) by Country, 2025-2035
  • Figure 66: Latin America Market Value (USD Million) Analysis by Country, 2020-2035
  • Figure 67: Latin America Market Volume (Units) Analysis by Country, 2020-2035
  • Figure 68: Latin America Market Value Share (%) and BPS Analysis by Country, 2025-2035
  • Figure 69: Latin America Market Y-o-Y Growth (%) Projections by Country, 2025-2035
  • Figure 70: Latin America Market Value (USD Million) Analysis by Function, 2020-2035
  • Figure 71: Latin America Market Volume (Units) Analysis by Function, 2020-2035
  • Figure 72: Latin America Market Value Share (%) and BPS Analysis by Function, 2025-2035
  • Figure 73: Latin America Market Y-o-Y Growth (%) Projections by Function, 2025-2035
  • Figure 74: Latin America Market Value (USD Million) Analysis by Product Type, 2020-2035
  • Figure 75: Latin America Market Volume (Units) Analysis by Product Type, 2020-2035
  • Figure 76: Latin America Market Value Share (%) and BPS Analysis by Product Type, 2025-2035
  • Figure 77: Latin America Market Y-o-Y Growth (%) Projections by Product Type, 2025-2035
  • Figure 78: Latin America Market Value (USD Million) Analysis by Channel, 2020-2035
  • Figure 79: Latin America Market Volume (Units) Analysis by Channel, 2020-2035
  • Figure 80: Latin America Market Value Share (%) and BPS Analysis by Channel, 2025-2035
  • Figure 81: Latin America Market Y-o-Y Growth (%) Projections by Channel, 2025-2035
  • Figure 82: Latin America Market Value (USD Million) Analysis by Claim, 2020-2035
  • Figure 83: Latin America Market Volume (Units) Analysis by Claim, 2020-2035
  • Figure 84: Latin America Market Value Share (%) and BPS Analysis by Claim, 2025-2035
  • Figure 85: Latin America Market Y-o-Y Growth (%) Projections by Claim, 2025-2035
  • Figure 86: Latin America Market Attractiveness by Function, 2025-2035
  • Figure 87: Latin America Market Attractiveness by Product Type, 2025-2035
  • Figure 88: Latin America Market Attractiveness by Channel, 2025-2035
  • Figure 89: Latin America Market Attractiveness by Claim, 2025-2035
  • Figure 90: Latin America Market Attractiveness by Country, 2025-2035
  • Figure 91: Europe Market Value (USD Million) by Function, 2025-2035
  • Figure 92: Europe Market Value (USD Million) by Product Type, 2025-2035
  • Figure 93: Europe Market Value (USD Million) by Channel, 2025-2035
  • Figure 94: Europe Market Value (USD Million) by Claim, 2025-2035
  • Figure 95: Europe Market Value (USD Million) by Country, 2025-2035
  • Figure 96: Europe Market Value (USD Million) Analysis by Country, 2020-2035
  • Figure 97: Europe Market Volume (Units) Analysis by Country, 2020-2035
  • Figure 98: Europe Market Value Share (%) and BPS Analysis by Country, 2025-2035
  • Figure 99: Europe Market Y-o-Y Growth (%) Projections by Country, 2025-2035
  • Figure 100: Europe Market Value (USD Million) Analysis by Function, 2020-2035
  • Figure 101: Europe Market Volume (Units) Analysis by Function, 2020-2035
  • Figure 102: Europe Market Value Share (%) and BPS Analysis by Function, 2025-2035
  • Figure 103: Europe Market Y-o-Y Growth (%) Projections by Function, 2025-2035
  • Figure 104: Europe Market Value (USD Million) Analysis by Product Type, 2020-2035
  • Figure 105: Europe Market Volume (Units) Analysis by Product Type, 2020-2035
  • Figure 106: Europe Market Value Share (%) and BPS Analysis by Product Type, 2025-2035
  • Figure 107: Europe Market Y-o-Y Growth (%) Projections by Product Type, 2025-2035
  • Figure 108: Europe Market Value (USD Million) Analysis by Channel, 2020-2035
  • Figure 109: Europe Market Volume (Units) Analysis by Channel, 2020-2035
  • Figure 110: Europe Market Value Share (%) and BPS Analysis by Channel, 2025-2035
  • Figure 111: Europe Market Y-o-Y Growth (%) Projections by Channel, 2025-2035
  • Figure 112: Europe Market Value (USD Million) Analysis by Claim, 2020-2035
  • Figure 113: Europe Market Volume (Units) Analysis by Claim, 2020-2035
  • Figure 114: Europe Market Value Share (%) and BPS Analysis by Claim, 2025-2035
  • Figure 115: Europe Market Y-o-Y Growth (%) Projections by Claim, 2025-2035
  • Figure 116: Europe Market Attractiveness by Function, 2025-2035
  • Figure 117: Europe Market Attractiveness by Product Type, 2025-2035
  • Figure 118: Europe Market Attractiveness by Channel, 2025-2035
  • Figure 119: Europe Market Attractiveness by Claim, 2025-2035
  • Figure 120: Europe Market Attractiveness by Country, 2025-2035
  • Figure 121: East Asia Market Value (USD Million) by Function, 2025-2035
  • Figure 122: East Asia Market Value (USD Million) by Product Type, 2025-2035
  • Figure 123: East Asia Market Value (USD Million) by Channel, 2025-2035
  • Figure 124: East Asia Market Value (USD Million) by Claim, 2025-2035
  • Figure 125: East Asia Market Value (USD Million) by Country, 2025-2035
  • Figure 126: East Asia Market Value (USD Million) Analysis by Country, 2020-2035
  • Figure 127: East Asia Market Volume (Units) Analysis by Country, 2020-2035
  • Figure 128: East Asia Market Value Share (%) and BPS Analysis by Country, 2025-2035
  • Figure 129: East Asia Market Y-o-Y Growth (%) Projections by Country, 2025-2035
  • Figure 130: East Asia Market Value (USD Million) Analysis by Function, 2020-2035
  • Figure 131: East Asia Market Volume (Units) Analysis by Function, 2020-2035
  • Figure 132: East Asia Market Value Share (%) and BPS Analysis by Function, 2025-2035
  • Figure 133: East Asia Market Y-o-Y Growth (%) Projections by Function, 2025-2035
  • Figure 134: East Asia Market Value (USD Million) Analysis by Product Type, 2020-2035
  • Figure 135: East Asia Market Volume (Units) Analysis by Product Type, 2020-2035
  • Figure 136: East Asia Market Value Share (%) and BPS Analysis by Product Type, 2025-2035
  • Figure 137: East Asia Market Y-o-Y Growth (%) Projections by Product Type, 2025-2035
  • Figure 138: East Asia Market Value (USD Million) Analysis by Channel, 2020-2035
  • Figure 139: East Asia Market Volume (Units) Analysis by Channel, 2020-2035
  • Figure 140: East Asia Market Value Share (%) and BPS Analysis by Channel, 2025-2035
  • Figure 141: East Asia Market Y-o-Y Growth (%) Projections by Channel, 2025-2035
  • Figure 142: East Asia Market Value (USD Million) Analysis by Claim, 2020-2035
  • Figure 143: East Asia Market Volume (Units) Analysis by Claim, 2020-2035
  • Figure 144: East Asia Market Value Share (%) and BPS Analysis by Claim, 2025-2035
  • Figure 145: East Asia Market Y-o-Y Growth (%) Projections by Claim, 2025-2035
  • Figure 146: East Asia Market Attractiveness by Function, 2025-2035
  • Figure 147: East Asia Market Attractiveness by Product Type, 2025-2035
  • Figure 148: East Asia Market Attractiveness by Channel, 2025-2035
  • Figure 149: East Asia Market Attractiveness by Claim, 2025-2035
  • Figure 150: East Asia Market Attractiveness by Country, 2025-2035
  • Figure 151: South Asia & Pacific Market Value (USD Million) by Function, 2025-2035
  • Figure 152: South Asia & Pacific Market Value (USD Million) by Product Type, 2025-2035
  • Figure 153: South Asia & Pacific Market Value (USD Million) by Channel, 2025-2035
  • Figure 154: South Asia & Pacific Market Value (USD Million) by Claim, 2025-2035
  • Figure 155: South Asia & Pacific Market Value (USD Million) by Country, 2025-2035
  • Figure 156: South Asia & Pacific Market Value (USD Million) Analysis by Country, 2020-2035
  • Figure 157: South Asia & Pacific Market Volume (Units) Analysis by Country, 2020-2035
  • Figure 158: South Asia & Pacific Market Value Share (%) and BPS Analysis by Country, 2025-2035
  • Figure 159: South Asia & Pacific Market Y-o-Y Growth (%) Projections by Country, 2025-2035
  • Figure 160: South Asia & Pacific Market Value (USD Million) Analysis by Function, 2020-2035
  • Figure 161: South Asia & Pacific Market Volume (Units) Analysis by Function, 2020-2035
  • Figure 162: South Asia & Pacific Market Value Share (%) and BPS Analysis by Function, 2025-2035
  • Figure 163: South Asia & Pacific Market Y-o-Y Growth (%) Projections by Function, 2025-2035
  • Figure 164: South Asia & Pacific Market Value (USD Million) Analysis by Product Type, 2020-2035
  • Figure 165: South Asia & Pacific Market Volume (Units) Analysis by Product Type, 2020-2035
  • Figure 166: South Asia & Pacific Market Value Share (%) and BPS Analysis by Product Type, 2025-2035
  • Figure 167: South Asia & Pacific Market Y-o-Y Growth (%) Projections by Product Type, 2025-2035
  • Figure 168: South Asia & Pacific Market Value (USD Million) Analysis by Channel, 2020-2035
  • Figure 169: South Asia & Pacific Market Volume (Units) Analysis by Channel, 2020-2035
  • Figure 170: South Asia & Pacific Market Value Share (%) and BPS Analysis by Channel, 2025-2035
  • Figure 171: South Asia & Pacific Market Y-o-Y Growth (%) Projections by Channel, 2025-2035
  • Figure 172: South Asia & Pacific Market Value (USD Million) Analysis by Claim, 2020-2035
  • Figure 173: South Asia & Pacific Market Volume (Units) Analysis by Claim, 2020-2035
  • Figure 174: South Asia & Pacific Market Value Share (%) and BPS Analysis by Claim, 2025-2035
  • Figure 175: South Asia & Pacific Market Y-o-Y Growth (%) Projections by Claim, 2025-2035
  • Figure 176: South Asia & Pacific Market Attractiveness by Function, 2025-2035
  • Figure 177: South Asia & Pacific Market Attractiveness by Product Type, 2025-2035
  • Figure 178: South Asia & Pacific Market Attractiveness by Channel, 2025-2035
  • Figure 179: South Asia & Pacific Market Attractiveness by Claim, 2025-2035
  • Figure 180: South Asia & Pacific Market Attractiveness by Country, 2025-2035
  • Figure 181: Middle East and Africa Market Value (USD Million) by Function, 2025-2035
  • Figure 182: Middle East and Africa Market Value (USD Million) by Product Type, 2025-2035
  • Figure 183: Middle East and Africa Market Value (USD Million) by Channel, 2025-2035
  • Figure 184: Middle East and Africa Market Value (USD Million) by Claim, 2025-2035
  • Figure 185: Middle East and Africa Market Value (USD Million) by Country, 2025-2035
  • Figure 186: Middle East and Africa Market Value (USD Million) Analysis by Country, 2020-2035
  • Figure 187: Middle East and Africa Market Volume (Units) Analysis by Country, 2020-2035
  • Figure 188: Middle East and Africa Market Value Share (%) and BPS Analysis by Country, 2025-2035
  • Figure 189: Middle East and Africa Market Y-o-Y Growth (%) Projections by Country, 2025-2035
  • Figure 190: Middle East and Africa Market Value (USD Million) Analysis by Function, 2020-2035
  • Figure 191: Middle East and Africa Market Volume (Units) Analysis by Function, 2020-2035
  • Figure 192: Middle East and Africa Market Value Share (%) and BPS Analysis by Function, 2025-2035
  • Figure 193: Middle East and Africa Market Y-o-Y Growth (%) Projections by Function, 2025-2035
  • Figure 194: Middle East and Africa Market Value (USD Million) Analysis by Product Type, 2020-2035
  • Figure 195: Middle East and Africa Market Volume (Units) Analysis by Product Type, 2020-2035
  • Figure 196: Middle East and Africa Market Value Share (%) and BPS Analysis by Product Type, 2025-2035
  • Figure 197: Middle East and Africa Market Y-o-Y Growth (%) Projections by Product Type, 2025-2035
  • Figure 198: Middle East and Africa Market Value (USD Million) Analysis by Channel, 2020-2035
  • Figure 199: Middle East and Africa Market Volume (Units) Analysis by Channel, 2020-2035
  • Figure 200: Middle East and Africa Market Value Share (%) and BPS Analysis by Channel, 2025-2035
  • Figure 201: Middle East and Africa Market Y-o-Y Growth (%) Projections by Channel, 2025-2035
  • Figure 202: Middle East and Africa Market Value (USD Million) Analysis by Claim, 2020-2035
  • Figure 203: Middle East and Africa Market Volume (Units) Analysis by Claim, 2020-2035
  • Figure 204: Middle East and Africa Market Value Share (%) and BPS Analysis by Claim, 2025-2035
  • Figure 205: Middle East and Africa Market Y-o-Y Growth (%) Projections by Claim, 2025-2035
  • Figure 206: Middle East and Africa Market Attractiveness by Function, 2025-2035
  • Figure 207: Middle East and Africa Market Attractiveness by Product Type, 2025-2035
  • Figure 208: Middle East and Africa Market Attractiveness by Channel, 2025-2035
  • Figure 209: Middle East and Africa Market Attractiveness by Claim, 2025-2035
  • Figure 210: Middle East and Africa Market Attractiveness by Country, 2025-2035

Frequently Asked Questions

How big is the Global Smart SPF Complexes Market in 2025?

The Global Smart SPF Complexes Market is estimated to be valued at USD 2,450.3 million in 2025.

What will be the size of the Global Smart SPF Complexes Market in 2035?

The market size for the Global Smart SPF Complexes Market is projected to reach USD 7,982.5 million by 2035.

How much will the Global Smart SPF Complexes Market grow between 2025 and 2035?

The Global Smart SPF Complexes Market is expected to grow at a 12.5% CAGR between 2025 and 2035.

What are the key product types in the Global Smart SPF Complexes Market?

The key product types in the Global Smart SPF Complexes Market are creams/lotions, serums, sticks, and sprays/mists.

Which function segment will contribute significant share in the Global Smart SPF Complexes Market in 2025?

In terms of function, the UV protection segment is projected to command 57.6% share in the Global Smart SPF Complexes Market in 2025, valued at USD 1,411.1 million.

Explore Similar Insights

Future Market Insights

Smart SPF Complexes Market

Chat With

MaRIA

Hi There, I am MaRIA, Your Market Research Intelligence Assistant. How may I help you?