Demand for Pea Protein in Dairy Alternatives Size and Share Forecast Outlook 2025 to 2035

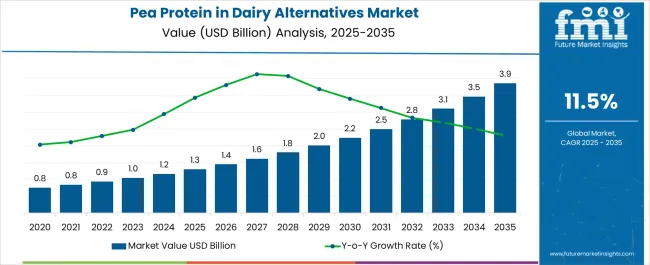
Global demand for pea protein in dairy alternatives is estimated at USD 1.3 billion in 2025, with projections indicating a rise to USD 3.9 billion by 2035, reflecting a CAGR of approximately 11.5% over the forecast period. This growth reflects both expanding consumer adoption and increased per capita consumption across major economies. The rise in demand is linked to growing lactose intolerance awareness, sustainability preferences, and the functional advantages of pea protein in alternative dairy formulations. By 2025, per capita consumption in leading countries such as the United States, China, and Germany averages between 2.1 to 2.8 kilograms, with projections reaching 3.5 kilograms by 2035. India leads among developing economies, expected to generate substantial growth in pea protein-based dairy alternatives by 2035, driven by rising plant-based beverage adoption and health consciousness.
Quick Stats for Pea Protein in Dairy Alternatives Demand

  • Pea Protein Dairy Alternatives Demand Value (2025): USD 1.3 billion
  • Pea Protein Dairy Alternatives Forecast Value (2035): USD 3.9 billion
  • Pea Protein Dairy Alternatives Forecast CAGR (2025 to 2035): 11.5%
  • Leading Segment in Pea Protein Dairy Alternatives by Product (2025): Plant-based Milk (49%)
  • Leading Segment in Pea Protein Dairy Alternatives by Distribution (2025): Retail Channels (52%)
  • Fastest Growing Country for Pea Protein Dairy Alternatives: India
  • Key Players in Pea Protein Dairy Alternatives Demand Space: Ripple Foods, Nestlé, Danone, Oatly, Roquette Frères

Pea Protein In Dairy Alternatives Market Market Value Analysis

Demand for Pea Protein in Dairy Alternatives Key Takeaways

The largest contribution to demand continues to come from plant-based milk products, which are expected to account for 49% of total consumption in 2025, owing to mainstream retail penetration, consumer familiarity, and technological improvements in taste and texture. By distribution channel, retail outlets including supermarkets and hypermarkets represent the dominant sales format, responsible for 52% of all transactions, while online and direct-to-consumer platforms are expanding rapidly.

Consumer adoption is particularly concentrated among health-conscious millennials and lactose-intolerant populations, with urbanization and disposable income emerging as significant drivers of demand. While cost remains a consideration, the price differential between pea protein dairy alternatives and conventional dairy products has narrowed significantly. Continued improvements in processing technology and supply chain efficiency are expected to accelerate affordability and access across middle-income households. Regional disparities persist, but per capita demand in emerging Asian economies is closing the gap with established Western consumption patterns.

Why Pea Protein in Dairy Alternatives is Growing?

The rising consumer demand for plant-based, allergen-free, and sustainable protein sources is driving the adoption of pea protein in dairy alternatives. Pea protein delivers a clean-label, non-GMO, and lactose-free option that appeals to health-conscious consumers as well as those with dairy or soy allergies. Its neutral taste, creamy texture, and strong nutritional profile-rich in essential amino acids and easily digestible-make it highly suitable for applications in plant-based milk, yogurt, cheese, and ice cream.

Food manufacturers are increasingly leveraging pea protein to enhance functionality, mouthfeel, and protein content in dairy alternatives without compromising on flavor or quality. The growing popularity of vegan and flexitarian diets, coupled with sustainability benefits such as lower water use and reduced carbon footprint compared to animal dairy, is fueling market expansion.

Investments in processing technologies and product innovation are improving solubility, taste masking, and fortification capabilities, further accelerating adoption. Broader retail availability and consumer preference for environmentally responsible choices are providing competitive advantages for brands incorporating pea protein into next-generation dairy alternatives.

Segmental Analysis

The pea protein dairy alternatives segment globally is classified across several categories. By dairy alternative product, the key segments include plant-based milk, yogurt alternatives, cheese alternatives, and ice cream and desserts. By pea protein type, formulations span isolates, concentrates, and hydrolyzed functional proteins. By distribution channel, the segment covers retail outlets, online and direct-to-consumer platforms, and foodservice establishments. By country, the segmentation is as India, China, USA, Germany, along with other countries.
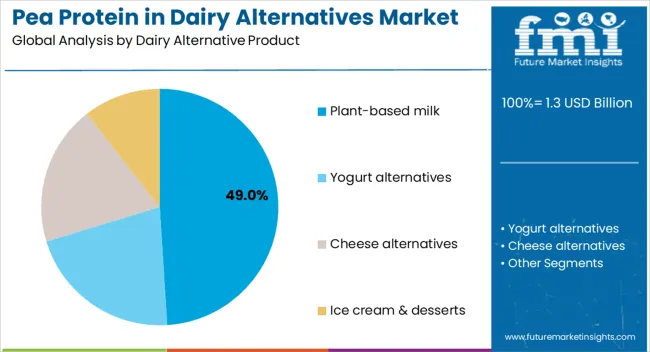
By Dairy Alternative Product, Plant-based Milk to Lead with 49% Share

Pea Protein In Dairy Alternatives Market Analysis By Dairy Alternative Product

Plant-based milk products are projected to dominate consumption in 2025, supported by widespread retail availability, consumer acceptance, and continuous product innovation. Other categories including yogurt alternatives, cheese alternatives, and frozen desserts are gaining momentum across diverse demographic segments.
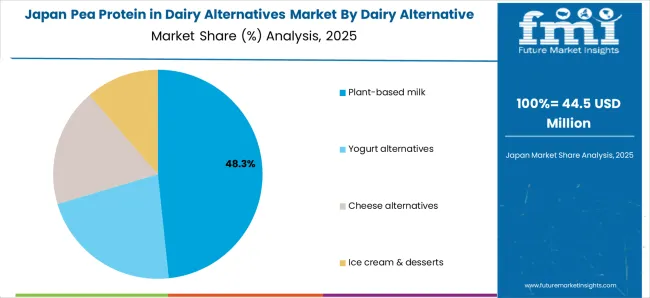
  • Plant-based milk is expected to hold a 49% value share in 2025, driven by high consumption frequency, brand proliferation, and consumer familiarity with milk replacement in cereals, beverages, and cooking applications using pea protein isolates and concentrates.
  • Yogurt alternatives are gaining substantial traction in developed economies, particularly among health-conscious consumers and households seeking probiotic benefits, supported by improved texture profiles and flavor varieties using specialized pea protein formulations.
  • Cheese alternatives represent an emerging growth segment with 17% share, showing strong momentum in foodservice applications and home cooking, with manufacturers leveraging pea protein's functional properties for melting and stretching characteristics.
  • Ice cream and desserts, while maintaining an 8% share, demonstrate strong innovation potential through premium positioning and indulgent formulations that capitalize on pea protein's neutral flavor profile and creamy texture capabilities.

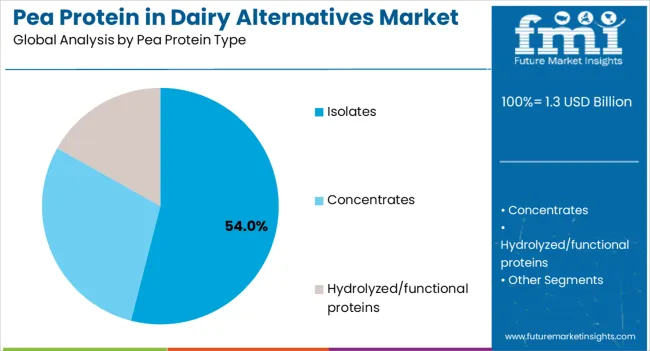
By Pea Protein Type, Isolates to Lead with 54% Share

Pea Protein In Dairy Alternatives Market Analysis By Pea Protein Type

Pea protein dairy alternatives globally utilize various protein processing levels, selected for functionality, cost efficiency, and nutritional density. Isolates remain the most widely adopted protein input due to their high protein content and versatility across product applications.
  • Isolates are projected to account for 54% of total consumption in 2025, supported by superior protein concentration, neutral taste profiles, and optimal performance in both liquid and solid dairy alternative formulations across temperature ranges.
  • Concentrates maintain strong adoption with 28% share, particularly favored for cost-sensitive applications and products targeting mainstream consumer segments, offering balanced functionality and economic viability for large-scale production.
  • Hydrolyzed and functional proteins capture 18% of consumption, primarily utilized in premium and specialized products requiring enhanced digestibility, specific texture modification, or targeted nutritional benefits for health-focused consumer segments.

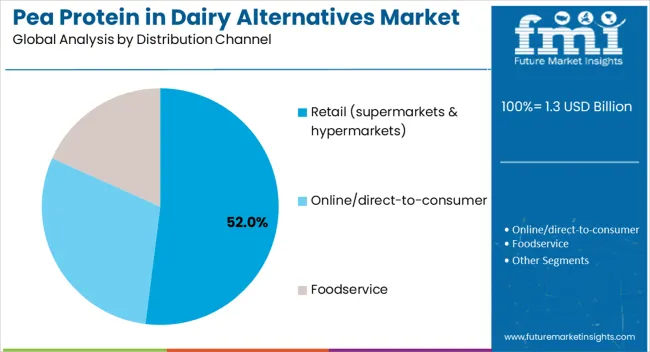
By Distribution Channel, Retail to Lead with 52% Share

Pea Protein In Dairy Alternatives Market Analysis By Distribution Channel

Pea protein dairy alternatives reach consumers through diverse sales channels, each serving distinct shopping behaviors and demographic preferences. Retail outlets maintain dominance while digital platforms and foodservice segments expand rapidly.

  • Retail channels including supermarkets and hypermarkets are expected to account for 52% of total sales in 2025, supported by extensive product placement, promotional activities, and consumer preference for in-person product evaluation before purchase decisions.
  • Online and direct-to-consumer platforms represent 28% of sales, growing at accelerated rates through subscription services, exclusive product launches, and convenience-focused shopping patterns particularly strong among younger consumer demographics.
  • Foodservice establishments contribute 20% to overall consumption, expanding through coffee shops, restaurants, and institutional food providers that incorporate pea protein dairy alternatives into menu offerings and bulk preparation applications.

What are the Drivers, Restraints, and Key Trends of the Pea Protein in Dairy Alternatives?

Plant-Based Demand, Nutritional Advantages, and Sustainability Credentials Driving Adoption

Pea protein is emerging as a leading base ingredient in dairy alternatives such as milk, yogurt, cheese, and creamers, fueled by the global surge in plant-based diets, lactose intolerance awareness, and vegan lifestyles. It offers high-quality amino acid profiles, allergen-free properties (soy- and dairy-free), and good digestibility, making it appealing for health-conscious and flexitarian consumers. Major food brands are investing in fortified pea protein beverages and yogurts to compete with soy, almond, and oat-based alternatives. The ingredient’s sustainability profile—low water use, nitrogen-fixing crop benefits, and minimal land footprint—positions pea protein as a climate-resilient solution in the future protein landscape. Regulatory support for clean-label and allergen-free claims further accelerates adoption.

Taste, Texture, and Cost Challenges Restraining Growth

Despite strong momentum, pea protein faces sensory and formulation hurdles. Its beany flavor and chalky texture can limit consumer acceptance in dairy alternative products compared to creamier oat or almond bases. Formulation with high pea protein content often requires masking agents, flavor enhancers, or blending with other proteins, increasing costs. Production and processing remain more expensive than some competing plant proteins, restricting price competitiveness in mass-market segments. Variability in functional properties across suppliers (solubility, emulsification) creates challenges for product developers. Scaling also depends on stable pea supply chains, which can be impacted by agricultural fluctuations and regional availability.

Blended Formulations, Fermentation Technology, and Clean-Label Fortification Emerging

Key trends include the blending of pea protein with oat, rice, or fava proteins to achieve superior taste, texture, and nutritional balance in dairy alternatives. Precision fermentation and enzymatic processing are being used to reduce off-flavors, improve creaminess, and mimic dairy mouthfeel. Fortification with calcium, vitamins, and probiotics is aligning pea-based alternatives with traditional dairy’s nutritional value while supporting clean-label claims. AI-driven formulation tools are helping brands optimize flavor profiles, reduce sugar, and predict consumer acceptance. Sustainability-driven innovation is linking pea protein with regenerative agriculture and circular economy models, where crop by-products are valorized. These advancements position pea protein as a next-generation backbone of the dairy alternatives market.
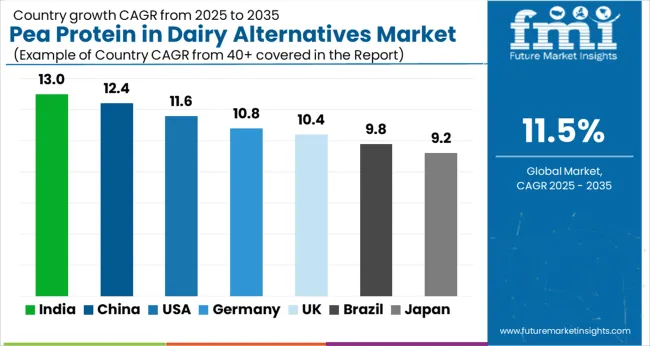
Demand for Pea Protein in Dairy Alternatives by Country

Pea Protein In Dairy Alternatives Market Cagr Analysis By Country

Rising health awareness and expanding middle-class populations in Asian economies give India and China measurable advantages, while mature Western economies grow steadily from established consumption bases. The table below shows the compound annual growth rate (CAGR) each of the seven major countries is expected to record between 2025 and 2035.

Country CAGR (2025 to 2035)
India 13.0%
China 12.4%
USA 11.6%
Germany 10.8%
UK 10.4%
Brazil 9.8%
Japan 9.2%

Between 2025 and 2035, demand for pea protein in dairy alternatives is projected to expand across all major economies, but growth rates will vary significantly based on dietary transitions, regulatory environments, and infrastructure development. Among the seven countries analyzed, India and China are expected to register the fastest compound annual growth rates at 13.0% and 12.4% respectively, driven by substantial population bases and evolving consumption patterns.

Demand Analysis for Pea Protein in Dairy Alternatives in India

India leads global growth projections with rising lactose intolerance awareness driving consumer shifts toward plant-based alternatives. The country's expanding urban population increasingly adopts Western dietary patterns while maintaining traditional preferences for dairy-like products. Domestic manufacturers are investing heavily in pea protein sourcing and processing capabilities to meet growing demand from both established and emerging beverage brands. Per capita consumption of pea protein dairy alternatives is projected to triple between 2025 and 2035, supported by improving distribution networks and declining product costs.

  • Rising middle-class disposable income enables premium plant-based product adoption across metropolitan areas.
  • Government sustainability initiatives encourage domestic pea cultivation and processing infrastructure development.

Demand Analysis for Pea Protein in Dairy Alternatives in China

China follows closely with 12.4% projected growth, fueled by expanding middle-class demand for fortified dairy alternatives and health-focused consumption trends. The country's sophisticated manufacturing ecosystem supports rapid scaling of pea protein processing for both domestic consumption and export production. Urban consumers increasingly prioritize functional nutrition and ingredient transparency, driving adoption of clearly labeled pea protein products. E-commerce platforms facilitate widespread product availability across tier-one through tier-three cities, supporting consistent demand growth.

  • Regulatory approval processes for plant-based ingredients accelerate product innovation and launch timelines.
  • Strategic partnerships between international pea protein suppliers and domestic brands increase formulation sophistication.

Outlook on Demand Analysis for Pea Protein in Dairy Alternatives in USA

United States maintains strong growth momentum at 11.6% CAGR, driven by established consumer acceptance and continuous product innovation from leading brands. Pea protein adoption in alternative milk brands such as Ripple and Silk demonstrates mainstream retail success and consumer satisfaction with taste and nutritional profiles. The country's mature retail infrastructure supports extensive product placement and promotional activities that drive trial and repeat purchases. Foodservice adoption continues expanding through coffee chains and restaurant partnerships that incorporate pea protein alternatives into standard menu offerings.
  • Premium positioning strategies enable higher profit margins for specialized pea protein dairy alternative products.
  • Supply chain optimization reduces production costs and improves product availability across diverse geographic regions.

Outlook on Demand Analysis for Pea Protein in Dairy Alternatives in Germany

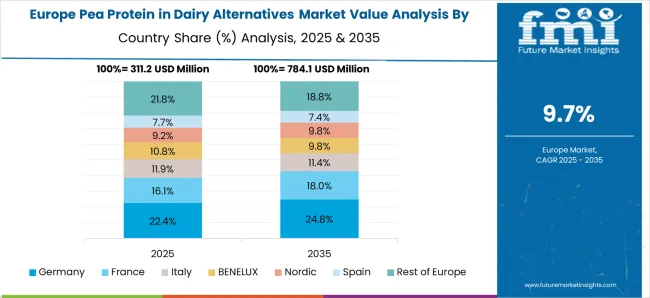
Pea Protein In Dairy Alternatives Market Europe Country Market Share Analysis, 2025 & 2035

Germany projects 10.8% growth supported by European Union sustainability policies and strong consumer preference for clean-label ingredients. The country's advanced food processing infrastructure enables sophisticated pea protein formulations that meet stringent quality and nutritional standards. Retail chains actively promote plant-based alternatives through dedicated shelf space and private label development that increases category visibility and accessibility. Consumer education campaigns highlight environmental benefits of pea protein production compared to traditional dairy farming methods.

  • Organic certification requirements drive premium pea protein sourcing and processing methodology investments.
  • Cross-border distribution agreements facilitate product availability across European Union member countries.

Demand Analysis for Pea Protein in Dairy Alternatives in UK

United Kingdom anticipates 10.4% growth driven by supermarket private-label alternative dairy expansion and changing consumer preferences following dietary guideline updates. The country's concentrated retail landscape enables efficient product launches and promotional campaigns that reach broad consumer segments. Health-conscious demographics increasingly adopt flexitarian eating patterns that include regular consumption of plant-based dairy alternatives. Brexit-related supply chain adjustments encourage domestic sourcing and processing of pea protein ingredients.

  • Post-pandemic health consciousness sustains elevated demand for immune-supporting nutritional products.
  • Sustainability marketing resonates strongly with environmentally aware consumer segments across age demographics.

Demand Analysis for Pea Protein in Dairy Alternatives in Brazil

Brazil expects 9.8% growth facilitated by dairy import substitution strategies and expanding health-focused consumer segments. The country's agricultural infrastructure supports domestic pea cultivation that reduces ingredient costs and supply chain dependencies. Urban populations increasingly adopt international dietary trends including plant-based alternatives while maintaining preferences for familiar flavors and textures. Local manufacturers develop region-specific formulations that cater to traditional taste preferences while delivering nutritional benefits associated with pea protein.
  • Economic policies encouraging agricultural diversification support pea protein supply chain development.
  • Health awareness campaigns promote plant-based nutrition among diabetes and cardiovascular disease prevention initiatives.

Demand Analysis for Pea Protein in Dairy Alternatives in Japan

Pea Protein In Dairy Alternatives Market Japan Market Share Analysis By Dairy Alternative Product

Japan projects 9.2% growth through functional dairy alternatives in convenience retail and continued innovation in specialized nutritional products. The country's aging population seeks easily digestible protein sources that support healthy aging and muscle maintenance. Convenience store distribution channels enable widespread access to single-serve pea protein dairy alternatives that appeal to busy urban lifestyles. Technology-forward food processing capabilities support development of novel textures and flavor profiles that satisfy demanding Japanese consumer preferences.
  • Aging population demographics drive demand for digestible and bioavailable protein supplementation products.
  • Convenience retail innovation creates new consumption occasions for portable pea protein dairy alternatives.

Competitive Landscape of Pea Protein Dairy Alternatives Space

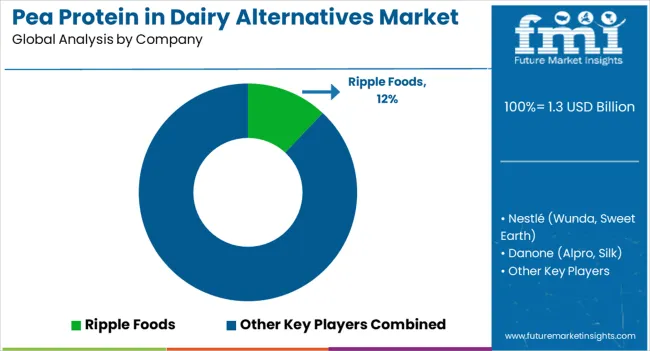
Pea Protein In Dairy Alternatives Market Analysis By Company

The competitive landscape features established food conglomerates alongside specialized plant-based companies and ingredient suppliers. Distribution reach and formulation expertise rather than brand recognition alone determine success factors, with leading suppliers achieving global retail placement and consistent product quality.

Ripple Foods maintains the largest single-brand presence with 12% share in 2025, focusing exclusively on pea protein-based plant milk products. The company's direct-to-consumer strategy and retail partnerships with major grocery chains establish strong consumer loyalty through consistent taste profiles and nutritional positioning. Ripple's manufacturing partnerships enable national distribution while maintaining quality control and sustainable sourcing practices.

Nestlé leverages its global infrastructure through Wunda and Sweet Earth brands, integrating pea protein into broader plant-based product portfolios. The company's research and development capabilities support continuous formulation improvements that address taste, texture, and nutritional optimization across diverse product categories. Distribution through existing retail relationships provides immediate access to international grocers and foodservice operators.

Danone utilizes Alpro and Silk brands to capture European and North American consumption through established dairy alternative product lines. The company's manufacturing scale enables cost-effective pea protein incorporation while maintaining premium positioning and organic certification where applicable. Strategic acquisitions and partnerships expand formulation capabilities and geographic reach across developed economies.

Oatly develops pea protein blend formulations in research and development initiatives that combine oat and pea proteins for enhanced nutritional profiles and texture characteristics. The company's innovation focus addresses specific consumer demands for multi-functional plant proteins that deliver complete amino acid profiles and improved sensory experiences.

Ingredient suppliers including Roquette Frères, Ingredion, ADM, and Cargill provide specialized pea protein processing and supply chain management that supports brand manufacturers across geographic regions. These companies invest in processing technology improvements and sustainable sourcing practices that reduce costs and environmental impact while ensuring consistent quality specifications.

Key Companies Profiled in the Global Pea Protein Demand in Dairy Alternatives Market

  • Ripple Foods
  • Nestlé (Wunda, Sweet Earth)
  • Danone (Alpro, Silk)
  • Oatly (pea-protein blends in R&D)
  • Roquette Frères
  • Ingredion
  • ADM
  • Cargill
  • Beyond Better Foods
  • SunOpta

Scope of the Report

Item Value
Quantitative Units USD 1.3 billion
Dairy Alternative Product Plant-based milk, yogurt alternatives, cheese alternatives, and ice cream & desserts
Pea Protein Type Isolates, concentrates, and hydrolyzed/functional proteins
Distribution channel Retail (supermarkets & hypermarkets), foodservice, and online/direct to consumer
Regions Covered North America, Latin America, Europe, Asia-Pacific, Middle East & Africa
Countries Covered India, China, Brazil, USA, Germany, UK, Japan and 40+ Countries
Key Companies Profiled Ripple Foods, Nestlé (Wunda, Sweet Earth); Danone (Alpro, Silk); Oatly (pea-protein blends in R&D); Roquette Frères; Ingredion; ADM; Cargill; Beyond Better Foods; SunOpta.
Additional Attributes Dollar sales by CAGR (2025-2035), Share by segment, Country growth rates, Usage patterns by dairy alternative product, distribution channel, and pea protein type, Competitive landscape, Regulatory environment

Global Pea Protein Demand in Dairy Alternatives Market by Segments

By Dairy Alternative Product:

  • Plant-based Milk
  • Yogurt Alternatives
  • Cheese Alternatives
  • Ice Cream & Desserts

Pea Protein Type:

  • Isolates
  • Concentrates
  • Hydrolyzed/Functional Proteins

Distribution Channel:

  • Retail
    • Supermarkets & Hypermarkets
  • Foodservice
  • Online/Direct to Consumer

Region:

  • North America
    • United States
    • Canada
    • Mexico
  • Europe
    • Germany
    • United Kingdom
    • France
    • Italy
    • Spain
    • Nordic
    • BENELUX
    • Rest of Europe
  • East Asia
    • China
    • Japan
    • South Korea
  • South Asia & Pacific
    • India
    • ASEAN
    • Australia & New Zealand
    • Rest of South Asia & Pacific
  • Latin America
    • Brazil
    • Chile
    • Rest of Latin America
  • Middle East & Africa
    • Kingdom of Saudi Arabia
    • Other GCC Countries
    • Turkiye
    • South Africa
    • Other African Union
    • Rest of Middle East & Africa

Table of Content

  1. Executive Summary
    • Global Market Outlook
    • Demand-side Trends
    • Supply-side Trends
    • Technology Roadmap Analysis
    • Analysis and Recommendations
  2. Market Overview
    • Market Coverage / Taxonomy
    • Market Definition / Scope / Limitations
  3. Market Background
    • Market Dynamics
      • Drivers
      • Restraints
      • Opportunity
      • Trends
    • Scenario Forecast
      • Demand in Optimistic Scenario
      • Demand in Likely Scenario
      • Demand in Conservative Scenario
    • Opportunity Map Analysis
    • Product Life Cycle Analysis
    • Supply Chain Analysis
    • Investment Feasibility Matrix
    • Value Chain Analysis
    • PESTLE and Porter’s Analysis
    • Regulatory Landscape
    • Regional Parent Market Outlook
    • Production and Consumption Statistics
    • Import and Export Statistics
  4. Global Market Analysis 2020 to 2024 and Forecast, 2025 to 2035
    • Historical Market Size Value (USD Million) Analysis, 2020 to 2024
    • Current and Future Market Size Value (USD Million) Projections, 2025 to 2035
      • Y-o-Y Growth Trend Analysis
      • Absolute $ Opportunity Analysis
  5. Global Market Pricing Analysis 2020 to 2024 and Forecast 2025 to 2035
  6. Global Market Analysis 2020 to 2024 and Forecast 2025 to 2035, By Dairy Alternative Product
    • Introduction / Key Findings
    • Historical Market Size Value (USD Million) Analysis By Dairy Alternative Product, 2020 to 2024
    • Current and Future Market Size Value (USD Million) Analysis and Forecast By Dairy Alternative Product, 2025 to 2035
      • Plant-based milk
      • Yogurt alternatives
      • Cheese alternatives
      • Ice cream & desserts
    • Y-o-Y Growth Trend Analysis By Dairy Alternative Product, 2020 to 2024
    • Absolute $ Opportunity Analysis By Dairy Alternative Product, 2025 to 2035
  7. Global Market Analysis 2020 to 2024 and Forecast 2025 to 2035, By Pea Protein Type
    • Introduction / Key Findings
    • Historical Market Size Value (USD Million) Analysis By Pea Protein Type, 2020 to 2024
    • Current and Future Market Size Value (USD Million) Analysis and Forecast By Pea Protein Type, 2025 to 2035
      • Isolates
      • Concentrates
      • Hydrolyzed/functional proteins
    • Y-o-Y Growth Trend Analysis By Pea Protein Type, 2020 to 2024
    • Absolute $ Opportunity Analysis By Pea Protein Type, 2025 to 2035
  8. Global Market Analysis 2020 to 2024 and Forecast 2025 to 2035, By Distribution Channel
    • Introduction / Key Findings
    • Historical Market Size Value (USD Million) Analysis By Distribution Channel, 2020 to 2024
    • Current and Future Market Size Value (USD Million) Analysis and Forecast By Distribution Channel, 2025 to 2035
      • Retail (supermarkets & hypermarkets)
      • Online/direct-to-consumer
      • Foodservice
    • Y-o-Y Growth Trend Analysis By Distribution Channel, 2020 to 2024
    • Absolute $ Opportunity Analysis By Distribution Channel, 2025 to 2035
  9. Global Market Analysis 2020 to 2024 and Forecast 2025 to 2035, By Region
    • Introduction
    • Historical Market Size Value (USD Million) Analysis By Region, 2020 to 2024
    • Current Market Size Value (USD Million) Analysis and Forecast By Region, 2025 to 2035
      • North America
      • Latin America
      • Western Europe
      • Eastern Europe
      • East Asia
      • South Asia and Pacific
      • Middle East & Africa
    • Market Attractiveness Analysis By Region
  10. North America Market Analysis 2020 to 2024 and Forecast 2025 to 2035, By Country
    • Historical Market Size Value (USD Million) Trend Analysis By Market Taxonomy, 2020 to 2024
    • Market Size Value (USD Million) Forecast By Market Taxonomy, 2025 to 2035
      • By Country
        • USA
        • Canada
        • Mexico
      • By Dairy Alternative Product
      • By Pea Protein Type
      • By Distribution Channel
    • Market Attractiveness Analysis
      • By Country
      • By Dairy Alternative Product
      • By Pea Protein Type
      • By Distribution Channel
    • Key Takeaways
  11. Latin America Market Analysis 2020 to 2024 and Forecast 2025 to 2035, By Country
    • Historical Market Size Value (USD Million) Trend Analysis By Market Taxonomy, 2020 to 2024
    • Market Size Value (USD Million) Forecast By Market Taxonomy, 2025 to 2035
      • By Country
        • Brazil
        • Chile
        • Rest of Latin America
      • By Dairy Alternative Product
      • By Pea Protein Type
      • By Distribution Channel
    • Market Attractiveness Analysis
      • By Country
      • By Dairy Alternative Product
      • By Pea Protein Type
      • By Distribution Channel
    • Key Takeaways
  12. Western Europe Market Analysis 2020 to 2024 and Forecast 2025 to 2035, By Country
    • Historical Market Size Value (USD Million) Trend Analysis By Market Taxonomy, 2020 to 2024
    • Market Size Value (USD Million) Forecast By Market Taxonomy, 2025 to 2035
      • By Country
        • Germany
        • UK
        • Italy
        • Spain
        • France
        • Nordic
        • BENELUX
        • Rest of Western Europe
      • By Dairy Alternative Product
      • By Pea Protein Type
      • By Distribution Channel
    • Market Attractiveness Analysis
      • By Country
      • By Dairy Alternative Product
      • By Pea Protein Type
      • By Distribution Channel
    • Key Takeaways
  13. Eastern Europe Market Analysis 2020 to 2024 and Forecast 2025 to 2035, By Country
    • Historical Market Size Value (USD Million) Trend Analysis By Market Taxonomy, 2020 to 2024
    • Market Size Value (USD Million) Forecast By Market Taxonomy, 2025 to 2035
      • By Country
        • Russia
        • Poland
        • Hungary
        • Balkan & Baltic
        • Rest of Eastern Europe
      • By Dairy Alternative Product
      • By Pea Protein Type
      • By Distribution Channel
    • Market Attractiveness Analysis
      • By Country
      • By Dairy Alternative Product
      • By Pea Protein Type
      • By Distribution Channel
    • Key Takeaways
  14. East Asia Market Analysis 2020 to 2024 and Forecast 2025 to 2035, By Country
    • Historical Market Size Value (USD Million) Trend Analysis By Market Taxonomy, 2020 to 2024
    • Market Size Value (USD Million) Forecast By Market Taxonomy, 2025 to 2035
      • By Country
        • China
        • Japan
        • South Korea
      • By Dairy Alternative Product
      • By Pea Protein Type
      • By Distribution Channel
    • Market Attractiveness Analysis
      • By Country
      • By Dairy Alternative Product
      • By Pea Protein Type
      • By Distribution Channel
    • Key Takeaways
  15. South Asia and Pacific Market Analysis 2020 to 2024 and Forecast 2025 to 2035, By Country
    • Historical Market Size Value (USD Million) Trend Analysis By Market Taxonomy, 2020 to 2024
    • Market Size Value (USD Million) Forecast By Market Taxonomy, 2025 to 2035
      • By Country
        • India
        • ASEAN
        • Australia & New Zealand
        • Rest of South Asia and Pacific
      • By Dairy Alternative Product
      • By Pea Protein Type
      • By Distribution Channel
    • Market Attractiveness Analysis
      • By Country
      • By Dairy Alternative Product
      • By Pea Protein Type
      • By Distribution Channel
    • Key Takeaways
  16. Middle East & Africa Market Analysis 2020 to 2024 and Forecast 2025 to 2035, By Country
    • Historical Market Size Value (USD Million) Trend Analysis By Market Taxonomy, 2020 to 2024
    • Market Size Value (USD Million) Forecast By Market Taxonomy, 2025 to 2035
      • By Country
        • Kingdom of Saudi Arabia
        • Other GCC Countries
        • Turkiye
        • South Africa
        • Other African Union
        • Rest of Middle East & Africa
      • By Dairy Alternative Product
      • By Pea Protein Type
      • By Distribution Channel
    • Market Attractiveness Analysis
      • By Country
      • By Dairy Alternative Product
      • By Pea Protein Type
      • By Distribution Channel
    • Key Takeaways
  17. Key Countries Market Analysis
    • USA
      • Pricing Analysis
      • Market Share Analysis, 2024
        • By Dairy Alternative Product
        • By Pea Protein Type
        • By Distribution Channel
    • Canada
      • Pricing Analysis
      • Market Share Analysis, 2024
        • By Dairy Alternative Product
        • By Pea Protein Type
        • By Distribution Channel
    • Mexico
      • Pricing Analysis
      • Market Share Analysis, 2024
        • By Dairy Alternative Product
        • By Pea Protein Type
        • By Distribution Channel
    • Brazil
      • Pricing Analysis
      • Market Share Analysis, 2024
        • By Dairy Alternative Product
        • By Pea Protein Type
        • By Distribution Channel
    • Chile
      • Pricing Analysis
      • Market Share Analysis, 2024
        • By Dairy Alternative Product
        • By Pea Protein Type
        • By Distribution Channel
    • Germany
      • Pricing Analysis
      • Market Share Analysis, 2024
        • By Dairy Alternative Product
        • By Pea Protein Type
        • By Distribution Channel
    • UK
      • Pricing Analysis
      • Market Share Analysis, 2024
        • By Dairy Alternative Product
        • By Pea Protein Type
        • By Distribution Channel
    • Italy
      • Pricing Analysis
      • Market Share Analysis, 2024
        • By Dairy Alternative Product
        • By Pea Protein Type
        • By Distribution Channel
    • Spain
      • Pricing Analysis
      • Market Share Analysis, 2024
        • By Dairy Alternative Product
        • By Pea Protein Type
        • By Distribution Channel
    • France
      • Pricing Analysis
      • Market Share Analysis, 2024
        • By Dairy Alternative Product
        • By Pea Protein Type
        • By Distribution Channel
    • India
      • Pricing Analysis
      • Market Share Analysis, 2024
        • By Dairy Alternative Product
        • By Pea Protein Type
        • By Distribution Channel
    • ASEAN
      • Pricing Analysis
      • Market Share Analysis, 2024
        • By Dairy Alternative Product
        • By Pea Protein Type
        • By Distribution Channel
    • Australia & New Zealand
      • Pricing Analysis
      • Market Share Analysis, 2024
        • By Dairy Alternative Product
        • By Pea Protein Type
        • By Distribution Channel
    • China
      • Pricing Analysis
      • Market Share Analysis, 2024
        • By Dairy Alternative Product
        • By Pea Protein Type
        • By Distribution Channel
    • Japan
      • Pricing Analysis
      • Market Share Analysis, 2024
        • By Dairy Alternative Product
        • By Pea Protein Type
        • By Distribution Channel
    • South Korea
      • Pricing Analysis
      • Market Share Analysis, 2024
        • By Dairy Alternative Product
        • By Pea Protein Type
        • By Distribution Channel
    • Russia
      • Pricing Analysis
      • Market Share Analysis, 2024
        • By Dairy Alternative Product
        • By Pea Protein Type
        • By Distribution Channel
    • Poland
      • Pricing Analysis
      • Market Share Analysis, 2024
        • By Dairy Alternative Product
        • By Pea Protein Type
        • By Distribution Channel
    • Hungary
      • Pricing Analysis
      • Market Share Analysis, 2024
        • By Dairy Alternative Product
        • By Pea Protein Type
        • By Distribution Channel
    • Kingdom of Saudi Arabia
      • Pricing Analysis
      • Market Share Analysis, 2024
        • By Dairy Alternative Product
        • By Pea Protein Type
        • By Distribution Channel
    • Turkiye
      • Pricing Analysis
      • Market Share Analysis, 2024
        • By Dairy Alternative Product
        • By Pea Protein Type
        • By Distribution Channel
    • South Africa
      • Pricing Analysis
      • Market Share Analysis, 2024
        • By Dairy Alternative Product
        • By Pea Protein Type
        • By Distribution Channel
  18. Market Structure Analysis
    • Competition Dashboard
    • Competition Benchmarking
    • Market Share Analysis of Top Players
      • By Regional
      • By Dairy Alternative Product
      • By Pea Protein Type
      • By Distribution Channel
  19. Competition Analysis
    • Competition Deep Dive
      • Ripple Foods
        • Overview
        • Product Portfolio
        • Profitability by Market Segments (Product/Age /Sales Channel/Region)
        • Sales Footprint
        • Strategy Overview
          • Marketing Strategy
          • Product Strategy
          • Channel Strategy
      • Nestlé (Wunda, Sweet Earth)
      • Danone (Alpro, Silk)
      • Oatly (pea-protein blends in R&D)
      • Roquette Frères
      • Ingredion
      • ADM
      • Cargill
      • Beyond Better Foods
      • SunOpta
  20. Assumptions & Acronyms Used
  21. Research Methodology

List of Tables

  • Table 1: Global Market Value (USD Million) Forecast by Region, 2020 to 2035
  • Table 2: Global Market Value (USD Million) Forecast by Dairy Alternative Product, 2020 to 2035
  • Table 3: Global Market Value (USD Million) Forecast by Pea Protein Type, 2020 to 2035
  • Table 4: Global Market Value (USD Million) Forecast by Distribution Channel, 2020 to 2035
  • Table 5: Global Market Value (USD Million) Forecast by, 2020 to 2035
  • Table 6: Global Market Value (USD Million) Forecast by, 2020 to 2035
  • Table 7: Global Market Value (USD Million) Forecast by, 2020 to 2035
  • Table 8: North America Market Value (USD Million) Forecast by Country, 2020 to 2035
  • Table 9: North America Market Value (USD Million) Forecast by Dairy Alternative Product, 2020 to 2035
  • Table 10: North America Market Value (USD Million) Forecast by Pea Protein Type, 2020 to 2035
  • Table 11: North America Market Value (USD Million) Forecast by Distribution Channel, 2020 to 2035
  • Table 12: North America Market Value (USD Million) Forecast by, 2020 to 2035
  • Table 13: North America Market Value (USD Million) Forecast by, 2020 to 2035
  • Table 14: North America Market Value (USD Million) Forecast by, 2020 to 2035
  • Table 15: Latin America Market Value (USD Million) Forecast by Country, 2020 to 2035
  • Table 16: Latin America Market Value (USD Million) Forecast by Dairy Alternative Product, 2020 to 2035
  • Table 17: Latin America Market Value (USD Million) Forecast by Pea Protein Type, 2020 to 2035
  • Table 18: Latin America Market Value (USD Million) Forecast by Distribution Channel, 2020 to 2035
  • Table 19: Latin America Market Value (USD Million) Forecast by, 2020 to 2035
  • Table 20: Latin America Market Value (USD Million) Forecast by, 2020 to 2035
  • Table 21: Latin America Market Value (USD Million) Forecast by, 2020 to 2035
  • Table 22: Western Europe Market Value (USD Million) Forecast by Country, 2020 to 2035
  • Table 23: Western Europe Market Value (USD Million) Forecast by Dairy Alternative Product, 2020 to 2035
  • Table 24: Western Europe Market Value (USD Million) Forecast by Pea Protein Type, 2020 to 2035
  • Table 25: Western Europe Market Value (USD Million) Forecast by Distribution Channel, 2020 to 2035
  • Table 26: Western Europe Market Value (USD Million) Forecast by, 2020 to 2035
  • Table 27: Western Europe Market Value (USD Million) Forecast by, 2020 to 2035
  • Table 28: Western Europe Market Value (USD Million) Forecast by, 2020 to 2035
  • Table 29: Eastern Europe Market Value (USD Million) Forecast by Country, 2020 to 2035
  • Table 30: Eastern Europe Market Value (USD Million) Forecast by Dairy Alternative Product, 2020 to 2035
  • Table 31: Eastern Europe Market Value (USD Million) Forecast by Pea Protein Type, 2020 to 2035
  • Table 32: Eastern Europe Market Value (USD Million) Forecast by Distribution Channel, 2020 to 2035
  • Table 33: Eastern Europe Market Value (USD Million) Forecast by, 2020 to 2035
  • Table 34: Eastern Europe Market Value (USD Million) Forecast by, 2020 to 2035
  • Table 35: Eastern Europe Market Value (USD Million) Forecast by, 2020 to 2035
  • Table 36: East Asia Market Value (USD Million) Forecast by Country, 2020 to 2035
  • Table 37: East Asia Market Value (USD Million) Forecast by Dairy Alternative Product, 2020 to 2035
  • Table 38: East Asia Market Value (USD Million) Forecast by Pea Protein Type, 2020 to 2035
  • Table 39: East Asia Market Value (USD Million) Forecast by Distribution Channel, 2020 to 2035
  • Table 40: East Asia Market Value (USD Million) Forecast by, 2020 to 2035
  • Table 41: East Asia Market Value (USD Million) Forecast by, 2020 to 2035
  • Table 42: East Asia Market Value (USD Million) Forecast by, 2020 to 2035
  • Table 43: South Asia and Pacific Market Value (USD Million) Forecast by Country, 2020 to 2035
  • Table 44: South Asia and Pacific Market Value (USD Million) Forecast by Dairy Alternative Product, 2020 to 2035
  • Table 45: South Asia and Pacific Market Value (USD Million) Forecast by Pea Protein Type, 2020 to 2035
  • Table 46: South Asia and Pacific Market Value (USD Million) Forecast by Distribution Channel, 2020 to 2035
  • Table 47: South Asia and Pacific Market Value (USD Million) Forecast by, 2020 to 2035
  • Table 48: South Asia and Pacific Market Value (USD Million) Forecast by, 2020 to 2035
  • Table 49: South Asia and Pacific Market Value (USD Million) Forecast by, 2020 to 2035
  • Table 50: Middle East & Africa Market Value (USD Million) Forecast by Country, 2020 to 2035
  • Table 51: Middle East & Africa Market Value (USD Million) Forecast by Dairy Alternative Product, 2020 to 2035
  • Table 52: Middle East & Africa Market Value (USD Million) Forecast by Pea Protein Type, 2020 to 2035
  • Table 53: Middle East & Africa Market Value (USD Million) Forecast by Distribution Channel, 2020 to 2035
  • Table 54: Middle East & Africa Market Value (USD Million) Forecast by, 2020 to 2035
  • Table 55: Middle East & Africa Market Value (USD Million) Forecast by, 2020 to 2035
  • Table 56: Middle East & Africa Market Value (USD Million) Forecast by, 2020 to 2035

List of Figures

  • Figure 1: Global Market Pricing Analysis
  • Figure 2: Global Market Value (USD Million) Forecast 2020-2035
  • Figure 3: Global Market Value (USD Million) Share and BPS Analysis by Region, 2025 and 2035
  • Figure 4: Global Market Y-o-Y Growth Comparison by Region, 2025-2035
  • Figure 5: Global Market Attractiveness Analysis by Region
  • Figure 6: North America Market Incremental Dollar Opportunity, 2025-2035
  • Figure 7: Latin America Market Incremental Dollar Opportunity, 2025-2035
  • Figure 8: Western Europe Market Incremental Dollar Opportunity, 2025-2035
  • Figure 9: Eastern Europe Market Incremental Dollar Opportunity, 2025-2035
  • Figure 10: East Asia Market Incremental Dollar Opportunity, 2025-2035
  • Figure 11: South Asia and Pacific Market Incremental Dollar Opportunity, 2025-2035
  • Figure 12: Middle East & Africa Market Incremental Dollar Opportunity, 2025-2035
  • Figure 13: North America Market Value Share and BPS Analysis by Country, 2025 and 2035
  • Figure 14: Latin America Market Value Share and BPS Analysis by Country, 2025 and 2035
  • Figure 15: Western Europe Market Value Share and BPS Analysis by Country, 2025 and 2035
  • Figure 16: Eastern Europe Market Value Share and BPS Analysis by Country, 2025 and 2035
  • Figure 17: East Asia Market Value Share and BPS Analysis by Country, 2025 and 2035
  • Figure 18: South Asia and Pacific Market Value Share and BPS Analysis by Country, 2025 and 2035
  • Figure 19: Middle East & Africa Market Value Share and BPS Analysis by Country, 2025 and 2035
  • Figure 20: Global Market - Tier Structure Analysis
  • Figure 21: Global Market - Company Share Analysis

Frequently Asked Questions

How big is the demand for pea protein in dairy alternatives in 2025?

The global demand for pea protein in dairy alternatives is estimated to be valued at USD 1.3 billion in 2025.

What will be the size of demand for pea protein in dairy alternatives in 2035?

The market size for the demand for pea protein in dairy alternatives is projected to reach USD 3.9 billion by 2035.

How much will be the demand for pea protein in dairy alternatives growth between 2025 and 2035?

The demand for pea protein in dairy alternatives is expected to grow at a 11.5% CAGR between 2025 and 2035.

What are the key product types in the demand for pea protein in dairy alternatives?

The key product types in demand for pea protein in dairy alternatives are plant-based milk, yogurt alternatives, cheese alternatives and ice cream & desserts.

Which pea protein type segment to contribute significant share in the demand for pea protein in dairy alternatives in 2025?

In terms of pea protein type, isolates segment to command 54.0% share in the demand for pea protein in dairy alternatives in 2025.

Explore Similar Insights

Future Market Insights

Demand for Pea Protein in Dairy Alternatives

Chat With

MaRIA

Hi There, I am MaRIA, Your Market Research Intelligence Assistant. How may I help you?