Insect-Derived Proteins in Skincare Market Size and Share Forecast Outlook 2025 to 2035

The Insect-Derived Proteins in Skincare Market is expected to record a valuation of USD 750.9 million in 2025 and USD 3,203.2 million in 2035, with an increase of USD 2,452.3 million, which equals a growth of more than 193% over the decade. The overall expansion represents a CAGR of 15.6% and a 4X increase in market size.
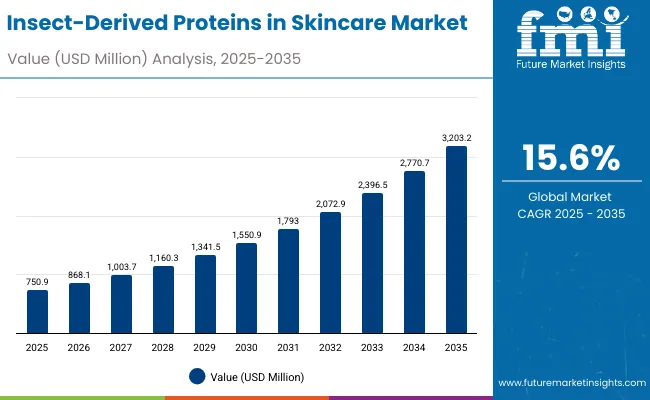
Quick Stats for Insect-Derived Proteins in Skincare Market

  • Insect-Derived Proteins in Skincare Market Value (2025): USD 750.9 million
  • Insect-Derived Proteins in Skincare Market Forecast Value (2035): USD 3,203.2 million
  • Insect-Derived Proteins in Skincare Market Forecast CAGR: 15.6%
  • Leading Segment in 2025: Serums (46.6%)
  • Key Growth Regions: China, India, Japan, United States, Germany, United Kingdom
  • Top Key Players: Entoprotech, Chrysalin, Kaiser Worm Skincare, Geltor, DSM-Firmenich, Croda, Ashland, BASF, Symrise, Seppic

Insect Derived Proteins In Skincare Market

Insect-Derived Proteins in Skincare Market Key Takeaways

Metric Value
Insect-Derived Proteins in Skincare Market Estimated Value in (2025E) USD 750.9 million
Insect-Derived Proteins in Skincare Market Forecast Value in (2035F) USD 3,203.2 million
Forecast CAGR (2025 to 2035) 15.6%

During the first five-year period from 2025 to 2030, the market increases from USD 750.9 million to USD 1,550.9 million, adding USD 800 million, which accounts for around 32% of the total decade growth. This phase records steady adoption in premium skincare segments, including dermatology-driven anti-aging serums and creams, supported by the need for naturally derived actives. Serums dominate this period as they cater to nearly 46.6% of applications requiring high bioactivity concentration for wrinkle reduction and repair. Sustainable sourcing claims rise rapidly, taking more than 52% of consumer preference in 2025, positioning insect-based proteins as a novel eco-friendly solution compared to traditional collagen or keratin.

The second half from 2030 to 2035 contributes USD 1,652.3 million, equal to nearly 68% of total growth, as the market jumps from USD 1,550.9 million to USD 3,203.2 million. This acceleration is powered by widespread deployment of biotech-driven synthetic replicas of insect proteins, vegan alternatives aligned with ethical standards, and strong traction in Asian and European beauty markets. Hydration and barrier strengthening products gain share alongside regeneration, with fly larva extracts and beetle-derived peptides entering mainstream formulations. Distribution expands aggressively via e-commerce and specialty beauty retail, while premium dermatology clinics drive high-value ampoule and mask sales. The rising adoption of eco-friendly biotech and fermentation-based protein replication adds recurring revenue streams, strengthening the sustainability positioning of the industry.

From 2020 to 2024, the Insect-Derived Proteins in Skincare Market grew steadily as biotech innovators tested insect protein extraction and peptide stabilization methods. During this period, the competitive landscape was dominated by traditional chemical and bio-based ingredient suppliers, while insect-based solutions represented less than 5% of the active skincare protein market. The emphasis was on research pilots and eco-positioning, with early movers like Geltor leading in synthetic biology innovations. Market entry was limited but laid the foundation for sustainability claims and natural-origin marketing, particularly in niche anti-aging and hydration serums.

Demand for insect-derived actives expands significantly to USD 750.9 million in 2025, and the revenue mix begins to shift as biotech-based fermentation and scalable protein synthesis models emerge. Traditional ingredient leaders such as DSM-Firmenich, BASF, and Croda face rising competition from insect-specialized startups like Entoprotech and Kaiser Worm Skincare, as well as digital-first biotech players offering sustainable replicas. Major ingredient suppliers are pivoting to hybrid models, integrating insect-based peptides with existing collagen and elastin portfolios to retain market share. Emerging entrants specializing in eco-friendly biotech, sustainable sourcing, and AR/VR-enabled beauty retail are gaining share, particularly across Asia and Europe. The competitive advantage is moving away from legacy raw material sourcing toward sustainability-driven formulations, transparent supply chains, and consumer-focused brand narratives.

Why the Insect-Derived Proteins in Skincare Market is growing?

Advances in sustainable sourcing and bio-fermentation have transformed insect-derived proteins into scalable, eco-friendly cosmetic actives. Companies are developing extraction methods that preserve peptide bioactivity, enabling more efficient wrinkle repair, hydration, and skin barrier support. Serums and creams containing silkworm-derived proteins are increasingly used for anti-aging and regeneration, while beetle-derived peptides and fly larva extracts are being explored for hydration and barrier repair. The trend toward sustainable sourcing, which holds more than 52% share in 2025, is central to market growth as beauty consumers demand alternatives to animal-derived collagen and keratin.

Expansion of regenerative skincare and dermatology-led products has fueled market adoption. In particular, skin repair & regeneration is the leading functional segment with nearly 50% share, highlighting its dominance in premium anti-aging skincare. Innovations in ampoule delivery, mask formulations, and synthetic vegan replicas of insect proteins are opening new application areas, while consumer perception is shifting positively toward insect-derived solutions framed as eco-biotech. Segment growth is expected to be led by serums in the product category, skin regeneration in function, and sustainable sourcing claims, due to their adaptability, credibility, and alignment with long-term sustainability trends.

Segmental Analysis

The market is segmented by source, function, product type, channel, and claim. Sources include silk proteins from silkworms, beetle-derived peptides, fly larva extracts, and other insect-based bio-actives, highlighting the diversity of proteins driving adoption. Functional segmentation covers anti-aging & wrinkle repair, skin repair & regeneration, hydration, and barrier strengthening, catering to a wide spectrum of skin concerns. Based on product type, categories include serums, creams/lotions, masks, and ampoules, with serums leading in concentration-based formulations. Distribution spans e-commerce, pharmacies, premium dermatology clinics, and specialty beauty retail, underscoring the omnichannel approach in beauty. Claims include sustainable sourcing, natural/organic, eco-friendly biotech, and vegan alternatives (synthetic replicas), which collectively define brand positioning and consumer trust.

Regionally, the scope spans North America, Latin America, Western and Eastern Europe, East Asia, South Asia and Pacific, and the Middle East and Africa. Key growth markets such as China (20.2% CAGR), India (22.7% CAGR), and Japan (16.4% CAGR) highlight Asia’s leadership, while the USA remains a major contributor with nearly 20% global share in 2025. Europe, led by Germany and the UK, provides steady growth, driven by eco-labeling regulations and consumer awareness.
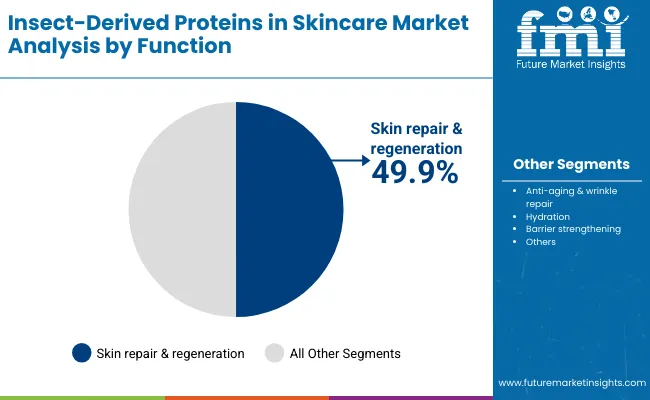
Insights into the Function Segment with Skin Repair & Regeneration Leading in Market Share

Insect Derived Proteins In Skincare Market By Function

Function Value Share% 2025
Skin repair & regeneration 49.9%
Others 50.1%

The skin repair & regeneration segment is projected to contribute nearly 50% of the Insect-Derived Proteins in Skincare Market revenue in 2025, maintaining its lead as the dominant functional category. This dominance stems from the proven efficacy of insect-derived proteins, such as silk proteins and beetle-derived peptides, in stimulating collagen synthesis, repairing micro-tears, and accelerating cell turnover. Consumers are increasingly prioritizing products that deliver visible results for anti-aging and post-treatment recovery, making regenerative claims highly appealing.

Growth in this segment is also fueled by premium skincare launches targeting wrinkle repair, elasticity improvement, and dermal rejuvenation, often positioned as biotech-driven solutions in serums and ampoules. Dermatology clinics and specialty beauty retailers play a pivotal role in expanding access to these formulations. As biotech innovation advances, the introduction of synthetic replicas of insect proteins offers vegan-friendly regeneration options, further broadening consumer acceptance. The skin repair & regeneration segment is expected to remain the backbone of functional demand, anchoring the market’s premium growth trajectory.
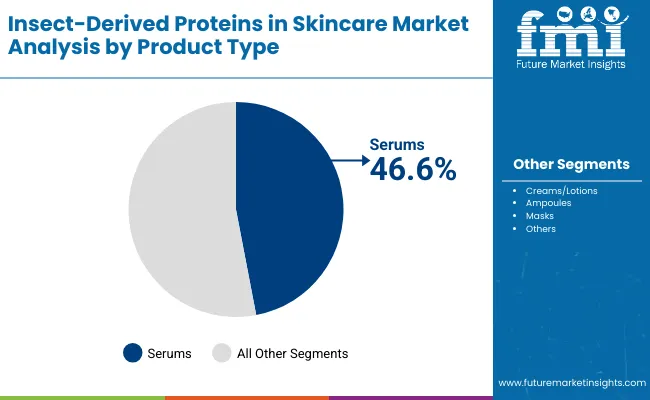
Insights into the Product Type Segment with Serums Dominating the Demand

Insect Derived Proteins In Skincare Market By Product

Product Type Value Share% 2025
Serums 46.6%
Others 53.4%

The serums segment is forecasted to hold 46.6% of the market share in 2025, led by its concentrated delivery format and high consumer trust in efficacy-driven products. Serums are especially effective carriers for insect-derived actives like silkworm fibroin and fly larva extracts, as their lightweight textures allow deep penetration into the dermal layers for wrinkle reduction, hydration, and barrier repair.

This product type has gained traction in both e-commerce and dermatology clinics, where consumers seek targeted treatments rather than generic skincare routines. Serums are also favored in Asia-Pacific markets, particularly China and Japan, where premium skincare adoption is accelerating at double-digit CAGR rates. Growth is further supported by innovations in ampoule-serum hybrids and biodegradable packaging, aligning with sustainability trends. With rising global demand for precision skincare formats, serums are expected to continue dominating the product type segment throughout the forecast period.
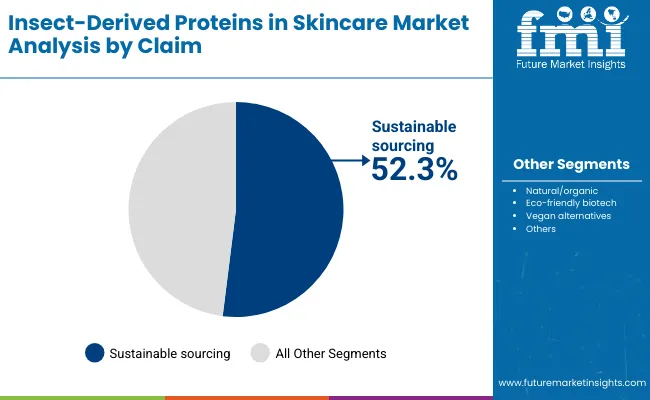
Insights into the Claim Segment with Sustainable Sourcing at the Core

Insect Derived Proteins In Skincare Market By Claim

Claim Value Share% 2025
Sustainable sourcing 52.3%
Others 47.7%

The sustainable sourcing segment is projected to account for more than 52% of the Insect-Derived Proteins in Skincare Market revenue in 2025, establishing it as the leading claim. Sustainability has become a non-negotiable factor in beauty, and insect-derived proteins offer an inherent advantage due to their low ecological footprint, minimal water usage, and reduced carbon emissions compared to livestock-based proteins.

Brands are leveraging this positioning to appeal to eco-conscious consumers, particularly in Europe and North America, where green labeling and traceability are critical. Sustainable sourcing also resonates with millennial and Gen Z consumers, who view insect proteins as futuristic and innovative while aligning with ethical consumption. The claim’s dominance is reinforced by the ability of companies to highlight circularity and waste-to-value narratives, such as extracting proteins from insect farming byproducts.

As global regulatory bodies tighten frameworks around sustainability disclosures, and as major suppliers like Croda, BASF, and Symrise integrate insect-based actives into their bio-based portfolios, sustainable sourcing will remain at the core of product differentiation and consumer trust.

What are the Drivers, Restraints, and Key Trends of the Insect-Derived Proteins in Skincare Market?

Drivers

Rising Preference for Sustainable Protein Alternatives in Skincare

One of the most powerful drivers is the consumer and regulatory push toward low-impact, sustainable actives. Insect-derived proteins require significantly less land, water, and feed compared to traditional protein sources like bovine collagen or marine elastin. This sustainability advantage translates into strong branding opportunities, as claims of eco-friendly sourcing already account for more than 52% of global value in 2025.

In markets like Europe, where regulations increasingly require environmental transparency, insect proteins provide companies with a measurable sustainability story. Premium beauty brands and biotech startups are leveraging this to differentiate themselves and command higher price points. As consumers demand proof-based sustainability, the ability of insect protein suppliers to demonstrate carbon savings and traceable sourcing will further accelerate demand.

Superior Bioactivity for Regeneration and Barrier Repair

Unlike many plant-based alternatives, insect proteins (e.g., silkworm fibroin, beetle-derived peptides, and larva extracts) have demonstrated high efficacy in skin regeneration, collagen stimulation, and barrier strengthening. This has made the function segment of skin repair & regeneration dominant with nearly 50% share in 2025. Clinical studies are beginning to validate these proteins’ roles in accelerating wound healing and improving elasticity, which makes them attractive for dermatology-led product launches and medical-grade cosmeceuticals. The ability to provide visible and science-backed results is a strong competitive driver, especially in premium categories like serums and ampoules, where efficacy dictates consumer loyalty.

Restraints

Consumer Perception and Cultural Resistance

Despite sustainability and efficacy, insect-based proteins still face perceptual and cultural barriers in several markets. In North America and Europe, some consumers associate insect derivatives with “novel foods” or “unfamiliar sources,” creating hesitation around skincare application. Even though formulations are odorless and refined, the idea of applying fly larva extract or beetle peptides to skin may cause initial consumer pushback. Brands must invest heavily in educational campaigns, rebranding insect proteins as biotech actives rather than insect-derived, to mitigate these perceptions. Until then, mainstream adoption will remain slower compared to Asia, where cultural familiarity with insect-derived ingredients is higher.

Limited Industrial-Scale Production and Cost Barriers

The market is constrained by the lack of large-scale production infrastructure for insect proteins. Unlike plant or marine proteins, supply chains for silkworm fibroin or beetle peptides are not fully optimized, leading to higher costs and inconsistent supply volumes. While fermentation and biotech replication (e.g., Geltor’s synthetic replicas) are solving scalability issues, traditional extraction methods remain cost-intensive. This restricts adoption among mid-range skincare brands and limits insect proteins mostly to premium or luxury lines. Unless production scales efficiently and costs decline, the market risks being confined to niche and high-priced segments, slowing broader uptake.

Key Trends

Shift Toward Synthetic Vegan Replicas of Insect Proteins

A major emerging trend is the development of vegan, lab-created replicas of insect proteins through precision fermentation. While insect farming is already more sustainable than livestock, biotech companies like Geltor are advancing protein replication that delivers identical functional benefits without direct insect sourcing. This addresses both consumer hesitation and vegan market demands, creating a dual advantage: sustainability plus ethical acceptance. By 2030, these synthetic alternatives are expected to capture meaningful share, making insect-derived proteins not just about “insects” but about biotech-enabled eco-actives.

Premiumization Through Dermatology Clinics and Ampoule Formats

The second trend is the premiumization of delivery formats, especially ampoules and high-concentration serums distributed through dermatology clinics and specialty retail. These channels are trusted for efficacy and allow brands to price insect-protein products at a premium. For example, fibroin-based serums are already marketed as luxury anti-aging treatments in China and Japan, where CAGR is above 16%. This trend strengthens consumer perception of insect proteins as cutting-edge, science-led innovations rather than experimental niche actives. Over time, ampoule adoption and premium clinical positioning will create halo effects, boosting consumer confidence and mainstreaming insect proteins into lotions and masks as secondary formats.
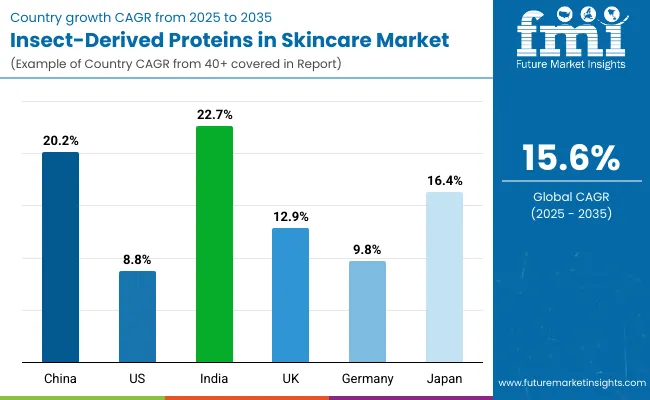
Analysis of Insect-Derived Proteins in Skincare Market By Key Countries

Insect Derived Proteins In Skincare Market By Country

Countries Estimated CAGR (2025 to 2035)
China 20.2%
USA 8.8%
India 22.7%
UK 12.9%
Germany 9.8%
Japan 16.4%

The Insect-Derived Proteins in Skincare Market shows strong regional variance in growth potential, with India (22.7% CAGR) and China (20.2% CAGR) emerging as the fastest-expanding countries. This momentum is driven by rising disposable incomes, a rapidly expanding middle-class consumer base, and increasing awareness of sustainable beauty solutions in Asia. In India, biotech-led beauty startups and international collaborations are accelerating the use of insect protein-based actives, especially in regeneration-focused serums and hydration products.

Similarly, China is positioning itself as a leading innovation hub, with regulatory encouragement for eco-friendly cosmetic actives and strong adoption of premium skincare formats like ampoules and masks. Both countries reflect consumer openness to novel bio-actives and sustainable positioning, creating fertile ground for large-scale adoption.

In contrast, mature markets such as the USA (8.8% CAGR) and Germany (9.8% CAGR) are expanding at steadier rates, reflecting higher market saturation and more cautious consumer acceptance of insect-derived actives. Growth here is fueled primarily by sustainability claims and dermatologist-led premium brands that integrate insect proteins as part of advanced anti-aging formulations. The UK (12.9% CAGR) and Japan (16.4% CAGR) occupy a middle ground.

Japan benefits from a strong cultural acceptance of biotech-based skincare and premiumization trends, while the UK is leveraging rising consumer demand for ethical and eco-friendly products. These country dynamics underline how Asia, led by India, China, and Japan, will account for the strongest momentum, while Europe and the USA provide stable but slower growth, primarily anchored in premium and sustainable skincare niches.
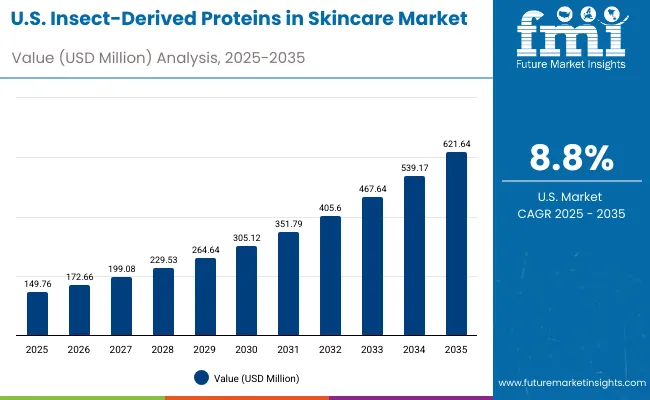
Sales Outlook for Insect-Derived Proteins in Skincare in the United States

Insect Derived Proteins In Skincare Market Usa

Year USA Insect-Derived Proteins in Skincare Market (USD Million)
2025 149.76
2026 172.66
2027 199.08
2028 229.53
2029 264.64
2030 305.12
2031 351.79
2032 405.60
2033 467.64
2034 539.17
2035 621.64

The Insect-Derived Proteins in Skincare Market in the United States is projected to grow at a CAGR of 8.8%, led by increasing consumer interest in sustainable, biotech-based skincare actives. Demand is particularly strong for products with sustainable sourcing claims, which account for over 53% of USA sales in 2025. Dermatology-driven formulations in serums and creams are recording consistent adoption, especially for anti-aging and barrier repair applications. Growth is also supported by premium clinical channels, where insect-derived proteins are being positioned as cutting-edge solutions for wrinkle reduction and skin regeneration. E-commerce and specialty beauty retail are driving visibility, with brands emphasizing traceability and eco-labeling to appeal to eco-conscious and millennial buyers.

  • Sustainable sourcing claims dominate USA sales, contributing over half of the market in 2025.
  • Dermatology clinics are spearheading the use of insect-derived serums for regeneration and anti-aging.
  • E-commerce platforms are key for consumer education, boosting adoption of eco-labeled insect protein skincare.

Growth and Expansion Outlook for Insect-Derived Proteins in Skincare in the United Kingdom

The Insect-Derived Proteins in Skincare Market in the United Kingdom is expected to grow at a CAGR of 12.9%, supported by innovation in sustainable and cruelty-free beauty. British brands are positioning insect proteins as eco-friendly biotech solutions, using narratives around low-carbon supply chains and biodegradable packaging. The UK market is also benefiting from premium skincare launches in serums and ampoules, which are gaining traction in department stores and dermatology-led clinics. Regulatory support for sustainable sourcing and consumer awareness of ethical ingredients are key accelerators. Heritage beauty retailers are introducing insect-protein formulations within clean beauty categories, aligning with rising demand for natural/organic and vegan alternatives.

  • Premium ampoule and serum launches are driving early adoption in the UK.
  • Eco-labeling and cruelty-free positioning resonate strongly with British consumers.
  • Established beauty retailers are integrating insect proteins into clean and ethical skincare categories.

Growth and Expansion Outlook for Insect-Derived Proteins in Skincare in India

India is witnessing the fastest growth in the Insect-Derived Proteins in Skincare Market, forecast to expand at a CAGR of 22.7% through 2035. Rising demand is driven by urban millennials and Gen Z consumers seeking affordable premium skincare with natural and biotech claims. Local beauty startups and Ayurveda-inspired brands are integrating insect proteins into hydration and barrier repair products, often positioned as eco-friendly biotech alternatives to traditional herbal actives. Rapid adoption is also visible in tier-2 and tier-3 cities, where cost-effective launches and e-commerce accessibility are boosting penetration. The education sector and dermatology clinics are reinforcing consumer trust through scientific awareness campaigns, further accelerating adoption.
  • Affordable premium brands in tier-2 cities are fueling rapid adoption.
  • Ayurvedic and biotech brands are merging narratives to integrate insect-based actives.
  • Dermatology clinics and consumer education campaigns are strengthening trust in insect-derived formulations.

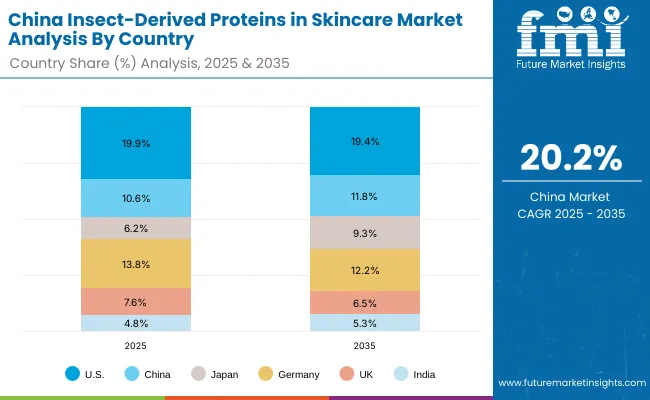
Sales Outlook for Insect-Derived Proteins in Skincare in China

Insect Derived Proteins In Skincare Market China

Countries 2025 Share (%)
USA 19.9%
China 10.6%
Japan 6.2%
Germany 13.8%
UK 7.6%
India 4.8%
Countries 2035 Share (%)
USA 19.4%
China 11.8%
Japan 9.3%
Germany 12.2%
UK 6.5%
India 5.3%

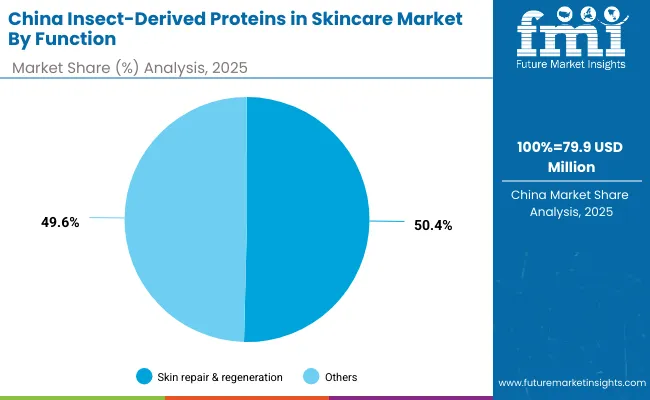
The Insect-Derived Proteins in Skincare Market in China is expected to grow at a CAGR of 20.2%, the second-fastest among leading economies. Growth is led by skin regeneration products, which already account for 50.4% of market value in 2025. Chinese consumers are quick adopters of innovative biotech ingredients, and insect-derived proteins align strongly with the country’s premium skincare boom.

Local biotech firms and multinational beauty brands are accelerating launches in ampoules, serums, and high-concentration creams, marketed heavily through e-commerce and livestreaming platforms. Supportive government initiatives for biotech innovation and consumer enthusiasm for eco-friendly solutions provide additional tailwinds. With rapid growth in urban skincare consumption, insect proteins are expected to become mainstream in China’s premium beauty portfolio by 2030.
  • Skin repair & regeneration dominates Chinese sales, representing over 50% in 2025.
  • E-commerce and livestreaming platforms are critical for rapid adoption and consumer engagement.
  • Local biotech firms and international brands are scaling launches of premium serums and ampoules.

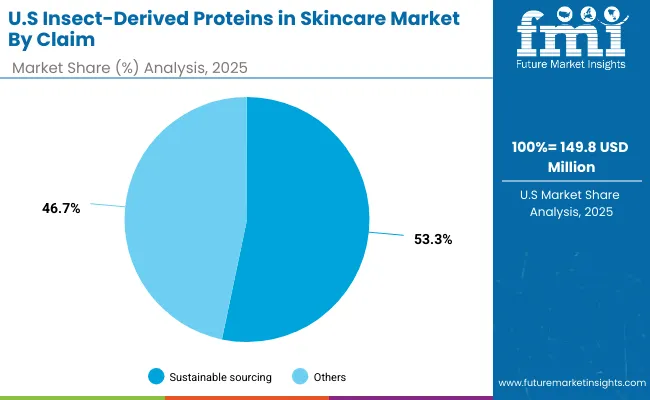
Growth Outlook for Insect-Derived Proteins in Skincare Market in the United States

Insect Derived Proteins In Skincare Market Usa 2

USA by Claim Value Share% 2025
Sustainable sourcing 53.3%
Others 46.7%

The Insect-Derived Proteins in Skincare Market in the United States is projected at USD 149.8 million in 2025. Sustainable sourcing contributes 53.3%, while other claims such as natural/organic and eco-biotech account for 46.7%, which shows a clear value tilt toward environmental positioning and transparency. This dominance stems from strong consumer demand for eco-certified, traceable skincare solutions and from tightening regulations around sustainability labeling. Unlike traditional collagen or marine proteins, insect-derived actives are marketed as low-carbon, water-efficient alternatives, making them highly relevant to USA consumers who prioritize eco-friendly choices.

Growth is also being driven by premium dermatology clinics and e-commerce retailers, where insect proteins are positioned as cutting-edge anti-aging and regeneration actives. Serums and creams dominate sales, while ampoules are emerging as high-value add-ons in clinical settings. American brands are emphasizing science-backed storytelling and digital campaigns to overcome consumer hesitation about insect-based ingredients. As adoption deepens, the USA market is expected to continue shaping global narratives around sustainability and biotech-driven beauty.
  • USA market in 2025 is valued at USD 149.8 million.
  • Sustainable sourcing leads at 53.3% vs 46.7%.
  • Growth supported by eco-labeling, clinical dermatology, and digital-first consumer engagement.

Opportunity Analysis of Insect-Derived Proteins in Skincare Market in China

Insect Derived Proteins In Skincare Market China 2

China by Function Value Share% 2025
Skin repair & regeneration 50.4%
Others 49.6%

The Insect-Derived Proteins in Skincare Market in China is valued at USD 79.9 million in 2025, with skin repair & regeneration leading at 50.4%, followed closely by other functions such as hydration and barrier strengthening at 49.6%. The dominance of regeneration is a direct outcome of China’s premium skincare composition, where anti-aging, elasticity repair, and post-treatment recovery are the fastest-growing categories. Serums and ampoules incorporating silkworm fibroin and larva peptides are widely marketed in urban centers, supported by heavy promotion through e-commerce livestreams and KOL-driven beauty campaigns.

This advantage positions insect proteins as a high-potential active for China’s premium beauty sector, where efficacy and novelty drive consumer adoption. Hydration-focused products are also expanding, especially among younger consumers who prioritize daily skincare routines with natural, eco-friendly positioning. As biotech partnerships between local firms and global ingredient suppliers increase, insect proteins are likely to move from niche launches into mainstream premium portfolios.
  • Market size for China in 2025 is USD 79.9 million.
  • Global share is approximately 10.6% in 2025, rising to 11.8% by 2035.
  • Skin repair & regeneration leads at 50.4% due to strong demand for anti-aging and elasticity treatments.

Competitive Landscape of Insect-Derived Proteins in Skincare Market

Insect Derived Proteins In Skincare Market By Company

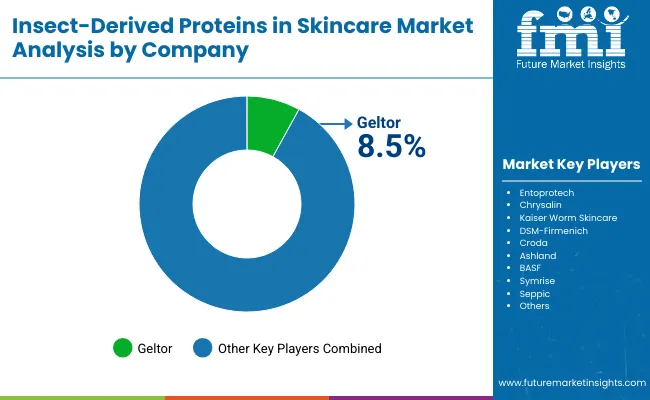
The Insect-Derived Proteins in Skincare Market is moderately fragmented, with biotech innovators, global ingredient suppliers, and niche insect-focused firms competing across diverse application areas. Biotech leaders such as Geltor hold significant share, leveraging synthetic biology platforms to develop vegan replicas of insect proteins, which align with ethical consumer trends while retaining the bioactivity benefits of fibroin and peptides. Their strategy emphasizes precision fermentation, scalability, and licensing partnerships with global cosmetic brands.

Established chemical and life-science giants, including DSM-Firmenich, Croda, BASF, and Symrise, are integrating insect-derived actives into their wider protein and peptide portfolios. Their global reach and regulatory expertise enable them to accelerate market penetration, particularly in Europe and North America. Mid-sized innovators like Entoprotech, Chrysalin, and Kaiser Worm Skincare focus on niche specializations, from silkworm fibroin for elasticity to larva extracts for hydration, creating competitive differentiation through unique sourcing and positioning.

Competitive differentiation is shifting away from ingredient sourcing alone toward a broader ecosystem of sustainability claims, biotech-enabled scalability, and storytelling that appeals to eco-conscious consumers. Companies that can combine scientific validation, transparent supply chains, and consumer trust-building will dominate the next growth phase.

  • Geltor leads with 8.5% share in 2025 through biotech-driven vegan replicas.
  • Global majors (DSM-Firmenich, BASF, Croda, Symrise) are expanding via portfolio integration.
  • Startups (Entoprotech, Chrysalin, Kaiser Worm Skincare) focus on niche insect-derived applications with sustainability narratives.

Key Developments in Insect-Derived Proteins in Skincare Market

  • On February 12, 2024, Geltor announced the launch of its vegan silk protein replica produced through precision fermentation. The development marked the first large-scale rollout of insect-protein alternatives for skincare, expanding into serums and ampoules for premium Asian beauty brands.
  • On May 6, 2024, DSM-Firmenich integrated insect-derived fibroin peptides into its peptide innovation pipeline, positioning them under its sustainable actives portfolio. The move reinforced DSM’s alignment with eco-friendly biotech trends in anti-aging skincare.

Scope of the Report

Item Value
Quantitative Units USD 750.9 Million
Source Silk proteins from silkworms, Beetle-derived peptides, Fly larva extracts, and Other insect-based bio-actives
Function Anti-aging & wrinkle repair, Skin repair & regeneration, Hydration, and Barrier strengthening
Product Type Serums, Creams/lotions, Masks, and Ampoules
Channel E-commerce, Pharmacies, Premium dermatology clinics, and Specialty beauty retail
Claim Sustainable sourcing, Natural/organic, Eco-friendly biotech, and Vegan alternatives (synthetic replicas)
Regions Covered North America, Europe, Asia-Pacific, Latin America, Middle East & Africa
Country Covered United States, Canada, Germany, France, United Kingdom, China, Japan, India, Brazil, South Africa
Key Companies Profiled Entoprotech, Chrysalin, Kaiser Worm Skincare, Geltor, DSM- Firmenich, Croda, Ashland, BASF, Symrise, Seppic
Additional Attributes Dollar sales by product type and claim, adoption trends in skin regeneration and hydration, rising demand for serums and ampoules, sector-specific growth in dermatology clinics and e-commerce, sustainable and eco-labeling driven revenue segmentation, integration with biotech-driven vegan alternatives, regional trends influenced by consumer awareness and regulation, and innovations in fibroin peptides, beetle-derived actives, and bio-fermentation methods.

Key Segments

By Source:

  • Silk proteins from silkworms
  • Beetle-derived peptides
  • Fly larva extracts
  • Other insect-based bio-actives

By Function:

  • Anti-aging & wrinkle repair
  • Skin repair & regeneration
  • Hydration
  • Barrier strengthening

By Product Type:

  • Serums
  • Creams/lotions
  • Masks
  • Ampoules

By Channel:

  • E-commerce
  • Pharmacies
  • Premium dermatology clinics
  • Specialty beauty retail

By Claim:

  • Sustainable sourcing
  • Natural/organic
  • Eco-friendly biotech
  • Vegan alternatives (synthetic replicas)

By Region:

  • North America
  • Latin America
  • Europe
  • East Asia
  • South Asia & Pacific
  • Middle East and Africa

Table of Content

  1. Executive Summary
    • Global Market Outlook
    • Demand-side Trends
    • Supply-side Trends
    • Technology Roadmap Analysis
    • Analysis and Recommendations
  2. Market Overview
    • Market Coverage / Taxonomy
    • Market Definition / Scope / Limitations
  3. Market Background
    • Market Dynamics
      • Drivers
      • Restraints
      • Opportunity
      • Trends
    • Scenario Forecast
      • Demand in Optimistic Scenario
      • Demand in Likely Scenario
      • Demand in Conservative Scenario
    • Opportunity Map Analysis
    • Product Life Cycle Analysis
    • Supply Chain Analysis
    • Investment Feasibility Matrix
    • Value Chain Analysis
    • PESTLE and Porter’s Analysis
    • Regulatory Landscape
    • Regional Parent Market Outlook
    • Production and Consumption Statistics
    • Import and Export Statistics
  4. Global Market Analysis 2020 to 2024 and Forecast, 2025 to 2035
    • Historical Market Size Value (USD Million) & Volume (Tons) Analysis, 2020 to 2024
    • Current and Future Market Size Value (USD Million) & Volume (Tons) Projections, 2025 to 2035
      • Y-o-Y Growth Trend Analysis
      • Absolute $ Opportunity Analysis
  5. Global Market Pricing Analysis 2020 to 2024 and Forecast 2025 to 2035
  6. Global Market Analysis 2020 to 2024 and Forecast 2025 to 2035, By Source
    • Introduction / Key Findings
    • Historical Market Size Value (USD Million) & Volume (Tons) Analysis By Source, 2020 to 2024
    • Current and Future Market Size Value (USD Million) & Volume (Tons) Analysis and Forecast By Source, 2025 to 2035
      • Silk proteins from silkworms
      • Beetle-derived peptides
      • Fly larva extracts
      • Other insect-based bio-actives
    • Y-o-Y Growth Trend Analysis By Source, 2020 to 2024
    • Absolute $ Opportunity Analysis By Source, 2025 to 2035
  7. Global Market Analysis 2020 to 2024 and Forecast 2025 to 2035, By Function
    • Introduction / Key Findings
    • Historical Market Size Value (USD Million) & Volume (Tons) Analysis By Function, 2020 to 2024
    • Current and Future Market Size Value (USD Million) & Volume (Tons) Analysis and Forecast By Function, 2025 to 2035
      • Anti-aging & wrinkle repair
      • Skin repair & regeneration
      • Hydration
      • Barrier strengthening
    • Y-o-Y Growth Trend Analysis By Function, 2020 to 2024
    • Absolute $ Opportunity Analysis By Function, 2025 to 2035
  8. Global Market Analysis 2020 to 2024 and Forecast 2025 to 2035, By Product Type
    • Introduction / Key Findings
    • Historical Market Size Value (USD Million) & Volume (Tons) Analysis By Product Type, 2020 to 2024
    • Current and Future Market Size Value (USD Million) & Volume (Tons) Analysis and Forecast By Product Type, 2025 to 2035
      • Serums
      • Creams/lotions
      • Masks
      • Ampoules
    • Y-o-Y Growth Trend Analysis By Product Type, 2020 to 2024
    • Absolute $ Opportunity Analysis By Product Type, 2025 to 2035
  9. Global Market Analysis 2020 to 2024 and Forecast 2025 to 2035, By Channel
    • Introduction / Key Findings
    • Historical Market Size Value (USD Million) & Volume (Tons) Analysis By Channel, 2020 to 2024
    • Current and Future Market Size Value (USD Million) & Volume (Tons) Analysis and Forecast By Channel, 2025 to 2035
      • E-commerce
      • Pharmacies
      • Premium dermatology clinics
      • Specialty beauty retail
    • Y-o-Y Growth Trend Analysis By Channel, 2020 to 2024
    • Absolute $ Opportunity Analysis By Channel, 2025 to 2035
  10. Global Market Analysis 2020 to 2024 and Forecast 2025 to 2035, By Claim
    • Introduction / Key Findings
    • Historical Market Size Value (USD Million) & Volume (Tons) Analysis By Claim, 2020 to 2024
    • Current and Future Market Size Value (USD Million) & Volume (Tons) Analysis and Forecast By Claim, 2025 to 2035
      • Sustainable sourcing
      • Natural/organic
      • Eco-friendly biotech
      • Vegan alternatives (synthetic replicas)
    • Y-o-Y Growth Trend Analysis By Claim, 2020 to 2024
    • Absolute $ Opportunity Analysis By Claim, 2025 to 2035
  11. Global Market Analysis 2020 to 2024 and Forecast 2025 to 2035, By Region
    • Introduction
    • Historical Market Size Value (USD Million) & Volume (Tons) Analysis By Region, 2020 to 2024
    • Current Market Size Value (USD Million) & Volume (Tons) Analysis and Forecast By Region, 2025 to 2035
      • North America
      • Latin America
      • Europe
      • East Asia
      • South Asia & Pacific
      • Middle East and Africa
    • Market Attractiveness Analysis By Region
  12. North America Market Analysis 2020 to 2024 and Forecast 2025 to 2035, By Country
    • Historical Market Size Value (USD Million) & Volume (Tons) Trend Analysis By Market Taxonomy, 2020 to 2024
    • Market Size Value (USD Million) & Volume (Tons) Forecast By Market Taxonomy, 2025 to 2035
      • By Country
        • USA
        • Canada
      • By Source
      • By Function
      • By Product Type
      • By Channel
      • By Claim
    • Market Attractiveness Analysis
      • By Country
      • By Source
      • By Function
      • By Product Type
      • By Channel
      • By Claim
    • Key Takeaways
  13. Latin America Market Analysis 2020 to 2024 and Forecast 2025 to 2035, By Country
    • Historical Market Size Value (USD Million) & Volume (Tons) Trend Analysis By Market Taxonomy, 2020 to 2024
    • Market Size Value (USD Million) & Volume (Tons) Forecast By Market Taxonomy, 2025 to 2035
      • By Country
        • Brazil
        • Mexico
        • Colombia
        • Rest of Latin America
      • By Source
      • By Function
      • By Product Type
      • By Channel
      • By Claim
    • Market Attractiveness Analysis
      • By Country
      • By Source
      • By Function
      • By Product Type
      • By Channel
      • By Claim
    • Key Takeaways
  14. Europe Market Analysis 2020 to 2024 and Forecast 2025 to 2035, By Country
    • Historical Market Size Value (USD Million) & Volume (Tons) Trend Analysis By Market Taxonomy, 2020 to 2024
    • Market Size Value (USD Million) & Volume (Tons) Forecast By Market Taxonomy, 2025 to 2035
      • By Country
        • Germany
        • UK
        • France
        • Italy
        • Spain
        • Belgium
        • Netherlands
        • Nordic
        • Switzerland
        • Russia
        • Poland
        • Rest of Europe
      • By Source
      • By Function
      • By Product Type
      • By Channel
      • By Claim
    • Market Attractiveness Analysis
      • By Country
      • By Source
      • By Function
      • By Product Type
      • By Channel
      • By Claim
    • Key Takeaways
  15. East Asia Market Analysis 2020 to 2024 and Forecast 2025 to 2035, By Country
    • Historical Market Size Value (USD Million) & Volume (Tons) Trend Analysis By Market Taxonomy, 2020 to 2024
    • Market Size Value (USD Million) & Volume (Tons) Forecast By Market Taxonomy, 2025 to 2035
      • By Country
        • China
        • Japan
        • South Korea
      • By Source
      • By Function
      • By Product Type
      • By Channel
      • By Claim
    • Market Attractiveness Analysis
      • By Country
      • By Source
      • By Function
      • By Product Type
      • By Channel
      • By Claim
    • Key Takeaways
  16. South Asia & Pacific Market Analysis 2020 to 2024 and Forecast 2025 to 2035, By Country
    • Historical Market Size Value (USD Million) & Volume (Tons) Trend Analysis By Market Taxonomy, 2020 to 2024
    • Market Size Value (USD Million) & Volume (Tons) Forecast By Market Taxonomy, 2025 to 2035
      • By Country
        • India
        • Thailand
        • Malaysia
        • Indonesia
        • Singapore
        • Vietnam
        • Australia
        • New Zealand
        • Rest of South Asia
      • By Source
      • By Function
      • By Product Type
      • By Channel
      • By Claim
    • Market Attractiveness Analysis
      • By Country
      • By Source
      • By Function
      • By Product Type
      • By Channel
      • By Claim
    • Key Takeaways
  17. Middle East and Africa Market Analysis 2020 to 2024 and Forecast 2025 to 2035, By Country
    • Historical Market Size Value (USD Million) & Volume (Tons) Trend Analysis By Market Taxonomy, 2020 to 2024
    • Market Size Value (USD Million) & Volume (Tons) Forecast By Market Taxonomy, 2025 to 2035
      • By Country
        • Turkey
        • UAE
        • Saudi Arabia
        • Israel
        • Other GCC Countries
        • North Africa
        • South Africa
      • By Source
      • By Function
      • By Product Type
      • By Channel
      • By Claim
    • Market Attractiveness Analysis
      • By Country
      • By Source
      • By Function
      • By Product Type
      • By Channel
      • By Claim
    • Key Takeaways
  18. Key Countries Market Analysis
    • USA
      • Pricing Analysis
      • Market Share Analysis, 2024
        • By Source
        • By Function
        • By Product Type
        • By Channel
        • By Claim
    • Canada
      • Pricing Analysis
      • Market Share Analysis, 2024
        • By Source
        • By Function
        • By Product Type
        • By Channel
        • By Claim
    • Mexico
      • Pricing Analysis
      • Market Share Analysis, 2024
        • By Source
        • By Function
        • By Product Type
        • By Channel
        • By Claim
    • Brazil
      • Pricing Analysis
      • Market Share Analysis, 2024
        • By Source
        • By Function
        • By Product Type
        • By Channel
        • By Claim
    • Germany
      • Pricing Analysis
      • Market Share Analysis, 2024
        • By Source
        • By Function
        • By Product Type
        • By Channel
        • By Claim
    • UK
      • Pricing Analysis
      • Market Share Analysis, 2024
        • By Source
        • By Function
        • By Product Type
        • By Channel
        • By Claim
    • Italy
      • Pricing Analysis
      • Market Share Analysis, 2024
        • By Source
        • By Function
        • By Product Type
        • By Channel
        • By Claim
    • Spain
      • Pricing Analysis
      • Market Share Analysis, 2024
        • By Source
        • By Function
        • By Product Type
        • By Channel
        • By Claim
    • France
      • Pricing Analysis
      • Market Share Analysis, 2024
        • By Source
        • By Function
        • By Product Type
        • By Channel
        • By Claim
    • India
      • Pricing Analysis
      • Market Share Analysis, 2024
        • By Source
        • By Function
        • By Product Type
        • By Channel
        • By Claim
    • Australia & New Zealand
      • Pricing Analysis
      • Market Share Analysis, 2024
        • By Source
        • By Function
        • By Product Type
        • By Channel
        • By Claim
    • China
      • Pricing Analysis
      • Market Share Analysis, 2024
        • By Source
        • By Function
        • By Product Type
        • By Channel
        • By Claim
    • Japan
      • Pricing Analysis
      • Market Share Analysis, 2024
        • By Source
        • By Function
        • By Product Type
        • By Channel
        • By Claim
    • South Korea
      • Pricing Analysis
      • Market Share Analysis, 2024
        • By Source
        • By Function
        • By Product Type
        • By Channel
        • By Claim
    • Russia
      • Pricing Analysis
      • Market Share Analysis, 2024
        • By Source
        • By Function
        • By Product Type
        • By Channel
        • By Claim
    • Poland
      • Pricing Analysis
      • Market Share Analysis, 2024
        • By Source
        • By Function
        • By Product Type
        • By Channel
        • By Claim
    • Hungary
      • Pricing Analysis
      • Market Share Analysis, 2024
        • By Source
        • By Function
        • By Product Type
        • By Channel
        • By Claim
    • Kingdom of Saudi Arabia
      • Pricing Analysis
      • Market Share Analysis, 2024
        • By Source
        • By Function
        • By Product Type
        • By Channel
        • By Claim
    • South Africa
      • Pricing Analysis
      • Market Share Analysis, 2024
        • By Source
        • By Function
        • By Product Type
        • By Channel
        • By Claim
  19. Market Structure Analysis
    • Competition Dashboard
    • Competition Benchmarking
    • Market Share Analysis of Top Players
      • By Regional
      • By Source
      • By Function
      • By Product Type
      • By Channel
      • By Claim
  20. Competition Analysis
    • Competition Deep Dive
      • Entoprotech
        • Overview
        • Product Portfolio
        • Profitability by Market Segments (Product/Age /Sales Channel/Region)
        • Sales Footprint
        • Strategy Overview
        • Chrysalin
        • Kaiser Worm Skincare
        • Geltor
        • DSM-Firmenich
        • Croda
        • Ashland
        • BASF
        • Symrise
        • Seppic
    • Assumptions & Acronyms Used
    • Research Methodology

List of Tables

  • Table 1: Global Market Value (USD Million) Forecast by Region, 2020-2035
  • Table 2: Global Market Volume (Tons) Forecast by Region, 2020-2035
  • Table 3: Global Market Value (USD Million) Forecast by Source, 2020-2035
  • Table 4: Global Market Volume (Tons) Forecast by Source, 2020-2035
  • Table 5: Global Market Value (USD Million) Forecast by Function, 2020-2035
  • Table 6: Global Market Volume (Tons) Forecast by Function, 2020-2035
  • Table 7: Global Market Value (USD Million) Forecast by Product Type, 2020-2035
  • Table 8: Global Market Volume (Tons) Forecast by Product Type, 2020-2035
  • Table 9: Global Market Value (USD Million) Forecast by Channel, 2020-2035
  • Table 10: Global Market Volume (Tons) Forecast by Channel, 2020-2035
  • Table 11: Global Market Value (USD Million) Forecast by Claim, 2020-2035
  • Table 12: Global Market Volume (Tons) Forecast by Claim, 2020-2035
  • Table 13: North America Market Value (USD Million) Forecast by Country, 2020-2035
  • Table 14: North America Market Volume (Tons) Forecast by Country, 2020-2035
  • Table 15: North America Market Value (USD Million) Forecast by Source, 2020-2035
  • Table 16: North America Market Volume (Tons) Forecast by Source, 2020-2035
  • Table 17: North America Market Value (USD Million) Forecast by Function, 2020-2035
  • Table 18: North America Market Volume (Tons) Forecast by Function, 2020-2035
  • Table 19: North America Market Value (USD Million) Forecast by Product Type, 2020-2035
  • Table 20: North America Market Volume (Tons) Forecast by Product Type, 2020-2035
  • Table 21: North America Market Value (USD Million) Forecast by Channel, 2020-2035
  • Table 22: North America Market Volume (Tons) Forecast by Channel, 2020-2035
  • Table 23: North America Market Value (USD Million) Forecast by Claim, 2020-2035
  • Table 24: North America Market Volume (Tons) Forecast by Claim, 2020-2035
  • Table 25: Latin America Market Value (USD Million) Forecast by Country, 2020-2035
  • Table 26: Latin America Market Volume (Tons) Forecast by Country, 2020-2035
  • Table 27: Latin America Market Value (USD Million) Forecast by Source, 2020-2035
  • Table 28: Latin America Market Volume (Tons) Forecast by Source, 2020-2035
  • Table 29: Latin America Market Value (USD Million) Forecast by Function, 2020-2035
  • Table 30: Latin America Market Volume (Tons) Forecast by Function, 2020-2035
  • Table 31: Latin America Market Value (USD Million) Forecast by Product Type, 2020-2035
  • Table 32: Latin America Market Volume (Tons) Forecast by Product Type, 2020-2035
  • Table 33: Latin America Market Value (USD Million) Forecast by Channel, 2020-2035
  • Table 34: Latin America Market Volume (Tons) Forecast by Channel, 2020-2035
  • Table 35: Latin America Market Value (USD Million) Forecast by Claim, 2020-2035
  • Table 36: Latin America Market Volume (Tons) Forecast by Claim, 2020-2035
  • Table 37: Europe Market Value (USD Million) Forecast by Country, 2020-2035
  • Table 38: Europe Market Volume (Tons) Forecast by Country, 2020-2035
  • Table 39: Europe Market Value (USD Million) Forecast by Source, 2020-2035
  • Table 40: Europe Market Volume (Tons) Forecast by Source, 2020-2035
  • Table 41: Europe Market Value (USD Million) Forecast by Function, 2020-2035
  • Table 42: Europe Market Volume (Tons) Forecast by Function, 2020-2035
  • Table 43: Europe Market Value (USD Million) Forecast by Product Type, 2020-2035
  • Table 44: Europe Market Volume (Tons) Forecast by Product Type, 2020-2035
  • Table 45: Europe Market Value (USD Million) Forecast by Channel, 2020-2035
  • Table 46: Europe Market Volume (Tons) Forecast by Channel, 2020-2035
  • Table 47: Europe Market Value (USD Million) Forecast by Claim, 2020-2035
  • Table 48: Europe Market Volume (Tons) Forecast by Claim, 2020-2035
  • Table 49: East Asia Market Value (USD Million) Forecast by Country, 2020-2035
  • Table 50: East Asia Market Volume (Tons) Forecast by Country, 2020-2035
  • Table 51: East Asia Market Value (USD Million) Forecast by Source, 2020-2035
  • Table 52: East Asia Market Volume (Tons) Forecast by Source, 2020-2035
  • Table 53: East Asia Market Value (USD Million) Forecast by Function, 2020-2035
  • Table 54: East Asia Market Volume (Tons) Forecast by Function, 2020-2035
  • Table 55: East Asia Market Value (USD Million) Forecast by Product Type, 2020-2035
  • Table 56: East Asia Market Volume (Tons) Forecast by Product Type, 2020-2035
  • Table 57: East Asia Market Value (USD Million) Forecast by Channel, 2020-2035
  • Table 58: East Asia Market Volume (Tons) Forecast by Channel, 2020-2035
  • Table 59: East Asia Market Value (USD Million) Forecast by Claim, 2020-2035
  • Table 60: East Asia Market Volume (Tons) Forecast by Claim, 2020-2035
  • Table 61: South Asia & Pacific Market Value (USD Million) Forecast by Country, 2020-2035
  • Table 62: South Asia & Pacific Market Volume (Tons) Forecast by Country, 2020-2035
  • Table 63: South Asia & Pacific Market Value (USD Million) Forecast by Source, 2020-2035
  • Table 64: South Asia & Pacific Market Volume (Tons) Forecast by Source, 2020-2035
  • Table 65: South Asia & Pacific Market Value (USD Million) Forecast by Function, 2020-2035
  • Table 66: South Asia & Pacific Market Volume (Tons) Forecast by Function, 2020-2035
  • Table 67: South Asia & Pacific Market Value (USD Million) Forecast by Product Type, 2020-2035
  • Table 68: South Asia & Pacific Market Volume (Tons) Forecast by Product Type, 2020-2035
  • Table 69: South Asia & Pacific Market Value (USD Million) Forecast by Channel, 2020-2035
  • Table 70: South Asia & Pacific Market Volume (Tons) Forecast by Channel, 2020-2035
  • Table 71: South Asia & Pacific Market Value (USD Million) Forecast by Claim, 2020-2035
  • Table 72: South Asia & Pacific Market Volume (Tons) Forecast by Claim, 2020-2035
  • Table 73: Middle East and Africa Market Value (USD Million) Forecast by Country, 2020-2035
  • Table 74: Middle East and Africa Market Volume (Tons) Forecast by Country, 2020-2035
  • Table 75: Middle East and Africa Market Value (USD Million) Forecast by Source, 2020-2035
  • Table 76: Middle East and Africa Market Volume (Tons) Forecast by Source, 2020-2035
  • Table 77: Middle East and Africa Market Value (USD Million) Forecast by Function, 2020-2035
  • Table 78: Middle East and Africa Market Volume (Tons) Forecast by Function, 2020-2035
  • Table 79: Middle East and Africa Market Value (USD Million) Forecast by Product Type, 2020-2035
  • Table 80: Middle East and Africa Market Volume (Tons) Forecast by Product Type, 2020-2035
  • Table 81: Middle East and Africa Market Value (USD Million) Forecast by Channel, 2020-2035
  • Table 82: Middle East and Africa Market Volume (Tons) Forecast by Channel, 2020-2035
  • Table 83: Middle East and Africa Market Value (USD Million) Forecast by Claim, 2020-2035
  • Table 84: Middle East and Africa Market Volume (Tons) Forecast by Claim, 2020-2035

List of Figures

  • Figure 1: Global Market Volume (Tons) Forecast 2020-2035
  • Figure 2: Global Market Pricing Analysis
  • Figure 3: Global Market Value (USD Million) Forecast 2020-2035
  • Figure 4: Global Market Value Share and BPS Analysis by Source, 2025 and 2035
  • Figure 5: Global Market Y-o-Y Growth Comparison by Source, 2025-2035
  • Figure 6: Global Market Attractiveness Analysis by Source
  • Figure 7: Global Market Value Share and BPS Analysis by Function, 2025 and 2035
  • Figure 8: Global Market Y-o-Y Growth Comparison by Function, 2025-2035
  • Figure 9: Global Market Attractiveness Analysis by Function
  • Figure 10: Global Market Value Share and BPS Analysis by Product Type, 2025 and 2035
  • Figure 11: Global Market Y-o-Y Growth Comparison by Product Type, 2025-2035
  • Figure 12: Global Market Attractiveness Analysis by Product Type
  • Figure 13: Global Market Value Share and BPS Analysis by Channel, 2025 and 2035
  • Figure 14: Global Market Y-o-Y Growth Comparison by Channel, 2025-2035
  • Figure 15: Global Market Attractiveness Analysis by Channel
  • Figure 16: Global Market Value Share and BPS Analysis by Claim, 2025 and 2035
  • Figure 17: Global Market Y-o-Y Growth Comparison by Claim, 2025-2035
  • Figure 18: Global Market Attractiveness Analysis by Claim
  • Figure 19: Global Market Value (USD Million) Share and BPS Analysis by Region, 2025 and 2035
  • Figure 20: Global Market Y-o-Y Growth Comparison by Region, 2025-2035
  • Figure 21: Global Market Attractiveness Analysis by Region
  • Figure 22: North America Market Incremental $ Opportunity, 2025-2035
  • Figure 23: Latin America Market Incremental $ Opportunity, 2025-2035
  • Figure 24: Europe Market Incremental $ Opportunity, 2025-2035
  • Figure 25: East Asia Market Incremental $ Opportunity, 2025-2035
  • Figure 26: South Asia & Pacific Market Incremental $ Opportunity, 2025-2035
  • Figure 27: Middle East and Africa Market Incremental $ Opportunity, 2025-2035
  • Figure 28: North America Market Value Share and BPS Analysis by Country, 2025 and 2035
  • Figure 29: North America Market Value Share and BPS Analysis by Source, 2025 and 2035
  • Figure 30: North America Market Y-o-Y Growth Comparison by Source, 2025-2035
  • Figure 31: North America Market Attractiveness Analysis by Source
  • Figure 32: North America Market Value Share and BPS Analysis by Function, 2025 and 2035
  • Figure 33: North America Market Y-o-Y Growth Comparison by Function, 2025-2035
  • Figure 34: North America Market Attractiveness Analysis by Function
  • Figure 35: North America Market Value Share and BPS Analysis by Product Type, 2025 and 2035
  • Figure 36: North America Market Y-o-Y Growth Comparison by Product Type, 2025-2035
  • Figure 37: North America Market Attractiveness Analysis by Product Type
  • Figure 38: North America Market Value Share and BPS Analysis by Channel, 2025 and 2035
  • Figure 39: North America Market Y-o-Y Growth Comparison by Channel, 2025-2035
  • Figure 40: North America Market Attractiveness Analysis by Channel
  • Figure 41: North America Market Value Share and BPS Analysis by Claim, 2025 and 2035
  • Figure 42: North America Market Y-o-Y Growth Comparison by Claim, 2025-2035
  • Figure 43: North America Market Attractiveness Analysis by Claim
  • Figure 44: Latin America Market Value Share and BPS Analysis by Country, 2025 and 2035
  • Figure 45: Latin America Market Value Share and BPS Analysis by Source, 2025 and 2035
  • Figure 46: Latin America Market Y-o-Y Growth Comparison by Source, 2025-2035
  • Figure 47: Latin America Market Attractiveness Analysis by Source
  • Figure 48: Latin America Market Value Share and BPS Analysis by Function, 2025 and 2035
  • Figure 49: Latin America Market Y-o-Y Growth Comparison by Function, 2025-2035
  • Figure 50: Latin America Market Attractiveness Analysis by Function
  • Figure 51: Latin America Market Value Share and BPS Analysis by Product Type, 2025 and 2035
  • Figure 52: Latin America Market Y-o-Y Growth Comparison by Product Type, 2025-2035
  • Figure 53: Latin America Market Attractiveness Analysis by Product Type
  • Figure 54: Latin America Market Value Share and BPS Analysis by Channel, 2025 and 2035
  • Figure 55: Latin America Market Y-o-Y Growth Comparison by Channel, 2025-2035
  • Figure 56: Latin America Market Attractiveness Analysis by Channel
  • Figure 57: Latin America Market Value Share and BPS Analysis by Claim, 2025 and 2035
  • Figure 58: Latin America Market Y-o-Y Growth Comparison by Claim, 2025-2035
  • Figure 59: Latin America Market Attractiveness Analysis by Claim
  • Figure 60: Europe Market Value Share and BPS Analysis by Country, 2025 and 2035
  • Figure 61: Europe Market Value Share and BPS Analysis by Source, 2025 and 2035
  • Figure 62: Europe Market Y-o-Y Growth Comparison by Source, 2025-2035
  • Figure 63: Europe Market Attractiveness Analysis by Source
  • Figure 64: Europe Market Value Share and BPS Analysis by Function, 2025 and 2035
  • Figure 65: Europe Market Y-o-Y Growth Comparison by Function, 2025-2035
  • Figure 66: Europe Market Attractiveness Analysis by Function
  • Figure 67: Europe Market Value Share and BPS Analysis by Product Type, 2025 and 2035
  • Figure 68: Europe Market Y-o-Y Growth Comparison by Product Type, 2025-2035
  • Figure 69: Europe Market Attractiveness Analysis by Product Type
  • Figure 70: Europe Market Value Share and BPS Analysis by Channel, 2025 and 2035
  • Figure 71: Europe Market Y-o-Y Growth Comparison by Channel, 2025-2035
  • Figure 72: Europe Market Attractiveness Analysis by Channel
  • Figure 73: Europe Market Value Share and BPS Analysis by Claim, 2025 and 2035
  • Figure 74: Europe Market Y-o-Y Growth Comparison by Claim, 2025-2035
  • Figure 75: Europe Market Attractiveness Analysis by Claim
  • Figure 76: East Asia Market Value Share and BPS Analysis by Country, 2025 and 2035
  • Figure 77: East Asia Market Value Share and BPS Analysis by Source, 2025 and 2035
  • Figure 78: East Asia Market Y-o-Y Growth Comparison by Source, 2025-2035
  • Figure 79: East Asia Market Attractiveness Analysis by Source
  • Figure 80: East Asia Market Value Share and BPS Analysis by Function, 2025 and 2035
  • Figure 81: East Asia Market Y-o-Y Growth Comparison by Function, 2025-2035
  • Figure 82: East Asia Market Attractiveness Analysis by Function
  • Figure 83: East Asia Market Value Share and BPS Analysis by Product Type, 2025 and 2035
  • Figure 84: East Asia Market Y-o-Y Growth Comparison by Product Type, 2025-2035
  • Figure 85: East Asia Market Attractiveness Analysis by Product Type
  • Figure 86: East Asia Market Value Share and BPS Analysis by Channel, 2025 and 2035
  • Figure 87: East Asia Market Y-o-Y Growth Comparison by Channel, 2025-2035
  • Figure 88: East Asia Market Attractiveness Analysis by Channel
  • Figure 89: East Asia Market Value Share and BPS Analysis by Claim, 2025 and 2035
  • Figure 90: East Asia Market Y-o-Y Growth Comparison by Claim, 2025-2035
  • Figure 91: East Asia Market Attractiveness Analysis by Claim
  • Figure 92: South Asia & Pacific Market Value Share and BPS Analysis by Country, 2025 and 2035
  • Figure 93: South Asia & Pacific Market Value Share and BPS Analysis by Source, 2025 and 2035
  • Figure 94: South Asia & Pacific Market Y-o-Y Growth Comparison by Source, 2025-2035
  • Figure 95: South Asia & Pacific Market Attractiveness Analysis by Source
  • Figure 96: South Asia & Pacific Market Value Share and BPS Analysis by Function, 2025 and 2035
  • Figure 97: South Asia & Pacific Market Y-o-Y Growth Comparison by Function, 2025-2035
  • Figure 98: South Asia & Pacific Market Attractiveness Analysis by Function
  • Figure 99: South Asia & Pacific Market Value Share and BPS Analysis by Product Type, 2025 and 2035
  • Figure 100: South Asia & Pacific Market Y-o-Y Growth Comparison by Product Type, 2025-2035
  • Figure 101: South Asia & Pacific Market Attractiveness Analysis by Product Type
  • Figure 102: South Asia & Pacific Market Value Share and BPS Analysis by Channel, 2025 and 2035
  • Figure 103: South Asia & Pacific Market Y-o-Y Growth Comparison by Channel, 2025-2035
  • Figure 104: South Asia & Pacific Market Attractiveness Analysis by Channel
  • Figure 105: South Asia & Pacific Market Value Share and BPS Analysis by Claim, 2025 and 2035
  • Figure 106: South Asia & Pacific Market Y-o-Y Growth Comparison by Claim, 2025-2035
  • Figure 107: South Asia & Pacific Market Attractiveness Analysis by Claim
  • Figure 108: Middle East and Africa Market Value Share and BPS Analysis by Country, 2025 and 2035
  • Figure 109: Middle East and Africa Market Value Share and BPS Analysis by Source, 2025 and 2035
  • Figure 110: Middle East and Africa Market Y-o-Y Growth Comparison by Source, 2025-2035
  • Figure 111: Middle East and Africa Market Attractiveness Analysis by Source
  • Figure 112: Middle East and Africa Market Value Share and BPS Analysis by Function, 2025 and 2035
  • Figure 113: Middle East and Africa Market Y-o-Y Growth Comparison by Function, 2025-2035
  • Figure 114: Middle East and Africa Market Attractiveness Analysis by Function
  • Figure 115: Middle East and Africa Market Value Share and BPS Analysis by Product Type, 2025 and 2035
  • Figure 116: Middle East and Africa Market Y-o-Y Growth Comparison by Product Type, 2025-2035
  • Figure 117: Middle East and Africa Market Attractiveness Analysis by Product Type
  • Figure 118: Middle East and Africa Market Value Share and BPS Analysis by Channel, 2025 and 2035
  • Figure 119: Middle East and Africa Market Y-o-Y Growth Comparison by Channel, 2025-2035
  • Figure 120: Middle East and Africa Market Attractiveness Analysis by Channel
  • Figure 121: Middle East and Africa Market Value Share and BPS Analysis by Claim, 2025 and 2035
  • Figure 122: Middle East and Africa Market Y-o-Y Growth Comparison by Claim, 2025-2035
  • Figure 123: Middle East and Africa Market Attractiveness Analysis by Claim
  • Figure 124: Global Market - Tier Structure Analysis
  • Figure 125: Global Market - Company Share Analysis

Frequently Asked Questions

How big is the Insect-Derived Proteins in Skincare Market in 2025?

The Insect-Derived Proteins in Skincare Market is estimated to be valued at USD 750.9 million in 2025.

What will be the size of the Insect-Derived Proteins in Skincare Market in 2035?

The market size for the Insect-Derived Proteins in Skincare Market is projected to reach USD 3,203.2 million by 2035.

How much will be the Insect-Derived Proteins in Skincare Market growth between 2025 and 2035?

The Insect-Derived Proteins in Skincare Market is expected to grow at a 15.6% CAGR between 2025 and 2035.

What are the key product types in the Insect-Derived Proteins in Skincare Market?

The key product types in the Insect-Derived Proteins in Skincare Market are serums, creams/lotions, masks, and ampoules.

Which function segment will contribute significant share in the Insect-Derived Proteins in Skincare Market in 2025?

In terms of function, the skin repair & regeneration segment is projected to command 49.9% share in the Insect-Derived Proteins in Skincare Market in 2025.

Explore Similar Insights

Future Market Insights

Insect-Derived Proteins in Skincare Market

Chat With

MaRIA

Hi There, I am MaRIA, Your Market Research Intelligence Assistant. How may I help you?