
- Market Size (2026)
- USD 555.2 Mn
- Forecast (2036)
- USD 1209.8 Mn
- CAGR (2026 to 2036)
- 8.1%
How big is Phycobiliproteins Market in 2026?
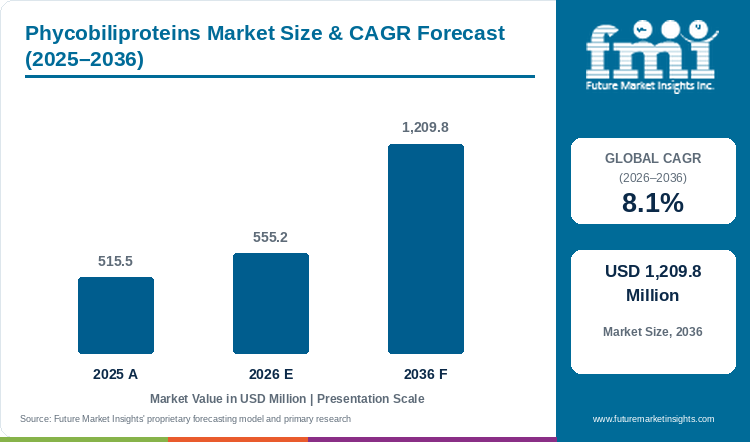
The phycobiliproteins market demonstrated steady progress from USD 515.5 million in 2025 to USD 555.2 million in 2026, building toward a targeted valuation of USD 1,209.8 million by 2036 at a CAGR of 8.1%.
The global phycobiliproteins market recorded USD 515.5 million during 2025 and climbs to an estimated USD 555.2 million for 2026. Total market valuation is anticipated to hit USD 1,209.8 million by 2036, registering an 8.1% CAGR between 2026 and 2036. C-phycocyanin blue protein holds an estimated 54.0% share of 2026 pigment demand because food and diagnostic buyers require water-soluble biliproteins with high molar extinction coefficients. Demand growth is driven by formulation substitution as immunology labs and dairy processors replace synthetic organic fluorophores and coal-tar blue dyes with purified algal chromoproteins [1]. That dual diagnostic and food substitution engine propels the broader category faster than standalone red-algal phycoerythrin fluorophores at 6.0% CAGR. Major life-science reagent suppliers are expanding conjugation and analytical capacity, as Thermo Fisher Scientific Inc. reported third-quarter 2026 results in October 2026 highlighting bioprocessing and clinical reagent launches [2]. As documented in FMI research, buyers lock in annual contracts when lyophilized biliproteins preserve chromophore stability without cold-chain denaturation through 2036.
Key Market Trends and Insights
- By pigment class: C-Phycocyanin Blue Protein holds an estimated 54.0% share in 2026 because it serves both clean-label blue food coloring and antioxidant nutraceutical markets.
- By extraction source: Spirulina Arthrospira platensis Biomass represents 57.7% in 2026 as GRAS-notified cyanobacterial strains yield high-purity phycobilisomes at commercial scale.
- By purity compendial grade: Diagnostic and Flow Cytometry Fluorophore Grade accounts for 39.4% in 2026 because A620/A280 ratios above 4.0 command premium per-milligram pricing.
- By physical state: Lyophilized Concentrated Soluble Powder secures 59.8% in 2026 owing to ambient transport stability and extended 24-month fluorescence retention.
- By sales channel: Direct Diagnostic OEM and Biopharma Supply commands 55.4% in 2026 through custom antibody-conjugation specifications and lot-to-lot spectral matching.
Regional Growth Summary
- Top national expansion: The United States leads national growth projections at an 8.4% CAGR through 2036 under synthetic food-dye phaseouts and high-parameter cytometry adoption.
- Broader country progression: Canada tracks at an 8.3% CAGR ahead of Switzerland at 8.2% and the United Kingdom at 8.1%, whereas Japan advances at a 7.0% CAGR.
Market Size and Forecast
Table 1: Market Size and Forecast for the Phycobiliproteins Market (USD million and CAGR percentage), 2025 to 2036
| Metric | Value |
|---|---|
| 2025 Market Size | USD 515.5 million |
| Estimated Market Size in 2026 | USD 555.2 million |
| Projected Market Size by 2036 | USD 1,209.8 million |
| CAGR, 2026 to 2036 | 8.1% |
| Added Market Value, 2026 to 2036 | USD 654.6 million |
Wider adoption of natural blue and red algal proteins in packaged foods and clinical diagnostics depends on overcoming heat and light instability during processing. When beverage packers or immunology labs expose unbuffered biliproteins to pasteurization heat or intense laser excitation, the protein hexamers unfold and lose both color strength and fluorescence brightness. In February 2026, structural proteomics researchers in Nature Communications showed through native mass spectrometry that conserved oligomeric interactions govern phycocyanin and allophycocyanin stability across diverse environments [3]. Accordingly, commercial extractors pair gentle membrane filtration with extracted phycocyanin pigments so buyers receive intact chromoproteins that survive industrial formulation.
Extracted Biliprotein Biomass and Fluorophore Sizing
Table 2: Extracted Biliprotein Biomass and Fluorophore Sizing for the Phycobiliproteins Market (USD million and operational ranges), 2025 to 2036
| Metric | 2025 | 2026 | 2036 |
|---|---|---|---|
| Market size (USD million) | 515.5 | 555.2 | 1,209.8 |
| Processed microalgae dry biomass (thousand metric tons) | 34.0 to 38.5 | 36.5 to 41.2 | 78.0 to 88.5 |
| Purified phycobiliprotein extract output (metric tons) | 4,120 to 4,650 | 4,450 to 5,020 | 9,600 to 10,850 |
| Diagnostic fluorophore conjugate realization (USD per gram) | 185.0 to 420.0 | 190.0 to 435.0 | 215.0 to 490.0 |
Operational note: Extract ranges span food-grade E18/E25 spirulina phycocyanin powders (A620/A280 > 0.7) through diagnostic R-phycoerythrin and allophycocyanin fluorophores (A565/A280 > 5.0).
Expansion of 30-to-50-color spectral flow cytometry panels in oncology and hematology hospitals is creating a high-margin demand stream for ultra-pure biliproteins. Clinical cytometry core labs cannot tolerate free-dye shedding or trace protease activity that degrades expensive monoclonal antibody conjugates inside patient blood assays. To meet these hospital quality gates, specialty purification houses harvest cultivated microalgae biomass in closed photobioreactors that eliminate heavy metals and endotoxins before chromatography.
Per Capita and Cytometry Laboratory Valuation Indicators
Table 3: Per Capita and Laboratory Indicators for the Phycobiliproteins Market (USD), 2025 to 2036
| Metric | 2025 | 2026 | 2036 |
|---|---|---|---|
| World population (billion) | 8.2 | 8.3 | 9.0 |
| Market value per 1,000 people (USD) | 62.9 | 66.9 | 134.4 |
| Annual procurement per diagnostic & food account (USD thousand) | 148.0 to 168.0 | 158.6 to 180.0 | 335.0 to 382.0 |
| Lyophilized trehalose-stabilized powder share (%) | 58.0% to 60.5% | 59.0% to 61.0% | 67.0% to 72.0% |
Table 4: Diagnostic OEM and Food Account Valuation Indicators for the Phycobiliproteins Market (USD and percentages), 2026
| Metric | Value | Institutional Reference Basis |
|---|---|---|
| Market size, 2026 | USD 555.2 million | 2026 global market value baseline |
| Active diagnostic OEM and food formulator accounts | 3,500 accounts | Global cytometry reagent, confectionery, and cosmetic buyers |
| Annual market value per account | USD 158,628.6 | Average account-level phycobiliprotein procurement |
| Direct Diagnostic OEM & Biopharma valuation, 2026 | USD 307.6 million | 55.4% direct sales channel allocation |
Beverage and dairy formulators replacing synthetic FD&C Blue No. 1 face a narrow pH and temperature window where unprotected C-phycocyanin precipitates and fades. Because acidified fruit drinks and pasteurized yogurts operate near the protein's isoelectric point, food brands require pre-stabilized pigment systems rather than raw spirulina extracts. Ingredient suppliers address this hurdle by co-drying trehalose and citric-acid buffers with standardized spirulina extracts so vivid blue shades hold steady on refrigerated retail shelves.
Analyst Perspective
"Diagnostic antibody conjugators and clean-label food processors buy phycobiliproteins for verified absorbance ratios and thermal shade stability rather than raw algal biomass weight. Producers that combine closed photobioreactor cultivation with gentle membrane chromatography and Refractance Window drying will capture premium supply contracts across clinical flow cytometry and natural beverage lines."
- Nandini Roy Choudhury, Principal Consultant, Future Market Insights.
How is the phycobiliproteins market segmented?
The phycobiliproteins market is segmented by pigment class, extraction source, purity compendial grade, physical state, and sales channel. In 2026, C-Phycocyanin Blue Protein is projected at 54.0%, Spirulina Arthrospira platensis Biomass at 57.7%, Diagnostic and Flow Cytometry Fluorophore Grade at 39.4%, Lyophilized Concentrated Soluble Powder at 59.8%, and Direct Diagnostic OEM and Biopharma Supply at 55.4%.
By pigment class: C-Phycocyanin Blue Protein, R-Phycoerythrin Red Fluorescent Protein, and Allophycocyanin APC Near-Infrared Protein.
By extraction source: Spirulina Arthrospira platensis Biomass, Porphyridium cruentum Red Microalgae, and Marine Cyanobacteria Aquatic Strains.
By purity compendial grade: Diagnostic and Flow Cytometry Fluorophore Grade, Food and Beverage Clean-Label Colorant Grade, and Cosmetics and Skincare Anti-Oxidant Grade.
By physical state: Lyophilized Concentrated Soluble Powder and Aqueous Liquid Suspension Solution.
By sales channel: Direct Diagnostic OEM and Biopharma Supply and Specialty Ingredient and Life-Science Distributors.
Why does C-Phycocyanin Blue Protein lead the pigment class category?
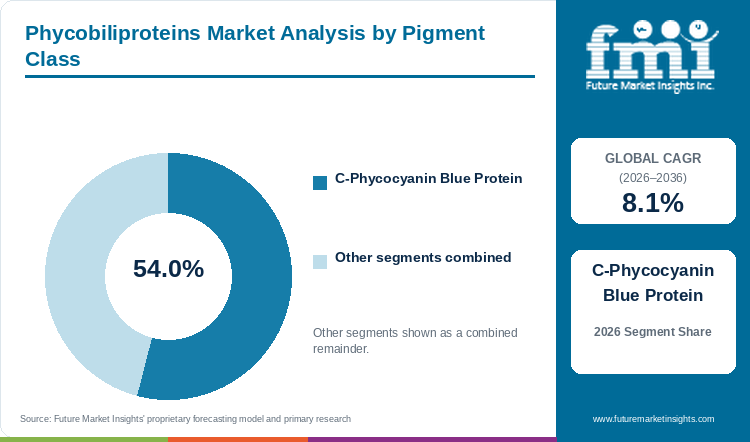
C-Phycocyanin Blue Protein holds an estimated 54.0% of pigment class demand in 2026, anchored by clean-label FD&C Blue No. 1 replacement and antioxidant nutraceutical adoption.
Table 5: Pigment Class Share for the Phycobiliproteins Market (percentage share), 2026
| Pigment Class | Share (2026) |
|---|---|
| C-Phycocyanin Blue Protein | 54.0% |
| Other Segments Combined | 46.0%* |
| Total | 100.0% |
*Note: R-Phycoerythrin Red Fluorescent Protein and Allophycocyanin APC Near-Infrared Protein account for the balance of 2026 global demand.
Table 6: Pigment Class Leadership and Market Growth for the Phycobiliproteins Market (segment and CAGR percentage), 2026 to 2036
| Metric | Value |
|---|---|
| Global CAGR (2026 to 2036) | 8.1% |
| Leading Segment | C-Phycocyanin Blue Protein |
C-Phycocyanin Blue Protein delivers brilliant sky-blue coloration in confectionery, ice cream, and functional beverages while also exhibiting potent peroxyl-radical scavenging activity in dietary capsules. Food and supplement formulators sourcing dried spirulina platensis specify C-phycocyanin concentrates with E18 to E40 color intensity to eliminate artificial brilliant blue FCF from children's snacks.
- C-Phycocyanin Blue Protein holds 54.0% of pigment class market value in 2026 because it is the primary FDA-exempt and EU-compliant natural blue food coloring protein.
- In August 2025, a molecular biotechnology review in 3 Biotech documented how genetic and photoperiod optimization elevates C-phycocyanin yield across commercial biorefineries [4].
What sustains Spirulina Arthrospira platensis Biomass leadership in the extraction source segment?
Spirulina Arthrospira platensis Biomass represents 57.7% of the extraction source category in 2026, supported by high protein content and alkaline cultivation selectivity.
Arthrospira platensis cyanobacteria thrive in high-pH carbonate-bicarbonate raceway ponds above pH 9.5 that naturally inhibit competing microbial contaminants while accumulating up to 20% dry weight as C-phycocyanin. Unlike fragile marine red microalgae that require enclosed glass photobioreactors, Arthrospira biomass scales economically across functional spirulina beverages and diagnostic allophycocyanin extraction lines.
- Spirulina Arthrospira platensis Biomass represents 57.7% of the extraction source segment in 2026 as high cellular biliprotein density lowers downstream cell-disruption costs.
- An August 2026 study in the International Journal of Biological Macromolecules demonstrated that ethephon elicitation boosts Arthrospira biomass accumulation and phycocyanin purity index over 21-day harvests [5].
How does Diagnostic and Flow Cytometry Fluorophore Grade lead the purity compendial grade category?
Diagnostic and Flow Cytometry Fluorophore Grade accounts for 39.4% of purity compendial grade value in 2026, driven by high-quantum-yield monoclonal antibody labeling.
Chromatographically purified R-phycoerythrin and allophycocyanin exhibiting absorbance ratios above 4.5 and quantum yields up to 0.82 generate five to ten times brighter signal per antibody than small organic dyes. Immunology core laboratories and IVD kit manufacturers pairing fluorophores with flow cytometry immune marker panels pay hundreds of dollars per gram for protease-free diagnostic biliproteins.
- Diagnostic and Flow Cytometry Fluorophore Grade accounts for 39.4% of purity grade market value in 2026 because ultra-pure antibody conjugates carry 50-fold higher unit prices than food grades.
- In January 2026, structural biochemists in the International Journal of Biological Macromolecules characterized hydrophilic C-phycocyanin beta-subunits that maximize extractable fluorophore stability [6].
Why does Lyophilized Concentrated Soluble Powder lead the physical state category?
Lyophilized Concentrated Soluble Powder secures 59.8% of physical state value in 2026, supported by ambient shelf life and preservative-free formulation.
Freeze-dried biliprotein powders stabilized with trehalose or sucrose excipients reconstitute instantaneously in aqueous buffers without the ammonium-sulfate precipitation or sodium-azide toxicity of liquid suspensions. Global shipment of dry lyophilized powders eliminates refrigerated air-freight surcharges and microbial spoilage risks across global food colorant and diagnostic reagent distribution networks.
- Lyophilized Concentrated Soluble Powder secures 59.8% of physical state demand in 2026 as diagnostic kit makers and beverage blenders standardize ambient dry storage.
- A June 2026 study in Food and Function demonstrated that newly purified lyophilized C-phycocyanin and allophycocyanin powders preserve blood-brain barrier antioxidant bioactivity [7].
What gives Direct Diagnostic OEM and Biopharma Supply the leading position in sales channel?
Direct Diagnostic OEM and Biopharma Supply commands 55.4% of sales channel share in 2026, anchored by custom tandem-dye cross-linking and ISO 13485 lot qualification.
Because trace ammonium ions or residual phycobilisome linker peptides ruin maleimide-thiol antibody conjugation yields, IVD instrument manufacturers contract directly with primary biliprotein purification facilities. Direct OEM technical agreements lock in spectral emission tolerances, endotoxin ceilings, and multi-lot reserve allocations for commercial hematology and oncology reagent panels.
- Direct Diagnostic OEM and Biopharma Supply commands 55.4% of sales channel market value in 2026 because IVD antibody conjugators require direct spectral and endotoxin lot release.
- In October 2025, biochemists in the International Journal of Biological Macromolecules detailed scalable chromatographic purification protocols required for clinical-grade cyanobacterial phycobiliproteins [8].
What are the drivers, restraints, and opportunities in the phycobiliproteins market?
In the phycobiliproteins market, multiplex flow cytometry expansion and synthetic food-dye replacement are projected to drive adoption whereas thermal and acidic denaturation above 45 degrees Celsius restrains unbuffered processing and enzymatic stabilization opens shelf-stable functional beverages.
- Driver: Regulatory phaseouts of synthetic coal-tar food dyes with 30-to-50-color spectral flow cytometry panel adoption expand demand for purified biliproteins.
- Restraint: Protein unfolding and color loss at pasteurization temperatures above 45 degrees Celsius or beverage pH below 4.0 restrict unencapsulated liquid applications.
- Opportunity: Enzymatic hydrolysis, probiotic fermentation modification and Refractance Window drying create heat-tolerant chromoproteins for dairy, confectionery and neuroprotective supplements.
Growth Analysis and Future Potential Demand Drivers
Simultaneous demand pull from hospital hematology laboratories running high-parameter cell sorting and food brands replacing artificial dyes is accelerating bioreactor capacity expansion. When diagnostic kit manufacturers design 40-color spectral flow panels, R-phycoerythrin and allophycocyanin tandem conjugates remain essential to separate dim cell-surface receptors on 488-nanometer and 640-nanometer lasers. Incorporation of standardized extracts with European spirulina extracts also allows confectionery and ice-cream brands to meet strict clean-label retail charters. In May 2025, photobiologists reporting in iScience demonstrated how cyanobacteria dynamically regulate phycobilisome excitation energy transfer to maximize quantum harvesting efficiency [9].
Risk Assessment of the Phycobiliproteins Market Operational Friction
Thermal denaturation of biliprotein alpha-beta heterodimers during high-temperature short-time pasteurization and photobleaching under retail LED lighting remain the primary operational restraints. Unlike synthetic small-molecule FD&C dyes that withstand 100 degrees Celsius retorting and pH 2.5 carbonation, native C-phycocyanin precipitates and fades near its isoelectric point of pH 4.2 to 4.6. In September 2025, microbiologists in the Indian Journal of Microbiology documented that multi-step ultrafiltration and ion-exchange chromatography account for up to 60% of total phycocyanin production cost [10]. Processors formulating commercial algal pigments must therefore dose encapsulates at post-pasteurization cooling stages or invest in chelating hydrocolloid stabilizers.
Commercial Opportunity Analysis and Value-Add Formats
Bioprocess innovators capture substantial margin uplift by modifying phycocyanin through controlled protease hydrolysis and lactic-acid fermentation to enhance acid stability, flavor, and bioavailability. Combination of green salt-assisted extraction with low-thermal Refractance Window drying also preserves chromophore brightness while cutting dehydration energy costs compared to prolonged freeze-drying. Formulation of stabilized blue and red biliproteins into botanical natural food colors opens natural violet, emerald, and berry shades across fermented yogurts and gummies. In March 2026, food scientists in Food Research International demonstrated that modifying phycocyanin via protease hydrolysis and Lactobacillus plantarum fermentation increased essential amino acids by 64% and achieved 90% ABTS antioxidant scavenging [11].
Phycobiliproteins Market by Country (2026 to 2036)
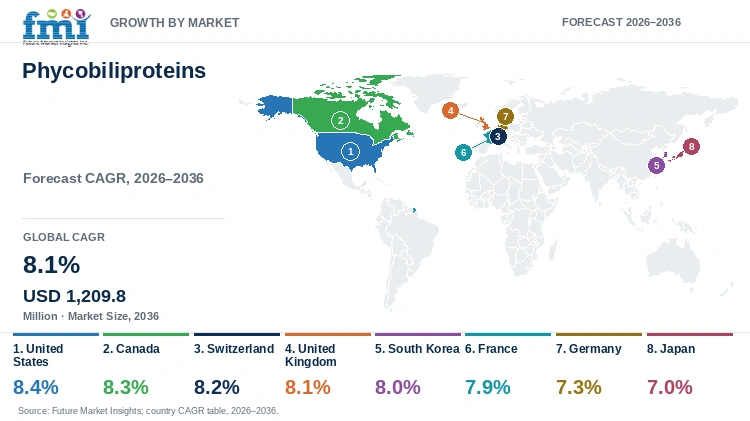
FMI country modeling indicates that the United States leads phycobiliproteins market expansion at an 8.4% CAGR through 2036, while Japan advances at a 7.0% CAGR. Commercial adoption across North American cytometry reagent plants, European clean-label food processors, and East Asian fermentation biorefineries hinges on chromatographic purity and thermal stabilization.
Table 7: Country CAGR and Primary Growth Levers for the Phycobiliproteins Market (CAGR percentage and operational drivers), 2026 to 2036
| Country | CAGR (2026 to 2036) | Primary Growth Lever |
|---|---|---|
| United States | 8.4% | FDA synthetic dye reformulation waves and high-parameter oncology flow cytometry conjugates |
| Canada | 8.3% | Closed-photobioreactor microalgae R&D and natural health product antioxidant capsules |
| Switzerland | 8.2% | Basel biopharmaceutical immunology screening and premium botanical skincare antioxidants |
| United Kingdom | 8.1% | Southampton Six artificial dye avoidance charters and NHS hematology flow cytometry panels |
| South Korea | 8.0% | K-beauty anti-photoaging serums and neuroprotective functional food extracts |
| France | 7.9% | Microalgae biorefinery clusters in Brittany and clean-label patisserie colorants |
| Germany | 7.3% | Magnetic-activated and fluorescent cell sorting reagents and coloring foodstuffs compliance |
| Japan | 7.0% | Pioneer DIC spirulina extraction heritage and precision diagnostic immunoassay conjugates |
Source: Future Market Insights analysis
United States Phycobiliproteins Market Outlook (2026 to 2036)
The United States leads national phycobiliproteins market growth at an 8.4% CAGR through 2036 as packaged food brands phase out synthetic dyes and oncology labs expand multiplex cytometry. Procurement across the United States is bifurcated between high-margin R-phycoerythrin antibody conjugates in California and Massachusetts and FDA-exempt phycocyanin beverage colors across Midwest plants. In September 2025, marine biotechnology researchers in Marine Drugs demonstrated that low-salinity semi-continuous cultivation of Porphyridium purpureum boosted phycoerythrin yield by 253% to 641.47 milligrams over 30 days [12]. American diagnostic OEMs and confectionery processors lock in direct contracts for lyophilized biliproteins with verified A620/A280 and A565/A280 spectral purity certificates. Regional diagnostic conjugators also verify zero free-dye shedding across antibody lots.
Key takeaway: In the United States, oncology flow cytometry expansion and synthetic food-dye replacement are projected to drive leading phycobiliproteins demand.
Canada Phycobiliproteins Market Outlook (2026 to 2036)
Phycobiliproteins demand in Canada should climb at an 8.3% CAGR over 2026 through 2036 inside academic immunology cores and licensed Natural Health Product supplement formulators. Cold ambient temperatures in Canada favor indoor LED-lit closed photobioreactor cultivation that yields ultra-clean Porphyridium and Arthrospira biomass free from open-pond cyanotoxins. October 2026 trade data from the USDA Foreign Agricultural Service confirmed USD 20.1 billion in Canadian consumer-oriented agricultural imports with USD 7.65 billion in online grocery demand for clean-label foods [13]. Canadian translational research institutes and nutraceutical blenders specify endotoxin-tested R-phycoerythrin conjugates and trehalose-stabilized C-phycocyanin powders for clinical and retail wellness lines. Domestic photobioreactor operators further monitor dissolved oxygen and photon flux across daily shifts.
Key takeaway: In Canada, indoor photobioreactor cultivation and clinical cytometry research are forecast to sustain strong procurement of high-purity phycobiliproteins.
Switzerland Phycobiliproteins Market Outlook (2026 to 2036)
Switzerland progresses at an 8.2% compound growth rate through 2036 since immunology hubs in Basel and Zurich consume ultra-pure phycoerythrin and allophycocyanin tandem dyes for high-throughput cell screening. What sets Switzerland apart from volume-driven food markets is the concentration of global diagnostic instrumentation headquarters and luxury alpine dermo-cosmetic formulators requiring chromatography-grade biliproteins. In October 2026, Roche Holding AG received European CE Mark clearance for its benchtop cobas smart e immunoanalyser holding 36 reagent positions for automated clinical biomarker testing [14]. Swiss analytical and cosmetic procurement teams enforce strict batch-to-batch fluorescence quantum yield and heavy-metal specifications before approving lyophilizate suppliers. Alpine cosmetic formulators also test topical serum photostability under retail lighting across seasonal batches.
Key takeaway: In Switzerland, biopharma immunology assay development and dermo-cosmetic formulation are anticipated to anchor premium fluorophore-grade phycobiliprotein contracts.
United Kingdom Phycobiliproteins Market Outlook (2026 to 2036)
Market valuation for phycobiliproteins within the United Kingdom should rise at an 8.1% CAGR across 2026 to 2036 within supermarket private-label confectionery and NHS clinical immunology laboratories. Retailers in the United Kingdom strictly enforce artificial colorant bans under legacy Southampton Six clean-label charters, compelling beverage and sweet makers to formulate with spirulina phycocyanin concentrates. March 2026 analysis from the USDA Foreign Agricultural Service confirmed that food and drink manufacturing leads British industrial output as brands remove synthetic dyes [15]. United Kingdom diagnostic kit assemblers and food ingredient houses prioritize lyophilized biliprotein lots that deliver guaranteed water solubility and zero batch color drift. British confectionery packers further validate pH shade retention across pectin gummies.
Key takeaway: In the United Kingdom, supermarket clean-label colorant charters and immuno-oncology diagnostics are estimated to drive steady phycobiliprotein adoption.
South Korea Phycobiliproteins Market Outlook (2026 to 2036)
South Korea is forecast to record an 8.0% CAGR in phycobiliproteins market value through 2036 as K-beauty cosmetic houses and functional food brands incorporate antioxidant C-phycocyanin into premium serums and jellies. Unlike Western markets where food coloring dominates volume, formulators in South Korea commercialize purified phycobiliproteins as bioactive cosmeceutical and neuroprotective ingredients. In April 2026, neurobiologists publishing in Molecular Neurobiology demonstrated that C-phycocyanin inhibits copper-induced mitochondrial cuproptosis and preserves cognitive function [16]. South Korean cosmetic ODM plants and health-food packers demand deodorized, membrane-diafiltered phycocyanin powders that remain clear and odor-free in topical ampoules. Local ODM laboratories also run membrane diafiltration to remove algal off-odors across commercial production batches.
Key takeaway: In South Korea, K-beauty antioxidant ampoules and cognitive wellness foods are forecast to accelerate demand for deodorized C-phycocyanin grades.
France Phycobiliproteins Market Outlook (2026 to 2036)
Demand for phycobiliproteins in France is slated for a 7.9% annual expansion from 2026 through 2036, anchored by Atlantic microalgae biorefineries and clean-label patisserie and dairy reformulation. France hosts Europe's densest network of marine biotechnology extractors cultivating Porphyridium cruentum and Arthrospira platensis for natural macaron, yogurt, and diagnostic applications. September 2026 retail tracking by the USDA Foreign Agricultural Service showed French food inflation slowing to 0.9% as supermarkets expanded natural coloring foodstuffs [17]. French dairy and diagnostic buyers favor organic-certified spirulina extracts and sterile-filtered phycoerythrin conjugates produced under European green-extraction standards. Marine extraction plants in Brittany and Normandy further certify organic biomass traceability and batch spectral purity across seasonal harvest cycles.
Key takeaway: In France, domestic microalgae biorefineries and clean-label dairy reformulation are slated to sustain demand for purified phycobiliproteins.
Germany Phycobiliproteins Market Outlook (2026 to 2036)
Germany is anticipated to progress at a 7.3% CAGR through 2036 because German confectionery exporters pioneered European Coloring Foodstuffs standards and domestic biotech firms lead in cell-sorting reagents. Food manufacturers in Germany replace synthetic E131 and E133 blue additives with physical water-extracted spirulina concentrates that qualify as non-E-number coloring foods on European labels. In October 2025, researchers in the International Journal of Molecular Sciences identified the exact nitrate and trace-metal media drivers that maximize C-phycocyanin productivity in Spirulina cultures [18]. German cytometry reagent producers and gummy manufacturers require strict photostability and microbial purity certificates on every imported biliprotein lot. German reagent buyers also audit quantum efficiency across tandem fluorophore batches and clinical lots.
Key takeaway: In Germany, Coloring Foodstuffs confectionery rules and cell-sorting reagent production are anticipated to sustain phycobiliprotein procurement.
Japan Phycobiliproteins Market Outlook (2026 to 2036)
Japan advances at a 7.0% CAGR from 2026 to 2036, building on decades of industrial Lina Blue phycocyanin extraction for frozen desserts, warabimochi sweets and automated hospital immunoassays. Because Japanese food sanitation laws long restricted synthetic blue dyes in traditional confections, domestic beverage and dairy processors demand heat-stabilized and acid-tolerant phycocyanin grades. In January 2025, bioprocess engineers reporting in Bioresource Technology demonstrated a seawater-salinity biostimulant strategy that raised C-phycocyanin yield to 83 milligrams per liter per day [19]. Japanese diagnostic and food buyers enforce zero-geosmin off-odor thresholds and precise spectral absorbance ratios across all contracted biliprotein shipments. Japanese dessert formulators further specify trehalose buffers for high-temperature pasteurization across commercial dairy lines.
Key takeaway: In Japan, heat-stabilized confectionery colorants and clinical immunoassay reagents are predicted to sustain steady phycobiliprotein demand.
Extended country growth tables cover North America and Latin America plus Western Europe and Eastern Europe. Regional forecasts further evaluate East Asia, South Asia and Pacific, and Middle East and Africa.
Who are the notable companies in the phycobiliproteins market?
AstraZeneca plc, Medtronic plc, Boston Scientific Corporation, Abbott Laboratories, Thermo Fisher Scientific Inc., Danaher Corporation, Roche Holding AG, Merck and Co. Inc., Novartis AG, and Sanofi SA are the notable companies evaluated across the phycobiliproteins diagnostic and life-science ecosystem.
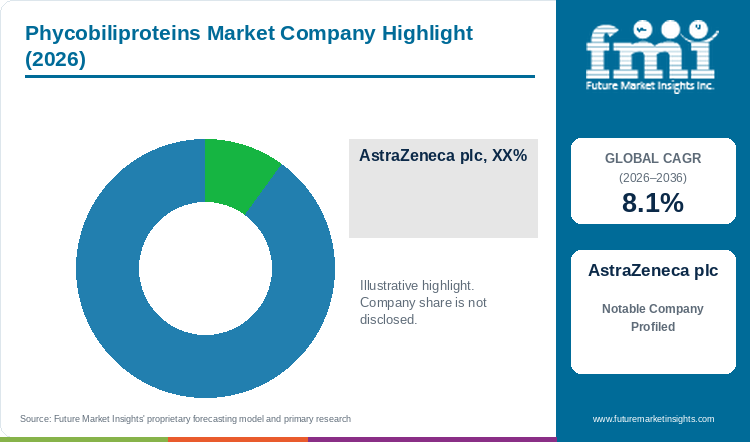
Supplier structure within the phycobiliproteins sector divides into fluorophore conjugation specialists, immuno-oncology trial sponsors, and clinical device manufacturers. Thermo Fisher Scientific Inc. joins Danaher Corporation and Abbott Laboratories plus Roche Holding AG in supplying phycobiliprotein antibody labels. Meanwhile AstraZeneca plc and Merck and Co Inc join Novartis AG and Sanofi SA in cellular assays, while Medtronic plc and partner Boston Scientific Corporation build optical hardware.
- Flow Cytometry Conjugates and Diagnostic Platform Leaders: Thermo Fisher Scientific Inc and Danaher Corporation, Abbott Laboratories and Roche Holding AG supply R-phycoerythrin, allophycocyanin and tandem-dye antibody conjugates with automated cytometry and immunoassay analyzers.
- Immuno-Oncology and Translational Biomarker Innovators: AstraZeneca plc, Merck and Co Inc and Novartis AG and Sanofi SA deploy multiparameter biliprotein fluorescence panels across oncology, immunology and cell-therapy clinical trials.
- Adjacent Clinical Diagnostics and Medical Systems: Medtronic plc and Boston Scientific Corporation integrate optical biomarker detection and interventional diagnostic workflows across hospital care settings.
Competitive Benchmarking in the Phycobiliproteins Market
Table 8: Competitive Benchmarking for the Phycobiliproteins Market (qualitative capability ratings), 2026
| Company | Fluorophore & Assay Integration | Bioprocess & Purification Scale | Clean-Label & Nutrition Fit | Geographic Reach |
|---|---|---|---|---|
| AstraZeneca plc | High | High | Medium | Global immuno-oncology trial network; 47 regional approvals by Q3 2026 |
| Medtronic plc | Medium | High | Medium | Global medical technology and clinical monitoring network across 150+ countries |
| Boston Scientific Corporation | Medium | Medium | Medium | Global interventional and diagnostic medical technology footprint |
| Abbott Laboratories | High | High | High | Global core lab diagnostics (+5.3% Q4 2025) and clinical nutrition leader |
| Thermo Fisher Scientific Inc. | High | High | Medium | Global Invitrogen eBioscience PE/APC antibody conjugates and cytometry |
| Danaher Corporation | High | High | Medium | Global Beckman Coulter Life Sciences cytometry and Cytiva chromatography |
| Roche Holding AG | High | High | Medium | Global Diagnostics Division (+6% USD 9M 2026) and immunology portfolio |
| Merck and Co. Inc. | High | High | Medium | Global oncology and life-science biomarker assay validation network |
| Novartis AG | High | High | Medium | Global hematology and immunology translational clinical research network |
| Sanofi SA | High | High | Medium | Global immunology and specialty care R&D and biologics network |
Evaluation basis: Fluorophore and Assay Integration evaluates documented deployment of R-phycoerythrin and allophycocyanin conjugates in flow cytometry and immunoassays, whereas Bioprocess and Purification Scale rates chromatographic resin and membrane filtration capabilities. Clean-Label and Nutrition Fit measures participation in natural nutritional and clinical wellness formulations.
Key Developments in the Phycobiliproteins Market
- Abbott Laboratories completed its strategic oncology diagnostics expansion in April 2026 and projected 6.5% to 7.5% full-year 2026 comparable sales growth across diagnostic and nutrition divisions [20].
- Roche Holding AG reported strong full-year 2025 operational performance in January 2026, advancing 10 new molecules into Phase III development supported by translational biomarker assays [21].
- Medtronic plc reported record fourth-quarter and full-year fiscal 2026 financial results in June 2026, expanding enterprise medical technology and diagnostic monitoring deployment [22].
Key Players in the Phycobiliproteins Market
Flow Cytometry Conjugates and Diagnostic Platform Leaders
- Thermo Fisher Scientific Inc.
- Danaher Corporation
- Abbott Laboratories
- Roche Holding AG
Immuno-Oncology and Translational Biomarker Innovators
- AstraZeneca plc
- Merck and Co Inc
- Novartis AG
- Sanofi SA
Adjacent Clinical Diagnostics and Medical Systems
- Medtronic plc
- Boston Scientific Corporation
Phycobiliproteins Market - Report Scope
Table 9: Report Scope for the Phycobiliproteins Market (coverage fields and definitions), 2026 to 2036
| Coverage field | Report scope |
|---|---|
| Market breakdown | Pigment Class; Extraction Source; Purity Compendial Grade; Physical State; Sales Channel |
| Quantitative Units | USD Million |
| Market Definition | Includes commercial supplier market value from purified phycobiliproteins (C-phycocyanin, R-phycoerythrin, B-phycoerythrin, and allophycocyanin) extracted from cyanobacteria and red microalgae across diagnostic fluorophore grade, food and beverage clean-label colorant grade, and cosmetic antioxidant grade. Category Scope Note: Excludes unextracted whole-cell spirulina animal feed, synthetic organic fluorophores (FITC, Alexa Fluor), and lipid-soluble carotenoids (astaxanthin, beta-carotene). |
| Regions Covered | North America; Latin America; Western Europe; Eastern Europe; East Asia; South Asia and Pacific; Middle East and Africa |
| Countries Covered | United States, Canada, Switzerland, United Kingdom, South Korea, France, Germany, Japan, and additional countries in the full report |
| Key Companies Covered | AstraZeneca plc, Medtronic plc, Boston Scientific Corporation, Abbott Laboratories, Thermo Fisher Scientific Inc., Danaher Corporation, Roche Holding AG, Merck and Co. Inc., Novartis AG, Sanofi SA |
| Forecast Period | 2026 to 2036 |
| Approach | Valuation triangulated via physical volume shipments, manufacturer ASP realizations, and published industry reports. Child market represents 6.2% of Global Pharmaceutical and Medical Technology Industry. Compounding validated at 8.1% CAGR with zero hierarchy anomalies. |
Phycobiliproteins Market - Research Methodology
Table 10: Research Methodology for the Phycobiliproteins Market (research methods and approach), 2026 edition
| Method | Approach |
|---|---|
| Primary Research | Structured interviews with flow cytometry antibody conjugation directors, microalgae biorefinery engineers, and clean-label food colorant formulators to validate A620/A280 and A565/A280 purity pricing. |
| Secondary Research | Analysis of PubMed and PMC biliprotein purification studies, FDA color additive petitions, European Coloring Foodstuffs guidelines, and audited corporate diagnostic disclosures. |
| Market Sizing and Forecasting | Top-down parent algal pigments and clinical cytometry reagent baselines reconciled against bottom-up purified biliprotein tonnage (4,450 to 5,020 MT in 2026) and grade-weighted ASP realizations from 2026 to 2036. |
| Country Forecasting Model | Econometric national projections weight spectral flow cytometer placements, synthetic food-dye replacement timelines, and domestic photobioreactor extraction capacity across eight countries. |
| Operational Benchmark Traceability | Biomass and fluorophore indicators in Tables 2, 3, and 4 trace to published C-phycocyanin extraction yields and diagnostic OEM antibody-conjugation specifications. |
| Data Triangulation and Validation | Valuation estimates isolate water-soluble biliprotein extracts and fluorophore conjugates while strictly excluding whole-algae meal and lipid carotenoids. |
Phycobiliproteins Market by Segments
Phycobiliproteins Market segmented by Pigment Class:
- C-Phycocyanin Blue Protein
- R-Phycoerythrin Red Fluorescent Protein
- Allophycocyanin APC Near-Infrared Protein
Phycobiliproteins Market segmented by Extraction Source:
- Spirulina Arthrospira platensis Biomass
- Porphyridium cruentum Red Microalgae
- Marine Cyanobacteria Aquatic Strains
Phycobiliproteins Market segmented by Purity Compendial Grade:
- Diagnostic and Flow Cytometry Fluorophore Grade
- Food and Beverage Clean-Label Colorant Grade
- Cosmetics and Skincare Anti-Oxidant Grade
Phycobiliproteins Market segmented by Physical State:
- Lyophilized Concentrated Soluble Powder
- Aqueous Liquid Suspension Solution
Phycobiliproteins Market segmented by Sales Channel:
- Direct Diagnostic OEM and Biopharma Supply
- Specialty Ingredient and Life-Science Distributors
Phycobiliproteins Market by Region
- North America
- United States
- Canada
- Latin America
- Brazil
- Mexico
- Argentina
- Chile
- Western Europe
- Germany
- France
- United Kingdom
- Italy
- Spain
- Benelux
- Nordics
- Eastern Europe
- Poland
- Czech Republic
- Romania
- Hungary
- East Asia
- China
- Japan
- South Korea
- South Asia and Pacific
- India
- ASEAN
- Australia and New Zealand
- Middle East and Africa
- GCC Countries
- South Africa
- Türkiye
- Israel
Research Sources and Bibliography
- [1] Nguyen D et al (2026, September 17). Preparation of phycocyanin-rich powder from Spirulina platensis algae using Refractance Window drying. Food Chemistry X, 39, 104423 (PubMed PMID 42819745).
- [2] Thermo Fisher Scientific Inc (2026, October 21). Thermo Fisher Scientific Reports Third Quarter 2026 Financial Results. Thermo Fisher Investor Relations.
- [3] lin T et al (2026, February 16). Mass spectrometry reveals the evolutionary conservation of phycobiliprotein complexes. Nature Communications, 17(1), 2834 (PubMed PMID 41698895).
- [4] Patel S et al (2025, August 7). A review on C-phycocyanin genetic regulation and industrial production. 3 Biotech, 15(8), 40773281 (PubMed PMID 40773281).
- [5] Kim H et al (2026, August 20). Ethephon elicitation enhances biomass accumulation and C-phycocyanin production in Spirulina. International Journal of Biological Macromolecules, 282, 42622688 (PubMed PMID 42622688).
- [6] Thajuddin N et al (2026, January 6). Molecular and structural characterization of the C-phycocyanin beta-subunit in native cyanobacteria. Archives of Microbiology, 208(2), 90 (PubMed PMID 41493570).
- [7] Ferrara L et al (2026, June 18). Neuroprotective effects of C-phycocyanin and allophycocyanin from Spirulina across physiological barriers. Journal of Biological Engineering, 20(1), 42310693 (PubMed PMID 42310693).
- [8] Venkatesh K et al (2025, October 23). Trends in cyanobacterial Phycobiliproteins structure and industrial purification applications. International Journal of Biological Macromolecules, 270, 148517 (PubMed PMID 41138878).
- [9] Bauer M et al (2025, May 8). Cyanobacteria dynamically regulate phycobilisome-to-photosystem excitation energy transfer. iScience, 28(6), 112610 (PubMed PMID 40502688).
- [10] Singh P et al (2025, September 15). Production and Applications of Cyanobacterial Phycocyanin in Biotechnology. Indian Journal of Microbiology, 65(3), 1567-1585 (PubMed PMID 41180859).
- [11] Wu Q et al (2026, March 18). Modification of phycocyanin by Lactobacillus plantarum fermentation and protease hydrolysis. Food Research International, 205, 41875775 (PubMed PMID 41875775).
- [12] Chen X et al (2025, September 19). Marine cultivation for enhancing Phycoerythrin Production of Marine Red Microalga Porphyridium purpureum with Low Salinity. Marine Drugs, 23(9), 361 (PubMed PMID 41003330).
- [13] USDA Foreign Agricultural Service (2026, October 20). Canada Retail Foods Annual Report CA2026-0041. US Department of Agriculture GAIN.
- [14] Roche Holding AG (2026, October 27). Roche receives CE Mark for cobas smart e benchtop immunoanalyser. Roche Media Releases.
- [15] USDA Foreign Agricultural Service. (2026, March 25). United Kingdom Food Processing Ingredients Annual Report UK2026-0009. US Department of Agriculture GAIN.
- [16] He W et al (2026, April 1). Cuproptosis Inhibition by C-Phycocyanin Confers Neuroprotection against Mitochondrial Damage. Molecular Neurobiology, 63(1), 547 (PubMed PMID 41922617).
- [17] USDA Foreign Agricultural Service (2026, September 15). France Retail Foods Annual Report FR2026-0024. US Department of Agriculture GAIN.
- [18] Gomez D et al (2025, October 27). Key Nutrient Drivers for Biomass and C-Phycocyanin Production in Spirulina sp. Revealed by Media Optimization. International Journal of Molecular Sciences, 26(21), 10425 (PubMed PMID 41226464).
- [19] Tan W et al (2025, January 6). Towards sustainable spirulina farming enhancing productivity and C-phycocyanin yield. Bioresource Technology, 418, 39778684 (PubMed PMID 39778684).
- [20] Abbott Laboratories. (2026, April 16). Abbott Reports First-Quarter 2026 Results and Updates Full-Year Guidance. Abbott MediaRoom.
- [21] Roche Holding AG (2026, January 28). Roche Reports Strong 2025 Results and 2026 Operational Outlook. Roche Media Releases.
- [22] Medtronic plc (2026, June 3). Medtronic Reports Fourth Quarter and Full Year Fiscal 2026 Financial Results. Medtronic Newsroom.
- [23] Kafeshani M et al (2025, August 28). Effects of spirulina platensis supplementation on inflammation and quality of life in multiple sclerosis. Nutrition Journal, 24(1), 132 (PubMed PMID 40877830).
- [24] Rezaei M et al (2025, August 27). Protective effects of Spirulina platensis and phycocyanin against oxidative tissue damage. Andrologia, 57(8), 40959128 (PubMed PMID 40959128).
- [25] Roche Holding AG (2026, October 21). Roche Group Sales Increase 6 Percent at Constant Exchange Rates in First Nine Months of 2026. Roche Media Releases.
- [26] Abbott Laboratories. (2026, July 16). Abbott Reports Second-Quarter 2026 Results and Raises Full-Year EPS Guidance. Abbott MediaRoom.
- [27] AstraZeneca plc (2026, July 27). AstraZeneca H1 and Q2 2026 Financial Results and Pipeline Update. AstraZeneca Press Releases.
- [28] Boston Scientific Corporation. (2026, March 18). Boston Scientific Corporation 2025 Annual Report and Form 10-K. Boston Scientific Investor Relations.
- [29] Medtronic plc (2025, November 18). Medtronic Reports Strong Second Quarter Fiscal 2026 Financial Results. Medtronic Newsroom.
- [30] Boston Scientific Corporation. (2026, October 28). Boston Scientific Announces Financial Results for Third Quarter 2026. Boston Scientific Media Room.
- [31] Kovacs M et al (2026, July 23). Optimization of cultivation mode for pilot-scale biomass and B-phycoerythrin production by Porphyridium purpureum. Folia Microbiologica, 71(4), 42489994 (PubMed PMID 42489994).
- [32] Novartis AG (2026, May 21). Novartis Advances Radioligand Therapy Innovation and Manufacturing Leadership. Novartis Media Releases.
Representative primary references are listed above for verification. Exhaustive regulatory and clinical citations appear in the complete study.
This Report Answers
- How large is the phycobiliproteins market in 2026 and what is forecast for 2036?
- Which spectral flow cytometry and clean-label food dye shifts support phycobiliproteins demand?
- Why does C-Phycocyanin Blue Protein lead the pigment class category?
- Why does Spirulina Arthrospira platensis Biomass lead the extraction source category globally?
- How do growth rates differ across the United States, Canada, Switzerland and the United Kingdom?
- Which leading companies anchor diagnostic fluorophore conjugates versus translational biomarker panels?
- What thermal and pH thresholds cause biliprotein precipitation in beverages?
- What should processors evaluate when comparing freeze-drying against Refractance Window drying?
Table of Content
Table of Content
- Key Takeaways
- Market Size and CAGR
- Top Growth Driver
- Fastest Growing Segment
- Leading Region
- Key Companies
- Emerging Opportunities
- Executive Summary
- Global Market Outlook
- Demand-side Trends
- Supply-side Trends
- Technology Roadmap Analysis
- Analysis and Recommendations
- Analyst Perspective (What is happening? Why now? What should investors know?)
- Key Questions Answered
- How large is the market?
- What is the CAGR?
- What are key trends?
- Which region dominates?
- Who are the leaders?
Read More...
- Market Overview
- Market Coverage / Taxonomy
- Market Definition / Scope / Limitations
- Research Methodology
- Chapter Orientation
- Analytical Lens and Working Hypotheses
- Market Structure, Signals, and Trend Drivers
- Benchmarking and Cross-market Comparability
- Market Sizing, Forecasting, and Opportunity Mapping
- Research Design and Evidence Framework
- Desk Research Programme (Secondary Evidence)
- Expert Input and Fieldwork (Primary Evidence)
- Tooling, Models, and Reference Databases
- Data Engineering and Model Build
- Quality Assurance and Audit Trail
- Market Background
- Market Dynamics (Drivers, Restraints, Opportunity, Trends)
- Scenario Forecast (Optimistic, Likely, Conservative)
- Impact Analysis
- AI Impact
- Sustainability Impact
- Regulatory Impact
- Technology Impact
- Consumer / Buyer Analysis
- Purchase Drivers
- Adoption Barriers
- Buyer Journey
- Opportunity Map Analysis
- Product Life Cycle Analysis
- Supply Chain Analysis
- Investment Feasibility Matrix
- Value Chain Analysis
- PESTLE and Porter's Analysis
- Regulatory Landscape
- Regional Parent Market Outlook
- Production and Consumption Statistics
- Import and Export Statistics
- Global Market Analysis and Forecast, 2021 to 2036
- Historical Market Size Value (USD Million) Analysis, 2021 to 2025
- Current and Future Market Size Value (USD Million) Projections, 2026 to 2036
- Y-o-Y Growth Trend Analysis
- Absolute $ Opportunity Analysis
- Global Market Pricing Analysis, 2021 to 2036
- Global Market Analysis and Forecast, By Pigment Class, 2021 to 2036
- Introduction / Key Findings
- Historical Market Size Value (USD Million) Analysis By Pigment Class, 2021 to 2025
- Current and Future Market Size Value (USD Million) Analysis and Forecast By Pigment Class, 2026 to 2036
- C-Phycocyanin Blue Protein
- R-Phycoerythrin Red Fluorescent Protein
- Allophycocyanin APC Near-Infrared Protein
- Y-o-Y Growth Trend Analysis By Pigment Class, 2021 to 2025
- Absolute $ Opportunity Analysis By Pigment Class, 2026 to 2036
- Global Market Analysis and Forecast, By Extraction Source, 2021 to 2036
- Introduction / Key Findings
- Historical Market Size Value (USD Million) Analysis By Extraction Source, 2021 to 2025
- Current and Future Market Size Value (USD Million) Analysis and Forecast By Extraction Source, 2026 to 2036
- Spirulina Arthrospira platensis Biomass
- Porphyridium cruentum Red Microalgae
- Marine Cyanobacteria Aquatic Strains
- Y-o-Y Growth Trend Analysis By Extraction Source, 2021 to 2025
- Absolute $ Opportunity Analysis By Extraction Source, 2026 to 2036
- Global Market Analysis and Forecast, By Purity Compendial Grade, 2021 to 2036
- Introduction / Key Findings
- Historical Market Size Value (USD Million) Analysis By Purity Compendial Grade, 2021 to 2025
- Current and Future Market Size Value (USD Million) Analysis and Forecast By Purity Compendial Grade, 2026 to 2036
- Diagnostic and Flow Cytometry Fluorophore Grade
- Food and Beverage Clean-Label Colorant Grade
- Cosmetics and Skincare Anti-Oxidant Grade
- Y-o-Y Growth Trend Analysis By Purity Compendial Grade, 2021 to 2025
- Absolute $ Opportunity Analysis By Purity Compendial Grade, 2026 to 2036
- Global Market Analysis and Forecast, By Physical State, 2021 to 2036
- Introduction / Key Findings
- Historical Market Size Value (USD Million) Analysis By Physical State, 2021 to 2025
- Current and Future Market Size Value (USD Million) Analysis and Forecast By Physical State, 2026 to 2036
- Lyophilized Concentrated Soluble Powder
- Aqueous Liquid Suspension Solution
- Y-o-Y Growth Trend Analysis By Physical State, 2021 to 2025
- Absolute $ Opportunity Analysis By Physical State, 2026 to 2036
- Global Market Analysis and Forecast, By Sales Channel, 2021 to 2036
- Introduction / Key Findings
- Historical Market Size Value (USD Million) Analysis By Sales Channel, 2021 to 2025
- Current and Future Market Size Value (USD Million) Analysis and Forecast By Sales Channel, 2026 to 2036
- Direct Diagnostic OEM and Biopharma Supply
- Specialty Ingredient and Life-Science Distributors
- Y-o-Y Growth Trend Analysis By Sales Channel, 2021 to 2025
- Absolute $ Opportunity Analysis By Sales Channel, 2026 to 2036
- Global Market Analysis and Forecast, By Region, 2021 to 2036
- Introduction
- Historical Market Size Value (USD Million) Analysis By Region, 2021 to 2025
- Current Market Size Value (USD Million) Analysis and Forecast By Region, 2026 to 2036
- North America
- Latin America
- Western Europe
- Eastern Europe
- East Asia
- South Asia and Pacific
- Middle East and Africa
- Market Attractiveness Analysis By Region
- North America Market Analysis and Forecast, By Country, 2021 to 2036
- Historical Market Size Value (USD Million) Trend Analysis By Market Taxonomy, 2021 to 2025
- Market Size Value (USD Million) Forecast By Market Taxonomy, 2026 to 2036
- By Country
- United States
- Canada
- By Pigment Class
- By Extraction Source
- By Purity Compendial Grade
- By Physical State
- By Sales Channel
- By Country
- Market Attractiveness Analysis
- By Country
- By Pigment Class
- By Extraction Source
- By Purity Compendial Grade
- By Physical State
- By Sales Channel
- Key Takeaways
- Latin America Market Analysis and Forecast, By Country
- Historical Market Size Value (USD Million) Trend Analysis By Market Taxonomy, 2021 to 2025
- Market Size Value (USD Million) Forecast By Market Taxonomy, 2026 to 2036
- By Country
- Brazil
- Mexico
- Argentina
- Chile
- By Pigment Class
- By Extraction Source
- By Purity Compendial Grade
- By Physical State
- By Sales Channel
- By Country
- Market Attractiveness Analysis
- By Country
- By Pigment Class
- By Extraction Source
- By Purity Compendial Grade
- By Physical State
- By Sales Channel
- Key Takeaways
- Western Europe Market Analysis and Forecast, By Country
- Historical Market Size Value (USD Million) Trend Analysis By Market Taxonomy, 2021 to 2025
- Market Size Value (USD Million) Forecast By Market Taxonomy, 2026 to 2036
- By Country
- Germany
- France
- United Kingdom
- Italy
- Spain
- Benelux
- Nordics
- By Pigment Class
- By Extraction Source
- By Purity Compendial Grade
- By Physical State
- By Sales Channel
- By Country
- Market Attractiveness Analysis
- By Country
- By Pigment Class
- By Extraction Source
- By Purity Compendial Grade
- By Physical State
- By Sales Channel
- Key Takeaways
- Eastern Europe Market Analysis and Forecast, By Country
- Historical Market Size Value (USD Million) Trend Analysis By Market Taxonomy, 2021 to 2025
- Market Size Value (USD Million) Forecast By Market Taxonomy, 2026 to 2036
- By Country
- Poland
- Czech Republic
- Romania
- Hungary
- By Pigment Class
- By Extraction Source
- By Purity Compendial Grade
- By Physical State
- By Sales Channel
- By Country
- Market Attractiveness Analysis
- By Country
- By Pigment Class
- By Extraction Source
- By Purity Compendial Grade
- By Physical State
- By Sales Channel
- Key Takeaways
- East Asia Market Analysis and Forecast, By Country
- Historical Market Size Value (USD Million) Trend Analysis By Market Taxonomy, 2021 to 2025
- Market Size Value (USD Million) Forecast By Market Taxonomy, 2026 to 2036
- By Country
- China
- Japan
- South Korea
- By Pigment Class
- By Extraction Source
- By Purity Compendial Grade
- By Physical State
- By Sales Channel
- By Country
- Market Attractiveness Analysis
- By Country
- By Pigment Class
- By Extraction Source
- By Purity Compendial Grade
- By Physical State
- By Sales Channel
- Key Takeaways
- South Asia and Pacific Market Analysis and Forecast, By Country
- Historical Market Size Value (USD Million) Trend Analysis By Market Taxonomy, 2021 to 2025
- Market Size Value (USD Million) Forecast By Market Taxonomy, 2026 to 2036
- By Country
- India
- ASEAN
- Australia and New Zealand
- By Pigment Class
- By Extraction Source
- By Purity Compendial Grade
- By Physical State
- By Sales Channel
- By Country
- Market Attractiveness Analysis
- By Country
- By Pigment Class
- By Extraction Source
- By Purity Compendial Grade
- By Physical State
- By Sales Channel
- Key Takeaways
- Middle East and Africa Market Analysis and Forecast, By Country
- Historical Market Size Value (USD Million) Trend Analysis By Market Taxonomy, 2021 to 2025
- Market Size Value (USD Million) Forecast By Market Taxonomy, 2026 to 2036
- By Country
- GCC Countries
- South Africa
- Türkiye
- Israel
- By Pigment Class
- By Extraction Source
- By Purity Compendial Grade
- By Physical State
- By Sales Channel
- By Country
- Market Attractiveness Analysis
- By Country
- By Pigment Class
- By Extraction Source
- By Purity Compendial Grade
- By Physical State
- By Sales Channel
- Key Takeaways
- Key Countries Market Analysis
- United States
- Pricing Analysis
- Market Share Analysis, 2025
- By Pigment Class
- By Extraction Source
- By Purity Compendial Grade
- By Physical State
- By Sales Channel
- Canada
- Pricing Analysis
- Market Share Analysis, 2025
- By Pigment Class
- By Extraction Source
- By Purity Compendial Grade
- By Physical State
- By Sales Channel
- Mexico
- Pricing Analysis
- Market Share Analysis, 2025
- By Pigment Class
- By Extraction Source
- By Purity Compendial Grade
- By Physical State
- By Sales Channel
- Brazil
- Pricing Analysis
- Market Share Analysis, 2025
- By Pigment Class
- By Extraction Source
- By Purity Compendial Grade
- By Physical State
- By Sales Channel
- Chile
- Pricing Analysis
- Market Share Analysis, 2025
- By Pigment Class
- By Extraction Source
- By Purity Compendial Grade
- By Physical State
- By Sales Channel
- Germany
- Pricing Analysis
- Market Share Analysis, 2025
- By Pigment Class
- By Extraction Source
- By Purity Compendial Grade
- By Physical State
- By Sales Channel
- United Kingdom
- Pricing Analysis
- Market Share Analysis, 2025
- By Pigment Class
- By Extraction Source
- By Purity Compendial Grade
- By Physical State
- By Sales Channel
- Italy
- Pricing Analysis
- Market Share Analysis, 2025
- By Pigment Class
- By Extraction Source
- By Purity Compendial Grade
- By Physical State
- By Sales Channel
- Spain
- Pricing Analysis
- Market Share Analysis, 2025
- By Pigment Class
- By Extraction Source
- By Purity Compendial Grade
- By Physical State
- By Sales Channel
- France
- Pricing Analysis
- Market Share Analysis, 2025
- By Pigment Class
- By Extraction Source
- By Purity Compendial Grade
- By Physical State
- By Sales Channel
- India
- Pricing Analysis
- Market Share Analysis, 2025
- By Pigment Class
- By Extraction Source
- By Purity Compendial Grade
- By Physical State
- By Sales Channel
- ASEAN
- Pricing Analysis
- Market Share Analysis, 2025
- By Pigment Class
- By Extraction Source
- By Purity Compendial Grade
- By Physical State
- By Sales Channel
- Australia and New Zealand
- Pricing Analysis
- Market Share Analysis, 2025
- By Pigment Class
- By Extraction Source
- By Purity Compendial Grade
- By Physical State
- By Sales Channel
- China
- Pricing Analysis
- Market Share Analysis, 2025
- By Pigment Class
- By Extraction Source
- By Purity Compendial Grade
- By Physical State
- By Sales Channel
- Japan
- Pricing Analysis
- Market Share Analysis, 2025
- By Pigment Class
- By Extraction Source
- By Purity Compendial Grade
- By Physical State
- By Sales Channel
- South Korea
- Pricing Analysis
- Market Share Analysis, 2025
- By Pigment Class
- By Extraction Source
- By Purity Compendial Grade
- By Physical State
- By Sales Channel
- Poland
- Pricing Analysis
- Market Share Analysis, 2025
- By Pigment Class
- By Extraction Source
- By Purity Compendial Grade
- By Physical State
- By Sales Channel
- Hungary
- Pricing Analysis
- Market Share Analysis, 2025
- By Pigment Class
- By Extraction Source
- By Purity Compendial Grade
- By Physical State
- By Sales Channel
- Türkiye
- Pricing Analysis
- Market Share Analysis, 2025
- By Pigment Class
- By Extraction Source
- By Purity Compendial Grade
- By Physical State
- By Sales Channel
- South Africa
- Pricing Analysis
- Market Share Analysis, 2025
- By Pigment Class
- By Extraction Source
- By Purity Compendial Grade
- By Physical State
- By Sales Channel
- Switzerland
- Pricing Analysis
- Market Share Analysis, 2025
- By Pigment Class
- By Extraction Source
- By Purity Compendial Grade
- By Physical State
- By Sales Channel
- United States
- Market Structure Analysis
- Competition Dashboard
- Competition Benchmarking
- Market Share Analysis of Top Players
- By Regional
- By Pigment Class
- By Extraction Source
- By Purity Compendial Grade
- By Physical State
- By Sales Channel
- Emerging Startups
- Innovation Benchmarking
- Competition Analysis
- Competition Deep Dive
- AstraZeneca plc
- Overview
- Product Portfolio
- Profitability by Market Segments
- Sales Footprint
- Strategy Overview
- Marketing Strategy
- Product Strategy
- Channel Strategy
- Medtronic plc
- Boston Scientific Corporation
- Abbott Laboratories
- Thermo Fisher Scientific Inc.
- Danaher Corporation
- Roche Holding AG
- Merck and Co. Inc.
- Novartis AG
- Sanofi SA
- AstraZeneca plc
- Case Studies
- Success Stories
- Recent Developments
- Competition Deep Dive
- Assumptions & Acronyms Used
List of Tables
- Table 1: Global Market Value (USD Million) Forecast by Region, 2021 to 2036
- Table 2: Global Market Value (USD Million) Forecast by Pigment Class, 2021 to 2036
- Table 3: Global Market Value (USD Million) Forecast by Extraction Source, 2021 to 2036
- Table 4: Global Market Value (USD Million) Forecast by Purity Compendial Grade, 2021 to 2036
- Table 5: Global Market Value (USD Million) Forecast by Physical State, 2021 to 2036
- Table 6: Global Market Value (USD Million) Forecast by Sales Channel, 2021 to 2036
- Table 7: North America Market Value (USD Million) Forecast by Country, 2021 to 2036
- Table 8: North America Market Value (USD Million) Forecast by Pigment Class, 2021 to 2036
- Table 9: North America Market Value (USD Million) Forecast by Extraction Source, 2021 to 2036
- Table 10: North America Market Value (USD Million) Forecast by Purity Compendial Grade, 2021 to 2036
- Table 11: North America Market Value (USD Million) Forecast by Physical State, 2021 to 2036
- Table 12: North America Market Value (USD Million) Forecast by Sales Channel, 2021 to 2036
- Table 13: Latin America Market Value (USD Million) Forecast by Country, 2021 to 2036
- Table 14: Latin America Market Value (USD Million) Forecast by Pigment Class, 2021 to 2036
- Table 15: Latin America Market Value (USD Million) Forecast by Extraction Source, 2021 to 2036
- Table 16: Latin America Market Value (USD Million) Forecast by Purity Compendial Grade, 2021 to 2036
- Table 17: Latin America Market Value (USD Million) Forecast by Physical State, 2021 to 2036
- Table 18: Latin America Market Value (USD Million) Forecast by Sales Channel, 2021 to 2036
- Table 19: Western Europe Market Value (USD Million) Forecast by Country, 2021 to 2036
- Table 20: Western Europe Market Value (USD Million) Forecast by Pigment Class, 2021 to 2036
- Table 21: Western Europe Market Value (USD Million) Forecast by Extraction Source, 2021 to 2036
- Table 22: Western Europe Market Value (USD Million) Forecast by Purity Compendial Grade, 2021 to 2036
- Table 23: Western Europe Market Value (USD Million) Forecast by Physical State, 2021 to 2036
- Table 24: Western Europe Market Value (USD Million) Forecast by Sales Channel, 2021 to 2036
- Table 25: Eastern Europe Market Value (USD Million) Forecast by Country, 2021 to 2036
- Table 26: Eastern Europe Market Value (USD Million) Forecast by Pigment Class, 2021 to 2036
- Table 27: Eastern Europe Market Value (USD Million) Forecast by Extraction Source, 2021 to 2036
- Table 28: Eastern Europe Market Value (USD Million) Forecast by Purity Compendial Grade, 2021 to 2036
- Table 29: Eastern Europe Market Value (USD Million) Forecast by Physical State, 2021 to 2036
- Table 30: Eastern Europe Market Value (USD Million) Forecast by Sales Channel, 2021 to 2036
- Table 31: East Asia Market Value (USD Million) Forecast by Country, 2021 to 2036
- Table 32: East Asia Market Value (USD Million) Forecast by Pigment Class, 2021 to 2036
- Table 33: East Asia Market Value (USD Million) Forecast by Extraction Source, 2021 to 2036
- Table 34: East Asia Market Value (USD Million) Forecast by Purity Compendial Grade, 2021 to 2036
- Table 35: East Asia Market Value (USD Million) Forecast by Physical State, 2021 to 2036
- Table 36: East Asia Market Value (USD Million) Forecast by Sales Channel, 2021 to 2036
- Table 37: South Asia and Pacific Market Value (USD Million) Forecast by Country, 2021 to 2036
- Table 38: South Asia and Pacific Market Value (USD Million) Forecast by Pigment Class, 2021 to 2036
- Table 39: South Asia and Pacific Market Value (USD Million) Forecast by Extraction Source, 2021 to 2036
- Table 40: South Asia and Pacific Market Value (USD Million) Forecast by Purity Compendial Grade, 2021 to 2036
- Table 41: South Asia and Pacific Market Value (USD Million) Forecast by Physical State, 2021 to 2036
- Table 42: South Asia and Pacific Market Value (USD Million) Forecast by Sales Channel, 2021 to 2036
- Table 43: Middle East and Africa Market Value (USD Million) Forecast by Country, 2021 to 2036
- Table 44: Middle East and Africa Market Value (USD Million) Forecast by Pigment Class, 2021 to 2036
- Table 45: Middle East and Africa Market Value (USD Million) Forecast by Extraction Source, 2021 to 2036
- Table 46: Middle East and Africa Market Value (USD Million) Forecast by Purity Compendial Grade, 2021 to 2036
- Table 47: Middle East and Africa Market Value (USD Million) Forecast by Physical State, 2021 to 2036
- Table 48: Middle East and Africa Market Value (USD Million) Forecast by Sales Channel, 2021 to 2036
List of Figures
- Figure 1: Global Market Pricing Analysis
- Figure 2: Global Market Value (USD Million) Forecast 2021-2036
- Figure 3: Global Market Value Share and BPS Analysis by Pigment Class, 2026 and 2036
- Figure 4: Global Market Y-o-Y Growth Comparison by Pigment Class, 2026-2036
- Figure 5: Global Market Attractiveness Analysis by Pigment Class
- Figure 6: Global Market Value Share and BPS Analysis by Extraction Source, 2026 and 2036
- Figure 7: Global Market Y-o-Y Growth Comparison by Extraction Source, 2026-2036
- Figure 8: Global Market Attractiveness Analysis by Extraction Source
- Figure 9: Global Market Value Share and BPS Analysis by Purity Compendial Grade, 2026 and 2036
- Figure 10: Global Market Y-o-Y Growth Comparison by Purity Compendial Grade, 2026-2036
- Figure 11: Global Market Attractiveness Analysis by Purity Compendial Grade
- Figure 12: Global Market Value Share and BPS Analysis by Physical State, 2026 and 2036
- Figure 13: Global Market Y-o-Y Growth Comparison by Physical State, 2026-2036
- Figure 14: Global Market Attractiveness Analysis by Physical State
- Figure 15: Global Market Value Share and BPS Analysis by Sales Channel, 2026 and 2036
- Figure 16: Global Market Y-o-Y Growth Comparison by Sales Channel, 2026-2036
- Figure 17: Global Market Attractiveness Analysis by Sales Channel
- Figure 18: Global Market Value (USD Million) Share and BPS Analysis by Region, 2026 and 2036
- Figure 19: Global Market Y-o-Y Growth Comparison by Region, 2026-2036
- Figure 20: Global Market Attractiveness Analysis by Region
- Figure 21: North America Market Incremental Dollar Opportunity, 2026-2036
- Figure 22: Latin America Market Incremental Dollar Opportunity, 2026-2036
- Figure 23: Western Europe Market Incremental Dollar Opportunity, 2026-2036
- Figure 24: Eastern Europe Market Incremental Dollar Opportunity, 2026-2036
- Figure 25: East Asia Market Incremental Dollar Opportunity, 2026-2036
- Figure 26: South Asia and Pacific Market Incremental Dollar Opportunity, 2026-2036
- Figure 27: Middle East and Africa Market Incremental Dollar Opportunity, 2026-2036
- Figure 28: North America Market Value Share and BPS Analysis by Country, 2026 and 2036
- Figure 29: North America Market Value Share and BPS Analysis by Pigment Class, 2026 and 2036
- Figure 30: North America Market Y-o-Y Growth Comparison by Pigment Class, 2026-2036
- Figure 31: North America Market Attractiveness Analysis by Pigment Class
- Figure 32: North America Market Value Share and BPS Analysis by Extraction Source, 2026 and 2036
- Figure 33: North America Market Y-o-Y Growth Comparison by Extraction Source, 2026-2036
- Figure 34: North America Market Attractiveness Analysis by Extraction Source
- Figure 35: North America Market Value Share and BPS Analysis by Purity Compendial Grade, 2026 and 2036
- Figure 36: North America Market Y-o-Y Growth Comparison by Purity Compendial Grade, 2026-2036
- Figure 37: North America Market Attractiveness Analysis by Purity Compendial Grade
- Figure 38: North America Market Value Share and BPS Analysis by Physical State, 2026 and 2036
- Figure 39: North America Market Y-o-Y Growth Comparison by Physical State, 2026-2036
- Figure 40: North America Market Attractiveness Analysis by Physical State
- Figure 41: North America Market Value Share and BPS Analysis by Sales Channel, 2026 and 2036
- Figure 42: North America Market Y-o-Y Growth Comparison by Sales Channel, 2026-2036
- Figure 43: North America Market Attractiveness Analysis by Sales Channel
- Figure 44: Latin America Market Value Share and BPS Analysis by Country, 2026 and 2036
- Figure 45: Latin America Market Value Share and BPS Analysis by Pigment Class, 2026 and 2036
- Figure 46: Latin America Market Y-o-Y Growth Comparison by Pigment Class, 2026-2036
- Figure 47: Latin America Market Attractiveness Analysis by Pigment Class
- Figure 48: Latin America Market Value Share and BPS Analysis by Extraction Source, 2026 and 2036
- Figure 49: Latin America Market Y-o-Y Growth Comparison by Extraction Source, 2026-2036
- Figure 50: Latin America Market Attractiveness Analysis by Extraction Source
- Figure 51: Latin America Market Value Share and BPS Analysis by Purity Compendial Grade, 2026 and 2036
- Figure 52: Latin America Market Y-o-Y Growth Comparison by Purity Compendial Grade, 2026-2036
- Figure 53: Latin America Market Attractiveness Analysis by Purity Compendial Grade
- Figure 54: Latin America Market Value Share and BPS Analysis by Physical State, 2026 and 2036
- Figure 55: Latin America Market Y-o-Y Growth Comparison by Physical State, 2026-2036
- Figure 56: Latin America Market Attractiveness Analysis by Physical State
- Figure 57: Latin America Market Value Share and BPS Analysis by Sales Channel, 2026 and 2036
- Figure 58: Latin America Market Y-o-Y Growth Comparison by Sales Channel, 2026-2036
- Figure 59: Latin America Market Attractiveness Analysis by Sales Channel
- Figure 60: Western Europe Market Value Share and BPS Analysis by Country, 2026 and 2036
- Figure 61: Western Europe Market Value Share and BPS Analysis by Pigment Class, 2026 and 2036
- Figure 62: Western Europe Market Y-o-Y Growth Comparison by Pigment Class, 2026-2036
- Figure 63: Western Europe Market Attractiveness Analysis by Pigment Class
- Figure 64: Western Europe Market Value Share and BPS Analysis by Extraction Source, 2026 and 2036
- Figure 65: Western Europe Market Y-o-Y Growth Comparison by Extraction Source, 2026-2036
- Figure 66: Western Europe Market Attractiveness Analysis by Extraction Source
- Figure 67: Western Europe Market Value Share and BPS Analysis by Purity Compendial Grade, 2026 and 2036
- Figure 68: Western Europe Market Y-o-Y Growth Comparison by Purity Compendial Grade, 2026-2036
- Figure 69: Western Europe Market Attractiveness Analysis by Purity Compendial Grade
- Figure 70: Western Europe Market Value Share and BPS Analysis by Physical State, 2026 and 2036
- Figure 71: Western Europe Market Y-o-Y Growth Comparison by Physical State, 2026-2036
- Figure 72: Western Europe Market Attractiveness Analysis by Physical State
- Figure 73: Western Europe Market Value Share and BPS Analysis by Sales Channel, 2026 and 2036
- Figure 74: Western Europe Market Y-o-Y Growth Comparison by Sales Channel, 2026-2036
- Figure 75: Western Europe Market Attractiveness Analysis by Sales Channel
- Figure 76: Eastern Europe Market Value Share and BPS Analysis by Country, 2026 and 2036
- Figure 77: Eastern Europe Market Value Share and BPS Analysis by Pigment Class, 2026 and 2036
- Figure 78: Eastern Europe Market Y-o-Y Growth Comparison by Pigment Class, 2026-2036
- Figure 79: Eastern Europe Market Attractiveness Analysis by Pigment Class
- Figure 80: Eastern Europe Market Value Share and BPS Analysis by Extraction Source, 2026 and 2036
- Figure 81: Eastern Europe Market Y-o-Y Growth Comparison by Extraction Source, 2026-2036
- Figure 82: Eastern Europe Market Attractiveness Analysis by Extraction Source
- Figure 83: Eastern Europe Market Value Share and BPS Analysis by Purity Compendial Grade, 2026 and 2036
- Figure 84: Eastern Europe Market Y-o-Y Growth Comparison by Purity Compendial Grade, 2026-2036
- Figure 85: Eastern Europe Market Attractiveness Analysis by Purity Compendial Grade
- Figure 86: Eastern Europe Market Value Share and BPS Analysis by Physical State, 2026 and 2036
- Figure 87: Eastern Europe Market Y-o-Y Growth Comparison by Physical State, 2026-2036
- Figure 88: Eastern Europe Market Attractiveness Analysis by Physical State
- Figure 89: Eastern Europe Market Value Share and BPS Analysis by Sales Channel, 2026 and 2036
- Figure 90: Eastern Europe Market Y-o-Y Growth Comparison by Sales Channel, 2026-2036
- Figure 91: Eastern Europe Market Attractiveness Analysis by Sales Channel
- Figure 92: East Asia Market Value Share and BPS Analysis by Country, 2026 and 2036
- Figure 93: East Asia Market Value Share and BPS Analysis by Pigment Class, 2026 and 2036
- Figure 94: East Asia Market Y-o-Y Growth Comparison by Pigment Class, 2026-2036
- Figure 95: East Asia Market Attractiveness Analysis by Pigment Class
- Figure 96: East Asia Market Value Share and BPS Analysis by Extraction Source, 2026 and 2036
- Figure 97: East Asia Market Y-o-Y Growth Comparison by Extraction Source, 2026-2036
- Figure 98: East Asia Market Attractiveness Analysis by Extraction Source
- Figure 99: East Asia Market Value Share and BPS Analysis by Purity Compendial Grade, 2026 and 2036
- Figure 100: East Asia Market Y-o-Y Growth Comparison by Purity Compendial Grade, 2026-2036
- Figure 101: East Asia Market Attractiveness Analysis by Purity Compendial Grade
- Figure 102: East Asia Market Value Share and BPS Analysis by Physical State, 2026 and 2036
- Figure 103: East Asia Market Y-o-Y Growth Comparison by Physical State, 2026-2036
- Figure 104: East Asia Market Attractiveness Analysis by Physical State
- Figure 105: East Asia Market Value Share and BPS Analysis by Sales Channel, 2026 and 2036
- Figure 106: East Asia Market Y-o-Y Growth Comparison by Sales Channel, 2026-2036
- Figure 107: East Asia Market Attractiveness Analysis by Sales Channel
- Figure 108: South Asia and Pacific Market Value Share and BPS Analysis by Country, 2026 and 2036
- Figure 109: South Asia and Pacific Market Value Share and BPS Analysis by Pigment Class, 2026 and 2036
- Figure 110: South Asia and Pacific Market Y-o-Y Growth Comparison by Pigment Class, 2026-2036
- Figure 111: South Asia and Pacific Market Attractiveness Analysis by Pigment Class
- Figure 112: South Asia and Pacific Market Value Share and BPS Analysis by Extraction Source, 2026 and 2036
- Figure 113: South Asia and Pacific Market Y-o-Y Growth Comparison by Extraction Source, 2026-2036
- Figure 114: South Asia and Pacific Market Attractiveness Analysis by Extraction Source
- Figure 115: South Asia and Pacific Market Value Share and BPS Analysis by Purity Compendial Grade, 2026 and 2036
- Figure 116: South Asia and Pacific Market Y-o-Y Growth Comparison by Purity Compendial Grade, 2026-2036
- Figure 117: South Asia and Pacific Market Attractiveness Analysis by Purity Compendial Grade
- Figure 118: South Asia and Pacific Market Value Share and BPS Analysis by Physical State, 2026 and 2036
- Figure 119: South Asia and Pacific Market Y-o-Y Growth Comparison by Physical State, 2026-2036
- Figure 120: South Asia and Pacific Market Attractiveness Analysis by Physical State
- Figure 121: South Asia and Pacific Market Value Share and BPS Analysis by Sales Channel, 2026 and 2036
- Figure 122: South Asia and Pacific Market Y-o-Y Growth Comparison by Sales Channel, 2026-2036
- Figure 123: South Asia and Pacific Market Attractiveness Analysis by Sales Channel
- Figure 124: Middle East and Africa Market Value Share and BPS Analysis by Country, 2026 and 2036
- Figure 125: Middle East and Africa Market Value Share and BPS Analysis by Pigment Class, 2026 and 2036
- Figure 126: Middle East and Africa Market Y-o-Y Growth Comparison by Pigment Class, 2026-2036
- Figure 127: Middle East and Africa Market Attractiveness Analysis by Pigment Class
- Figure 128: Middle East and Africa Market Value Share and BPS Analysis by Extraction Source, 2026 and 2036
- Figure 129: Middle East and Africa Market Y-o-Y Growth Comparison by Extraction Source, 2026-2036
- Figure 130: Middle East and Africa Market Attractiveness Analysis by Extraction Source
- Figure 131: Middle East and Africa Market Value Share and BPS Analysis by Purity Compendial Grade, 2026 and 2036
- Figure 132: Middle East and Africa Market Y-o-Y Growth Comparison by Purity Compendial Grade, 2026-2036
- Figure 133: Middle East and Africa Market Attractiveness Analysis by Purity Compendial Grade
- Figure 134: Middle East and Africa Market Value Share and BPS Analysis by Physical State, 2026 and 2036
- Figure 135: Middle East and Africa Market Y-o-Y Growth Comparison by Physical State, 2026-2036
- Figure 136: Middle East and Africa Market Attractiveness Analysis by Physical State
- Figure 137: Middle East and Africa Market Value Share and BPS Analysis by Sales Channel, 2026 and 2036
- Figure 138: Middle East and Africa Market Y-o-Y Growth Comparison by Sales Channel, 2026-2036
- Figure 139: Middle East and Africa Market Attractiveness Analysis by Sales Channel
- Figure 140: Global Market - Tier Structure Analysis
- Figure 141: Global Market - Company Share Analysis
Frequently Asked Questions
How big is the phycobiliproteins market in 2026, and what is forecast for 2036?
FMI estimates that the global phycobiliproteins market size stood at USD 515.5 million in 2025 and reached USD 555.2 million in 2026. Overall industry valuation is on track to hit USD 1,209.8 million by 2036 as diagnostic labs and clean-label food brands replace synthetic dyes.
What is the CAGR for the phycobiliproteins market from 2026 to 2036?
The phycobiliproteins sector is projected to expand at an 8.1% CAGR over the 2026 to 2036 window, adding USD 654.6 million in net market value across diagnostic fluorophore and natural colorant channels.
Which pigment class segment leads the phycobiliproteins market?
C-Phycocyanin Blue Protein holds 54.0% of pigment class demand in 2026 because it is the primary FDA-exempt and EU-compliant natural blue food colorant and antioxidant protein.
Which extraction source segment leads the phycobiliproteins market?
Spirulina Arthrospira platensis Biomass represents 57.7% of the extraction source category in 2026 due to high cellular biliprotein density and scalable alkaline raceway cultivation.
Which country has a notable growth outlook during the assessment period?
The United States leads national expansion projections at an 8.4% CAGR through 2036, driven by synthetic food-dye phaseouts and high-parameter oncology flow cytometry.
Who are the key players in the market?
Thermo Fisher Scientific Inc. and Danaher Corporation with Abbott Laboratories and Roche Holding AG lead in diagnostic fluorophore conjugates and core lab analyzers. AstraZeneca plc and Merck and Co Inc with Novartis AG, Sanofi SA, Medtronic plc and Boston Scientific Corporation anchor clinical biomarker and medical systems.
Preview the report firsthand - request a free sample
Get SampleGet the brochure for pricing and purchase details.
Get PDF
