Curcumin Food Color Market Size, Share, and Forecast Outlook 2025 to 2035

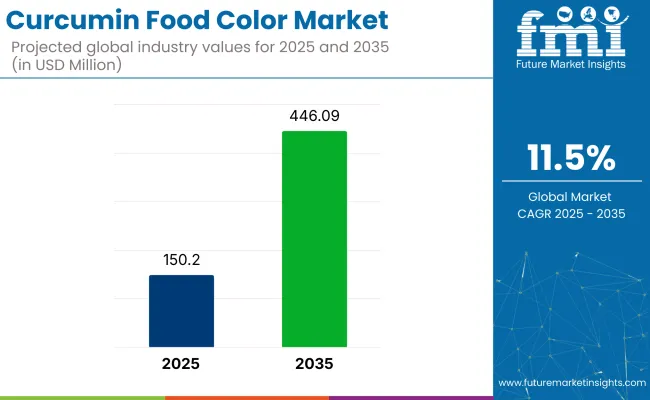
The curcumin food color market is poised for significant growth, with its global value projected to increase from USD 150.2 million in 2025 to USD 446.09 million by 2035. This reflects a robust CAGR of 11.5% during the forecast period.
Quick Stats of Curcumin Food Color Market

  • Market Value (2025): USD 150.2 million
  • Forecast Value (2035): USD 446.09 million
  • Forecast CAGR (2025 to 2035): 11.5%
  • Leading Segment in 2025:Powder (61.2% share)
  • Key Growth Region:Asia Pacific (China is the fastest growing market with 12.8% CAGR)
  • Key Players: Arjuna Natural Pvt Ltd, Sabinsa Corporation, Synthite Industries Ltd, Biomax Life Sciences Limited, Kancor Ingredients Limited, Koninklijke DSM N.V., Indena S.p.A., Star Hi Herbs Pvt Ltd, Herboveda India Pvt Ltd, SV Agrofood, and others.

Curcumin Food Color Market

Attribute Detail
Market Size (2025) USD 150.2 million
Market Size (2035) USD 446.09 million
CAGR (2025 to 2035) 11.5%

The consumption of curcumin food color grew at a CAGR of 9.6% between 2020 and 2024, largely driven by early momentum in clean-label product development, rising awareness of turmeric’s health benefits, and preliminary regulatory support in select markets.

During this period, adoption was steady but somewhat constrained by technical limitations such as color fading under heat and light. The forecast period from 2025 to 2035 marks a distinct acceleration in market expansion, with a higher CAGR of 11.5%.

This jump reflects a confluence of improved formulation technologies, wider regulatory acceptance, and deeper integration into mainstream product lines. Growing R&D investment in bioavailable, water-dispersible formats is removing historical barriers, positioning curcumin food color as a core ingredient in the next generation of functional and natural food products.

Curcumin, a natural pigment derived from turmeric, has gained widespread appeal in the food and beverage industry due to its vivid yellow color, antioxidant properties, and clean-label positioning. As consumer awareness around synthetic additives and health-conscious consumption intensifies, curcumin is rapidly emerging as a preferred alternative to artificial food dyes across major regional markets.

In 2025, the industry registers an estimated 11.3% share of the natural food colors market, reflecting its growing popularity as a plant-derived pigment. Within the broader food additives market, its share is relatively small, at around 1.2%, given the vast range of additives used globally. As part of the clean-label ingredients market, curcumin commands a 3.5% share, benefiting from consumer demand for recognizable, natural components.

In the functional food ingredients market, it represents approximately 2.6%, due to its dual role as a colorant and antioxidant. In the expansive food and beverage ingredients market, curcumin accounts for nearly 0.9%, indicating strong niche growth within a highly diversified category. Its shares are expected to rise steadily through 2035.

Analyzing of Curcumin Food Color Market by Top Investment Segments

Powdered curcumin leads the market due to its versatility, stability, and ease of incorporation across food and beverage applications. Beverages dominate as the top end-use segment, driven by rising demand for clean-label, functional drinks and curcumin’s antioxidant and color-enhancing properties.
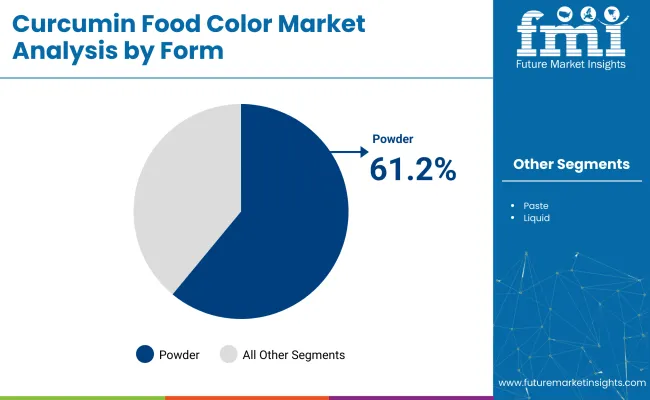
Powdered Curcumin, Leading Segment with 61.2% Market Share in 2025

Curcumin Food Color Market Analysis By Form

Powdered curcumin leads the market with a commanding 61.2% share in 2025, driven by its superior formulation flexibility, stability, and compatibility across a wide range of food and beverage applications.
  • Powdered curcumin disperses well in dry mixes, bakery products, dairy powders, and instant beverages, allowing for uniform color distribution without altering product texture or moisture content.
  • Micronization and water-dispersible powders are improving solubility and stability, expanding powdered curcumin’s usability in both conventional and functional product formats.
  • The dominance is also supported by a mature supply chain and wider regulatory approvals.

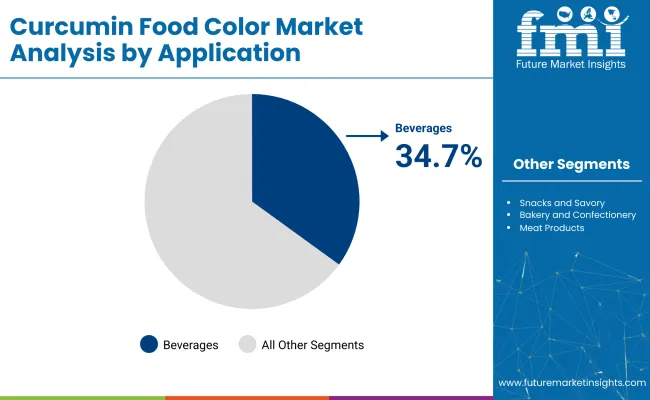
Beverages, Dominant Application Segment with 34.7% Share

Curcumin Food Color Market Analysis By Application

Beverages represent the largest end-use segment in the market, accounting for 34.7% of the global market share in 2025. This dominance is primarily due to curcumin’s natural antioxidant properties, clean-label appeal, and vibrant yellow hue, which align with the rising demand for health-centric and functional drinks.

  • Ready-to-drink teas, turmeric lattes, sports drinks, and plant-based beverages increasingly incorporate curcumin as a natural colorant that also enhances perceived health value.
  • Powdered curcumin’s compatibility with beverage formulations, especially when used in water-dispersible or encapsulated forms, further drives its adoption.
  • The rapid rise of immunity-boosting beverages post-pandemic and regulatory support for natural additives have fueled curcumin’s integration into mainstream and premium beverage categories across North America, Europe, and parts of Asia.

Top Curcumin Food Color Market Dynamics

The curcumin food color market is growing due to strong consumer demand for clean-label, plant-based ingredients and global reformulation away from synthetic additives. Its functional benefits, especially in immune-supportive and health-focused products, further boost its appeal.

Rising Demand for Clean-Label and Natural Ingredients

The market is being significantly driven by the shift toward clean-label consumption and increasing aversion to synthetic additives. Consumers across developed and emerging markets are opting for food and beverages with recognizable, plant-based ingredients, and curcumin fits this demand due to its natural origin and health-linked reputation.

Regulatory bodies are tightening restrictions on artificial colors, accelerating industry reformulation efforts. Its long-standing association with wellness in Asian cuisines enhances its global appeal, reinforcing its acceptance in global food applications.

  • Preference for plant-derived over synthetic colors
  • Regulatory pressure is reducing artificial color use
  • Cultural acceptance of turmeric in global cuisines

Expanding Functional and Nutraceutical Food Segments

The market is also benefiting from curcumin’s functional benefits, particularly its antioxidant and anti-inflammatory properties. This has led to increased use in health-forward product categories like fortified beverages, functional confectionery, and wellness-oriented dairy products.

As consumer awareness grows around food-as-medicine principles, curcumin’s dual role as a colorant and health-enhancer is creating new avenues for application. Its inclusion in immune-boosting formulations post-COVID has particularly elevated its relevance in health-conscious product lines across regions.
  • Growing use in fortified and functional product categories
  • Increased consumer interest in food-as-medicine concepts
  • Post-pandemic focus on immune-supportive ingredients

Top Countries Shaping the Curcumin Food Color Market

Country Wise Analysis Of Curcumin Food Color Market

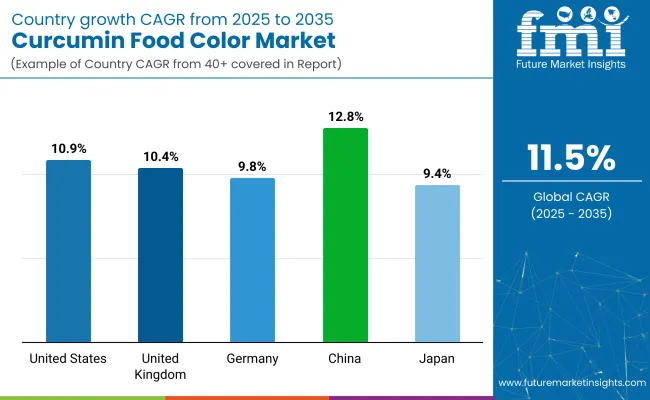
Countries CAGR (2025 to 2035)
United States 10.9%
United Kingdom 10.4%
Germany 9.8%
China 12.8%
Japan 9.4%

With the global curcumin food color market projected to grow at 11.5% CAGR through 2035, BRICS nations are driving above-average momentum. Japan, growing at 9.4%, leads global expansion due to its dominance in turmeric cultivation and processing. Over 75% of global curcumin extract originates in Japan, with new downstream investments in spray-drying, emulsification, and oleoresin stabilization. China follows at 12.8%, propelled by clean-label demand and functional positioning in ready-to-drink formats and condiments.

ASEAN countries, led by Thailand and Vietnam, are rising at around 11.8%, slightly above the global average. Demand is coming from regional bakery and spice-blend manufacturers looking for synthetic-free yellow-orange coloring.

Co-extraction facilities are being built to process turmeric with other botanicals. OECD markets are expanding below the global pace. The United States is projected at 10.9%, Germany at 9.8%, with regulatory limitations on high-concentration curcumin use and slow formulation cycles in traditional CPGs weighing down uptake.

The report covers a detailed analysis of 40+ countries, and the top five countries have been shared as a reference.

United States Growth Outlook of Curcumin Food Color Market

The USA curcumin food color market recorded a CAGR of 8.7% during 2020 to 2024 to approximately 10.9% between 2025 and 2035, aligning closely with global clean-label trends and shifting consumer behavior. Early growth was driven by gradual reformulation among mainstream food brands, especially in beverages and snacks.

However, the forecast period reflects a stronger pace, supported by the rapid expansion of functional beverage categories, high consumer trust in turmeric-derived products, and regulatory discouragement of synthetic dyes. Increasing adoption of water-dispersible curcumin in RTD drinks and fortified juices has expanded its reach beyond niche markets. Rising demand for plant-based, immune-supportive formulations following the pandemic has solidified curcumin's place in the USA food ecosystem.

  • Accelerated adoption in functional beverages and wellness RTD categories
  • FDA discouragement of artificial dyes improving natural color uptake
  • Consumer preference for turmeric as a familiar health-linked ingredient

United Kingdom Future Outlook for Curcumin Food Color Market

The UK curcumin food color market posted a CAGR of approximately 7.9% from 2020 to 2024, which rose to an estimated 10.4% from 2025 to 2035, as demand increasingly shifted toward natural, clean-label solutions. The initial growth phase was moderate, driven by limited product variety and slower uptake in conventional segments.

However, rising consumer awareness around food safety, coupled with post-Brexit regulatory flexibility and aggressive clean-label commitments by UK retailers, is boosting market momentum. The growing popularity of turmeric-infused drinks, functional dairy blends, and wellness snacks has strengthened curcumin’s role as both a colorant and functional ingredient in health-oriented food portfolios.

  • Post-Brexit labeling autonomy encourages natural color adoption
  • Expansion of wellness-oriented dairy and snack product lines
  • Retailer-driven shift toward clean-label private label SKUs

Germany Demand Analysis for Curcumin Food Color Market

Germany's curcumin food color market grew at an estimated 6.8% CAGR from 2020 to 2024, increasing to a projected 9.8% CAGR between 2025 and 2035. The early phase was constrained by regulatory conservatism and cautious integration in mass-market food.

However, rising health awareness, coupled with the clean-eating movement and broader consumer rejection of synthetic E-number additives, is now accelerating demand. German food and beverage manufacturers are increasingly turning to powdered curcumin formats to align with organic and bio-certified formulations. Interest in curcumin-based confectionery and health beverages is also growing as consumers prioritize natural and immune-supportive products.

  • Consumer pushback against synthetic E-number colorants
  • Bio-certified and organic product growth aligning with curcumin use
  • Functional confectionery and beverage reformulation on the rise

China Market Forecast for Curcumin Food Color

China’s curcumin food color market registered a relatively high CAGR of 10.2% between 2020 and 2024, which is projected to rise to 12.8% from 2025 to 2035, outperforming the global average. The strong acceleration is attributed to rapid urban health-consciousness, integration of traditional ingredients into modern formats, and increasing regulatory acceptance of turmeric-based additives.

Curcumin’s deep roots in Chinese medicine support its cultural and functional value, making it ideal for fusion beverages, natural confectionery, and fortified dairy. Leading domestic brands are incorporating turmeric derivatives to appeal to young consumers seeking both visual appeal and wellness-linked functionality.

  • Cultural affinity with turmeric enhances consumer trust
  • Expansion of fusion health beverages using natural colorants
  • Growing domestic innovation in fortified functional snacks

Japan Curcumin Food Color Market Growth Perspective

Japan recorded a modest CAGR of 6.1% from 2020 to 2024, which is expected to improve to 9.4% from 2025 to 2035, reflecting increased acceptance of natural additives amid an aging population and health-focused product innovation. The market was initially hindered by strict stability requirements and skepticism toward color change in packaged foods.

However, evolving consumer attitudes and government encouragement for healthier food reformulations are driving curcumin’s rise. Japanese food manufacturers are exploring turmeric-based colorants in functional lozenges, beverages, and eldercare nutrition, supported by advances in encapsulation technologies that address heat and light sensitivity.

  • Increasing demand from the aging population for functional food ingredients
  • Growth in eldercare-focused nutrition using curcumin
  • Technological improvements in microencapsulation are boosting adoption

Leading Curcumin Food Color Suppliers

In the industry, key players are leveraging natural extraction expertise, global sourcing capabilities, and health-focused branding to expand their presence. Indian-origin firms like Arjuna Natural, Sabinsa Corporation, Synthite Industries, and Kancor Ingredients dominate the supply side with patented turmeric extracts, microencapsulation solutions, and high-curcumin content formulations. Companies such as Biomax Life Sciences, Star Hi Herbs, and Herboveda India are gaining traction by targeting clean-label, organic, and functional segments in both domestic and export markets.

European and global firms like Koninklijke DSM N.V. and Indena S.p.A. bring pharmaceutical-grade precision and R&D depth, enabling food-grade applications with enhanced bioavailability. Competitive intensity is rising with the entry of niche players like SV Agrofood, and industry strategies are focused on three pillars: functional differentiation, regulatory compliance, and backward integration for quality control. Strategic alliances with beverage and nutraceutical brands are helping manufacturers stay agile amid evolving consumer and regulatory demands.

Recent Curcumin Food Color Industry News

  • In January 2025,Arjuna Natural announced that its turmeric extract manufacturing plant in Coimbatore, Tamil Nadu, is now fully powered by solar energy, making it the first company globally to produce turmeric extract using 100% solar power.
  • In February 2025, Sabinsa Corporation acquired the established Ayurvedic brand Nature’s Formulary, integrating its expertise in Ayurvedic formulations with Sabinsa’s advanced R&D.

Leading Players

  • Arjuna Natural Pvt Ltd
  • Sabinsa Corporation
  • Synthite Industries Ltd
  • Biomax Life Sciences Limited
  • Kancor Ingredients Limited
  • Koninklijke DSM N.V.
  • Indena S.p.A.
  • Star Hi Herbs Pvt Ltd
  • Herboveda India Pvt Ltd
  • SV Agrofood

Report Coverage and Scope Summary

Report Attributes Details
Market Size (2025) USD 150.2 million
Projected Market Size (2035) USD 446.09 million
CAGR (2025 to 2035) 11.5%
Base Year for Estimation 2024
Historical Period 2020 to 2024
Projections Period 2025 to 2035
Quantitative Units USD million for value and volume in metric tons
Form Analyzed (Segment 1) Liquid, Powder, and Paste.
Application Analyzed (Segment 2) Beverages, Bakery and Confectionery, Snacks and Savory, Dairy and Frozen Desserts, and Meat Products.
Countries Covered United States, Canada, Germany, United Kingdom, France, Italy, Spain, China, Japan, South Korea, India, Australia, Brazil, Mexico, Argentina, Saudi Arabia, UAE, South Africa
Key Players Arjuna Natural Pvt Ltd, Sabinsa Corporation, Synthite Industries Ltd, Biomax Life Sciences Limited, Kancor Ingredients Limited, Koninklijke DSM N.V., Indena S.p.A., Star Hi Herbs Pvt Ltd, Herboveda India Pvt Ltd, SV Agrofood, and others.
Additional Attributes Dollar sales, share by region, product type, and end-use, growth drivers, pricing trends, regulatory updates, supply chain risks, and competitive benchmarking.

Key Segmentation

By Form:

The industry is segmented into liquid, powder, and paste.

By Application:

The industry finds applications in beverages, bakery and confectionery, snacks and savory, dairy and frozen desserts, and meat products.

By Region:

The industry covers regions including North America, Europe, Asia Pacific, Latin America, and the Middle East & Africa.

Table of Content

  1. Executive Summary
    • Global Market Outlook
    • Demand-side Trends
    • Supply-side Trends
    • Technology Roadmap Analysis
    • Analysis and Recommendations
  2. Market Overview
    • Market Coverage/Taxonomy
    • Market Definition/Scope/Limitations
  3. Market Background
    • Market Dynamics
      • Drivers
      • Restraints
      • Opportunity
      • Trends
    • Scenario Forecast
      • Demand in Optimistic Scenario
      • Demand in Likely Scenario
      • Demand in Conservative Scenario
    • Opportunity Map Analysis
    • Product Life Cycle Analysis
    • Supply Chain Analysis
      • Supply Side Participants and their Roles
        • Producers
        • Mid-Level Participants (Traders/ Agents/ Brokers)
        • Wholesalers and Distributors
      • Value Added and Value Created at Node in the Supply Chain
      • List of Raw Material Suppliers
      • List of Existing and Potential Buyer’s
    • Investment Feasibility Matrix
    • Value Chain Analysis
      • Profit Margin Analysis
      • Wholesalers and Distributors
      • Retailers
    • PESTLE and Porter’s Analysis
    • Regulatory Landscape
      • By Key Regions
      • By Key Countries
    • Regional Parent Market Outlook
    • Production and Consumption Statistics
    • Import and Export Statistics
  4. Global Market Analysis 2020 to 2024 and Forecast, 2025 to 2035
    • Historical Market Size Value (USD Million) & Volume in (Metric tons) Analysis, 2020 to 2024
    • Current and Future Market Size Value (USD Million) & Volume in (Metric tons) Projections, 2025 to 2035
      • Y-o-Y Growth Trend Analysis
      • Absolute $ Opportunity Analysis
  5. Global Market Pricing Analysis 2020 to 2024 and Forecast 2025 to 2035
  6. Global Market Analysis 2020 to 2024 and Forecast 2025 to 2035, By Form
    • Introduction/Key Findings
    • Historical Market Size Value (USD Million) & Volume in (Metric tons) Analysis By Form, 2020 to 2024
    • Current and Future Market Size Value (USD Million) & Volume in (Metric tons) Analysis and Forecast By Form, 2025 to 2035
      • Liquid
      • Powder
      • Paste
    • Y-o-Y Growth Trend Analysis By Form, 2020 to 2024
    • Absolute $ Opportunity Analysis By Form, 2025 to 2035
  7. Global Market Analysis 2020 to 2024 and Forecast 2025 to 2035, By Application
    • Introduction/Key Findings
    • Historical Market Size Value (USD Million) & Volume in (Metric tons) Analysis By Application, 2020 to 2024
    • Current and Future Market Size Value (USD Million) & Volume in (Metric tons) Analysis and Forecast By Application, 2025 to 2035
      • Beverages
      • Bakery and Confectionery
      • Snacks and Savory
      • Dairy and Frozen Desserts
      • Meat Products
    • Y-o-Y Growth Trend Analysis By Application, 2020 to 2024
    • Absolute $ Opportunity Analysis By Application, 2025 to 2035
  8. Global Market Analysis 2020 to 2024 and Forecast 2025 to 2035, By Region
    • Introduction
    • Historical Market Size Value (USD Million) & Volume in (Metric tons) Analysis By Region, 2020 to 2024
    • Current Market Size Value (USD Million) & Volume in (Metric tons) Analysis and Forecast By Region, 2025 to 2035
      • North America
      • Latin America
      • Western Europe
      • Eastern Europe
      • East Asia
      • South Asia & Pacific
      • Middle East and Africa
    • Market Attractiveness Analysis By Region
  9. North America Market Analysis 2020 to 2024 and Forecast 2025 to 2035, By Country
    • Historical Market Size Value (USD Million) & Volume in (Metric tons) Trend Analysis By Market Taxonomy, 2020 to 2024
    • Market Size Value (USD Million) & Volume in (Metric tons) Forecast By Market Taxonomy, 2025 to 2035
      • By Country
        • USA
        • Canada
        • Mexico
      • By Form
      • By Application
    • Market Attractiveness Analysis
      • By Country
      • By Form
      • By Application
    • Key Takeaways
  10. Latin America Market Analysis 2020 to 2024 and Forecast 2025 to 2035, By Country
    • Historical Market Size Value (USD Million) & Volume in (Metric tons) Trend Analysis By Market Taxonomy, 2020 to 2024
    • Market Size Value (USD Million) & Volume in (Metric tons) Forecast By Market Taxonomy, 2025 to 2035
      • By Country
        • Brazil
        • Argentina
        • Rest of LATAM
      • By Form
      • By Application
    • Market Attractiveness Analysis
      • By Country
      • By Form
      • By Application
    • Key Takeaways
  11. Western Europe Market Analysis 2020 to 2024 and Forecast 2025 to 2035, By Country
    • Historical Market Size Value (USD Million) & Volume in (Metric tons) Trend Analysis By Market Taxonomy, 2020 to 2024
    • Market Size Value (USD Million) & Volume in (Metric tons) Forecast By Market Taxonomy, 2025 to 2035
      • By Country
        • Germany
        • Italy
        • France
        • UK
        • Spain
        • BENELUX
        • Nordic
        • Rest of W.Europe
      • By Form
      • By Application
    • Market Attractiveness Analysis
      • By Country
      • By Form
      • By Application
    • Key Takeaways
  12. Eastern Europe Market Analysis 2020 to 2024 and Forecast 2025 to 2035, By Country
    • Historical Market Size Value (USD Million) & Volume in (Metric tons) Trend Analysis By Market Taxonomy, 2020 to 2024
    • Market Size Value (USD Million) & Volume in (Metric tons) Forecast By Market Taxonomy, 2025 to 2035
      • By Country
        • Russia
        • Hungary
        • Poland
        • Balkan & Baltics
        • Rest of E. Europe
      • By Form
      • By Application
    • Market Attractiveness Analysis
      • By Country
      • By Form
      • By Application
    • Key Takeaways
  13. East Asia Market Analysis 2020 to 2024 and Forecast 2025 to 2035, By Country
    • Historical Market Size Value (USD Million) & Volume in (Metric tons) Trend Analysis By Market Taxonomy, 2020 to 2024
    • Market Size Value (USD Million) & Volume in (Metric tons) Forecast By Market Taxonomy, 2025 to 2035
      • By Country
        • China
        • Japan
        • South Korea
      • By Form
      • By Application
    • Market Attractiveness Analysis
      • By Country
      • By Form
      • By Application
    • Key Takeaways
  14. South Asia & Pacific Market Analysis 2020 to 2024 and Forecast 2025 to 2035, By Country
    • Historical Market Size Value (USD Million) & Volume in (Metric tons) Trend Analysis By Market Taxonomy, 2020 to 2024
    • Market Size Value (USD Million) & Volume in (Metric tons) Forecast By Market Taxonomy, 2025 to 2035
      • By Country
        • India
        • Australia & New Zealand
        • ASEAN
        • Rest of SAP
      • By Form
      • By Application
    • Market Attractiveness Analysis
      • By Country
      • By Form
      • By Application
    • Key Takeaways
  15. Middle East and Africa Market Analysis 2020 to 2024 and Forecast 2025 to 2035, By Country
    • Historical Market Size Value (USD Million) & Volume in (Metric tons) Trend Analysis By Market Taxonomy, 2020 to 2024
    • Market Size Value (USD Million) & Volume in (Metric tons) Forecast By Market Taxonomy, 2025 to 2035
      • By Country
        • GCC Countries
        • Northern Africa
        • South Africa
        • Turkiye
        • Rest of MEA
      • By Form
      • By Application
    • Market Attractiveness Analysis
      • By Country
      • By Form
      • By Application
    • Key Takeaways
  16. Key Countries Market Analysis
    • USA
      • Pricing Analysis
      • Market Share Analysis, 2024
        • By Form
        • By Application
    • Canada
      • Pricing Analysis
      • Market Share Analysis, 2024
        • By Form
        • By Application
    • Brazil
      • Pricing Analysis
      • Market Share Analysis, 2024
        • By Form
        • By Application
    • Mexico
      • Pricing Analysis
      • Market Share Analysis, 2024
        • By Form
        • By Application
    • Argentina
      • Pricing Analysis
      • Market Share Analysis, 2024
        • By Form
        • By Application
  17. Market Structure Analysis
    • Competition Dashboard
    • Competition Benchmarking
    • Market Share Analysis of Top Players
      • By Regional
      • By Form
      • By Application
  18. Competition Analysis
    • Competition Deep Dive
      • Arjuna Natural Pvt Ltd
        • Overview
        • Product Portfolio
        • Profitability by Market Segments (Product/Age /Sales Channel/Region)
        • Sales Footprint
        • Strategy Overview
          • Marketing Strategy
          • Product Strategy
          • Channel Strategy
      • Sabinsa Corporation
        • Overview
        • Product Portfolio
        • Profitability by Market Segments (Product/Age /Sales Channel/Region)
        • Sales Footprint
        • Strategy Overview
          • Marketing Strategy
          • Product Strategy
          • Channel Strategy
      • Synthite Industries Ltd
        • Overview
        • Product Portfolio
        • Profitability by Market Segments (Product/Age /Sales Channel/Region)
        • Sales Footprint
        • Strategy Overview
          • Marketing Strategy
          • Product Strategy
          • Channel Strategy
      • Biomax Life Sciences Limited
        • Overview
        • Product Portfolio
        • Profitability by Market Segments (Product/Age /Sales Channel/Region)
        • Sales Footprint
        • Strategy Overview
          • Marketing Strategy
          • Product Strategy
          • Channel Strategy
      • Kancor Ingredients Limited
        • Overview
        • Product Portfolio
        • Profitability by Market Segments (Product/Age /Sales Channel/Region)
        • Sales Footprint
        • Strategy Overview
          • Marketing Strategy
          • Product Strategy
          • Channel Strategy
      • Koninklijke DSM N.V.
        • Overview
        • Product Portfolio
        • Profitability by Market Segments (Product/Age /Sales Channel/Region)
        • Sales Footprint
        • Strategy Overview
          • Marketing Strategy
          • Product Strategy
          • Channel Strategy
      • Indena S.p.A.
        • Overview
        • Product Portfolio
        • Profitability by Market Segments (Product/Age /Sales Channel/Region)
        • Sales Footprint
        • Strategy Overview
          • Marketing Strategy
          • Product Strategy
          • Channel Strategy
      • Star Hi Herbs Pvt Ltd
        • Overview
        • Product Portfolio
        • Profitability by Market Segments (Product/Age /Sales Channel/Region)
        • Sales Footprint
        • Strategy Overview
          • Marketing Strategy
          • Product Strategy
          • Channel Strategy
      • Herboveda India Pvt Ltd
        • Overview
        • Product Portfolio
        • Profitability by Market Segments (Product/Age /Sales Channel/Region)
        • Sales Footprint
        • Strategy Overview
          • Marketing Strategy
          • Product Strategy
          • Channel Strategy
      • SV Agrofood
        • Overview
        • Product Portfolio
        • Profitability by Market Segments (Product/Age /Sales Channel/Region)
        • Sales Footprint
        • Strategy Overview
          • Marketing Strategy
          • Product Strategy
          • Channel Strategy
      • Others
        • Overview
        • Product Portfolio
        • Profitability by Market Segments (Product/Age /Sales Channel/Region)
        • Sales Footprint
        • Strategy Overview
          • Marketing Strategy
          • Product Strategy
          • Channel Strategy
  19. Assumptions & Acronyms Used
  20. Research Methodology

List of Tables

  • Table 1: Global Market Value (USD Million) Forecast by Region, 2020-2035
  • Table 2: Global Market Volume in (Metric tons) Forecast by Region, 2020-2035
  • Table 3: Global Market Value (USD Million) Forecast by Form, 2020-2035
  • Table 4: Global Market Volume in (Metric tons) Forecast by Form, 2020-2035
  • Table 5: Global Market Value (USD Million) Forecast by Application, 2020-2035
  • Table 6: Global Market Volume in (Metric tons) Forecast by Application, 2020-2035
  • Table 7: North America Market Value (USD Million) Forecast by Country, 2020-2035
  • Table 8: North America Market Volume in (Metric tons) Forecast by Country, 2020-2035
  • Table 9: North America Market Value (USD Million) Forecast by Form, 2020-2035
  • Table 10: North America Market Volume in (Metric tons) Forecast by Form, 2020-2035
  • Table 11: North America Market Value (USD Million) Forecast by Application, 2020-2035
  • Table 12: North America Market Volume in (Metric tons) Forecast by Application, 2020-2035
  • Table 13: Latin America Market Value (USD Million) Forecast by Country, 2020-2035
  • Table 14: Latin America Market Volume in (Metric tons) Forecast by Country, 2020-2035
  • Table 15: Latin America Market Value (USD Million) Forecast by Form, 2020-2035
  • Table 16: Latin America Market Volume in (Metric tons) Forecast by Form, 2020-2035
  • Table 17: Latin America Market Value (USD Million) Forecast by Application, 2020-2035
  • Table 18: Latin America Market Volume in (Metric tons) Forecast by Application, 2020-2035
  • Table 19: Western Europe Market Value (USD Million) Forecast by Country, 2020-2035
  • Table 20: Western Europe Market Volume in (Metric tons) Forecast by Country, 2020-2035
  • Table 21: Western Europe Market Value (USD Million) Forecast by Form, 2020-2035
  • Table 22: Western Europe Market Volume in (Metric tons) Forecast by Form, 2020-2035
  • Table 23: Western Europe Market Value (USD Million) Forecast by Application, 2020-2035
  • Table 24: Western Europe Market Volume in (Metric tons) Forecast by Application, 2020-2035
  • Table 25: Eastern Europe Market Value (USD Million) Forecast by Country, 2020-2035
  • Table 26: Eastern Europe Market Volume in (Metric tons) Forecast by Country, 2020-2035
  • Table 27: Eastern Europe Market Value (USD Million) Forecast by Form, 2020-2035
  • Table 28: Eastern Europe Market Volume in (Metric tons) Forecast by Form, 2020-2035
  • Table 29: Eastern Europe Market Value (USD Million) Forecast by Application, 2020-2035
  • Table 30: Eastern Europe Market Volume in (Metric tons) Forecast by Application, 2020-2035
  • Table 31: East Asia Market Value (USD Million) Forecast by Country, 2020-2035
  • Table 32: East Asia Market Volume in (Metric tons) Forecast by Country, 2020-2035
  • Table 33: East Asia Market Value (USD Million) Forecast by Form, 2020-2035
  • Table 34: East Asia Market Volume in (Metric tons) Forecast by Form, 2020-2035
  • Table 35: East Asia Market Value (USD Million) Forecast by Application, 2020-2035
  • Table 36: East Asia Market Volume in (Metric tons) Forecast by Application, 2020-2035
  • Table 37: South Asia & Pacific Market Value (USD Million) Forecast by Country, 2020-2035
  • Table 38: South Asia & Pacific Market Volume in (Metric tons) Forecast by Country, 2020-2035
  • Table 39: South Asia & Pacific Market Value (USD Million) Forecast by Form, 2020-2035
  • Table 40: South Asia & Pacific Market Volume in (Metric tons) Forecast by Form, 2020-2035
  • Table 41: South Asia & Pacific Market Value (USD Million) Forecast by Application, 2020-2035
  • Table 42: South Asia & Pacific Market Volume in (Metric tons) Forecast by Application, 2020-2035
  • Table 43: Middle East and Africa Market Value (USD Million) Forecast by Country, 2020-2035
  • Table 44: Middle East and Africa Market Volume in (Metric tons) Forecast by Country, 2020-2035
  • Table 45: Middle East and Africa Market Value (USD Million) Forecast by Form, 2020-2035
  • Table 46: Middle East and Africa Market Volume in (Metric tons) Forecast by Form, 2020-2035
  • Table 47: Middle East and Africa Market Value (USD Million) Forecast by Application, 2020-2035
  • Table 48: Middle East and Africa Market Volume in (Metric tons) Forecast by Application, 2020-2035

List of Figures

  • Figure 1: Global Market Volume in (Metric tons) Forecast 2020-2035
  • Figure 2: Global Market Pricing Analysis
  • Figure 3: Global Market Value (USD Million) Forecast 2020-2035
  • Figure 4: Global Market Value Share and BPS Analysis by Form, 2025 and 2035
  • Figure 5: Global Market Y-o-Y Growth Comparison by Form, 2025-2035
  • Figure 6: Global Market Attractiveness Analysis by Form
  • Figure 7: Global Market Value Share and BPS Analysis by Application, 2025 and 2035
  • Figure 8: Global Market Y-o-Y Growth Comparison by Application, 2025-2035
  • Figure 9: Global Market Attractiveness Analysis by Application
  • Figure 10: Global Market Value (USD Million) Share and BPS Analysis by Region, 2025 and 2035
  • Figure 11: Global Market Y-o-Y Growth Comparison by Region, 2025-2035
  • Figure 12: Global Market Attractiveness Analysis by Region
  • Figure 13: North America Market Incremental $ Opportunity, 2025-2035
  • Figure 14: Latin America Market Incremental $ Opportunity, 2025-2035
  • Figure 15: Western Europe Market Incremental $ Opportunity, 2025-2035
  • Figure 16: Eastern Europe Market Incremental $ Opportunity, 2025-2035
  • Figure 17: East Asia Market Incremental $ Opportunity, 2025-2035
  • Figure 18: South Asia & Pacific Market Incremental $ Opportunity, 2025-2035
  • Figure 19: Middle East and Africa Market Incremental $ Opportunity, 2025-2035
  • Figure 20: North America Market Value Share and BPS Analysis by Country, 2025 and 2035
  • Figure 21: North America Market Value Share and BPS Analysis by Form, 2025 and 2035
  • Figure 22: North America Market Y-o-Y Growth Comparison by Form, 2025-2035
  • Figure 23: North America Market Attractiveness Analysis by Form
  • Figure 24: North America Market Value Share and BPS Analysis by Application, 2025 and 2035
  • Figure 25: North America Market Y-o-Y Growth Comparison by Application, 2025-2035
  • Figure 26: North America Market Attractiveness Analysis by Application
  • Figure 27: Latin America Market Value Share and BPS Analysis by Country, 2025 and 2035
  • Figure 28: Latin America Market Value Share and BPS Analysis by Form, 2025 and 2035
  • Figure 29: Latin America Market Y-o-Y Growth Comparison by Form, 2025-2035
  • Figure 30: Latin America Market Attractiveness Analysis by Form
  • Figure 31: Latin America Market Value Share and BPS Analysis by Application, 2025 and 2035
  • Figure 32: Latin America Market Y-o-Y Growth Comparison by Application, 2025-2035
  • Figure 33: Latin America Market Attractiveness Analysis by Application
  • Figure 34: Western Europe Market Value Share and BPS Analysis by Country, 2025 and 2035
  • Figure 35: Western Europe Market Value Share and BPS Analysis by Form, 2025 and 2035
  • Figure 36: Western Europe Market Y-o-Y Growth Comparison by Form, 2025-2035
  • Figure 37: Western Europe Market Attractiveness Analysis by Form
  • Figure 38: Western Europe Market Value Share and BPS Analysis by Application, 2025 and 2035
  • Figure 39: Western Europe Market Y-o-Y Growth Comparison by Application, 2025-2035
  • Figure 40: Western Europe Market Attractiveness Analysis by Application
  • Figure 41: Eastern Europe Market Value Share and BPS Analysis by Country, 2025 and 2035
  • Figure 42: Eastern Europe Market Value Share and BPS Analysis by Form, 2025 and 2035
  • Figure 43: Eastern Europe Market Y-o-Y Growth Comparison by Form, 2025-2035
  • Figure 44: Eastern Europe Market Attractiveness Analysis by Form
  • Figure 45: Eastern Europe Market Value Share and BPS Analysis by Application, 2025 and 2035
  • Figure 46: Eastern Europe Market Y-o-Y Growth Comparison by Application, 2025-2035
  • Figure 47: Eastern Europe Market Attractiveness Analysis by Application
  • Figure 48: East Asia Market Value Share and BPS Analysis by Country, 2025 and 2035
  • Figure 49: East Asia Market Value Share and BPS Analysis by Form, 2025 and 2035
  • Figure 50: East Asia Market Y-o-Y Growth Comparison by Form, 2025-2035
  • Figure 51: East Asia Market Attractiveness Analysis by Form
  • Figure 52: East Asia Market Value Share and BPS Analysis by Application, 2025 and 2035
  • Figure 53: East Asia Market Y-o-Y Growth Comparison by Application, 2025-2035
  • Figure 54: East Asia Market Attractiveness Analysis by Application
  • Figure 55: South Asia & Pacific Market Value Share and BPS Analysis by Country, 2025 and 2035
  • Figure 56: South Asia & Pacific Market Value Share and BPS Analysis by Form, 2025 and 2035
  • Figure 57: South Asia & Pacific Market Y-o-Y Growth Comparison by Form, 2025-2035
  • Figure 58: South Asia & Pacific Market Attractiveness Analysis by Form
  • Figure 59: South Asia & Pacific Market Value Share and BPS Analysis by Application, 2025 and 2035
  • Figure 60: South Asia & Pacific Market Y-o-Y Growth Comparison by Application, 2025-2035
  • Figure 61: South Asia & Pacific Market Attractiveness Analysis by Application
  • Figure 62: Middle East and Africa Market Value Share and BPS Analysis by Country, 2025 and 2035
  • Figure 63: Middle East and Africa Market Value Share and BPS Analysis by Form, 2025 and 2035
  • Figure 64: Middle East and Africa Market Y-o-Y Growth Comparison by Form, 2025-2035
  • Figure 65: Middle East and Africa Market Attractiveness Analysis by Form
  • Figure 66: Middle East and Africa Market Value Share and BPS Analysis by Application, 2025 and 2035
  • Figure 67: Middle East and Africa Market Y-o-Y Growth Comparison by Application, 2025-2035
  • Figure 68: Middle East and Africa Market Attractiveness Analysis by Application
  • Figure 69: Global Market - Tier Structure Analysis
  • Figure 70: Global Market - Company Share Analysis

Frequently Asked Questions

What is the estimated market size of the curcumin food color industry in 2025?

The industry is valued at USD 150.2 million in 2025.

What is the projected industry size of the curcumin food color industry by 2035?

It is forecasted to reach USD 446.09 million by 2035.

What is the expected CAGR for the curcumin food color industry between 2025 and 2035?

The industry is anticipated to grow at a CAGR of 11.5% during this period.

Which segment is expected to lead the curcumin food color market in 2025?

Powder is projected to lead the market with a 61.2% share in 2025.

Which region is expected to witness the highest growth in the curcumin food color market?

Asia Pacific, particularly China, is expected to be the key growth region with a projected growth rate of 12.8%.

Explore Similar Insights

Future Market Insights

Curcumin Food Color Market