Reports

- Global Locations -

Headquarters

Future Market Insights, Inc.

Christiana Corporate, 200
Continental Drive, Suite 401,
Newark, Delaware - 19713,
United States

T: +1-845-579-5705

Americas

Future Market Insights, Inc.

616 Corporate Way, Suite 2-9018,
Valley Cottage, NY 10989, United States

T: +1-347-918-3531

MEA

Future Market Insights

1602-6 Jumeirah Bay X2 Tower, Plot No: JLT-PH2-X2A,
Jumeirah Lakes Towers, Dubai,
United Arab Emirates

Europe

Future Market Insights

3rd Floor, 207 Regent Street,
W1B 3HH London
United Kingdom

T: + 44 (0) 20 8123 9659
D: +44 (0) 20 3287 4268

Asia Pacific

Future Market Insights

IndiaLand Global Tech Park, Unit UG-1, Behind Grand HighStreet, Phase 1, Hinjawadi, MH, Pune – 411057, India

Food Recycler Market Overview (2022-2032)

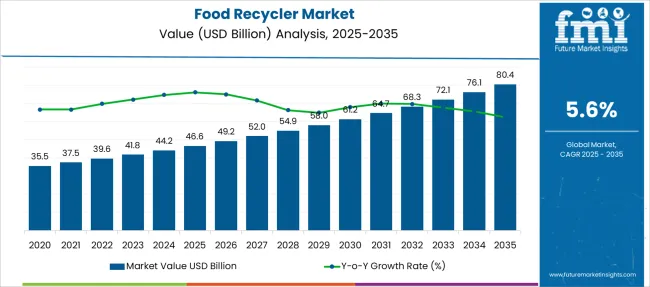
[250 Pages Report] The food recycler market is anticipated to record a CAGR of 5.6% during the forecast period. It is expected the market value is likely to go up from US$ 37.5 Bn in 2021 to reach a valuation of US$ 68.2 Bn by 2032.

Report Attributes Details
Food Recycler Market Estimated Base Year Value (2021) 37.5 Bn
Food Recycler Market Value in 2022 39.6 Bn
Food Recycler Market CAGR 2022-2032 5.6%
Anticipated Food Recycler Market Value (2032) 68.2 Bn

The alarming worldwide concern over wastage of food has created a huge gap in the market for smart technologies that can mitigate this situation. Recycling of waste organic substances has emerged as a major challenge in several economies. This problem has created a huge demand for food recycler services in different verticals.

Industries manufacturing different types of home kitchen appliances have come up with much modern equipment in the recent past, including the innovation in the food composting technique.

Food recycler is such a product that is used in commercial spaces as well to recycle the waste food by making fertilizer or manure out of it. Rapid urbanization has resulted in the establishment of kitchen gardens that can be regarded as a major attraction for the sales of food recycler products and services in large cities.

The traditional method of composting food waste and leftovers has created this technique, an attractive solution that can be observed by the higher demand for food recycler components in the past decade.

Moreover, increasing concern for the green environment and increasing awareness towards the use of organic compost instead of fertilizers is expected to witness significant growth in the sales of food recycler components during the forecast period.

A major share of revenue generated by sales of food recycler products is obtained from the hotels, restaurants and cafes that generate waste in bulk. Proper targeting of this sector by pricing and agreements can prove to be a major driver of the demand for food recycler products and services.

Major players in the food recycler market are also engaged in R&D activities food new food recycling and composting technologies. This trend is positively influencing the demand for food recycler products in new markets.

Don't pay for what you don't need

Customize your report by selecting specific countries or regions and save 30%!

What are the Trending Opportunities for the Food Recycler Market in the Coming Years?

Major Drivers for Global Food Recycler Market

Increasing urbanization, smart city projects in developing countries and government initiatives such as the go green concept is expected to positively influence the demand for food recycler components across the globe.

Increasing people's awareness of the food recycling process and devices and increasing concern for the environment is expected to increase the sales of food recycler components in the near future.

Opportunities for the Global Food Recycler Market

Technological advancements pertaining to food recycling and composition techniques in countries such as China, Japan and others are expected to register new growth opportunities for sales of food recycler components during the forecast period.

Moreover, the introduction of food recyclers with affordable prices by manufacturers in the near future is expected to fuel the demand for food recycler market share during the forecast period.

Major Challenges for Food Recycler Market

The high price of food recyclers is one of the main reasons limiting the sales of food recycler components. Generally, the middle-income population is showing a lack of interest in purchasing food recycles due to its high costs.

Higher investment in developing cold chain facilities in different parts of the world has some potential to decrease the pace of growth in food recycler market share in some economies.
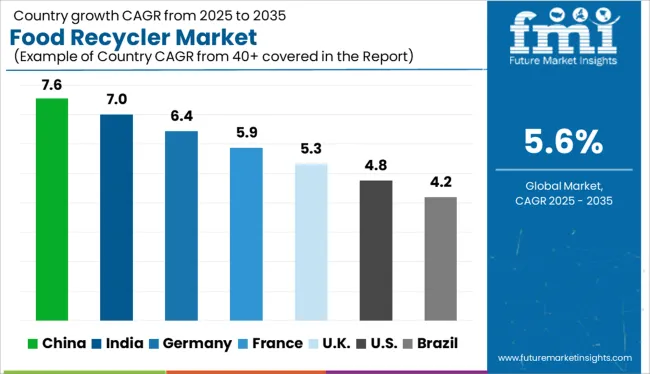
Which is the Leading Region in the Food Recycler Market?

North America and Europe are expected to hold a significant amount of food recycler market share in the global market due to technological advancements pertaining to food recycling and composting techniques.

An increasing number of manufacturers of food recyclers in the Asia Pacific region is expected to fuel the sales of food recycler in the near future in the region, in terms of volume. The demand for food recycler components in Latin America market is expected to witness moderate growth in the near future due to increasing disposable income in the region.

Moreover, the lack of technological advancement (pertaining to food recycling devices) in developing countries such as India, Mexico, and others restrict sales of food recycler in the country itself. Thus higher import and logistics cost decreases the food recycler market share in such countries.

The Middle East and Africa are witnessing a slow growth of the food recycler market. However, increasing public concern for the environment and increasing urbanization in the region are expected to positively grow the demand for food recycler components in the Latin America market during the forecast period.
Sneha Verghese
Sneha Verghese

Principal Consultant

Talk to Analyst

Find your sweet spots for generating winning opportunities in this market.

Who are the Key Players in the Food Recycler Market?

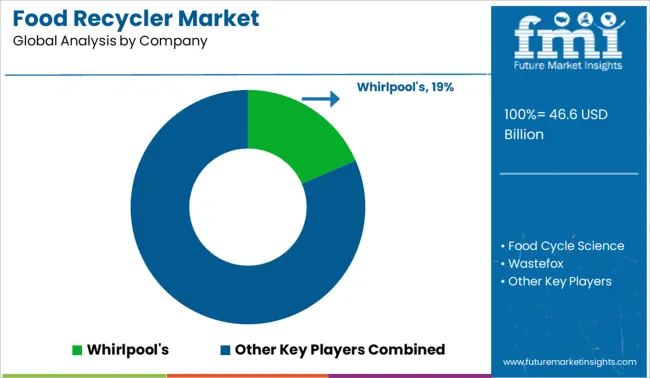
Some of the key players in the global food recycler market includes Whirlpool's, Food Cycle Science, Wastefox, Joseph Joseph, Nine Stars Group (USA) Inc., Simplehuman, Smart Cara, Food Cycler, and Mares Group.

Major Developments in the Food Recycler Market

  • In January 2022, the Zera food recycler device launched by Whirlpool was awarded the CES Best of Innovations Award. This new innovation is very efficient and can turn the waste food products into fertilizer within 24 hours that can generate a lot of demand for food recycler product.

  • In October 2021, the Quebec entrepreneurs group successfully designed a home food recycler named Tero that can recycle kitchen waste into organic fertilizer for gardens. This segment is expected to drive some higher sales of food recycler products in retail market.

Report Scope

Report Attribute Details
Growth Rate CAGR of 5.6% from 2022 to 2032
Base Year of Estimation 2021
Historical Data 2014-2020
Forecast Period 2022-2032
Quantitative Units Revenue in USD Billion, Volume in Kilotons and CAGR from 2022-2032
Report Coverage Revenue Forecast, Volume Forecast, Company Ranking, Competitive Landscape, Growth Factors, Trends and Pricing Analysis
Segments Covered
  • Component
  • Price Range
  • Distribution Channel
  • Material Type
  • End Use
  • Region
Regions Covered
  • North America
  • Latin America
  • Western Europe
  • Eastern Europe
  • APEJ
  • Japan
  • Middle East and Africa
Key Countries Profiled
  • U.S.
  • Canada
  • Brazil
  • Argentina
  • Germany
  • UK
  • France
  • Spain
  • Italy
  • Nordics
  • BENELUX
  • Australia & New Zealand
  • China
  • India
  • ASEAN
  • GCC
  • South Africa
Key Companies Profiled
  • Whirlpool's
  • Food Cycle Science
  • Wastefox
  • Joseph Joseph
  • Nine Stars Group (USA) Inc.
  • Simplehuman
  • Smart Cara
  • Food Cycler
  • Mares Group
Customization scope Available Upon Request
Pricing and Purchase Option Avail Customized purchase options to meet your exact research needs.

Get the data you need at a Fraction of the cost

Personalize your report by choosing insights you need
and save 40%!

Key Segments

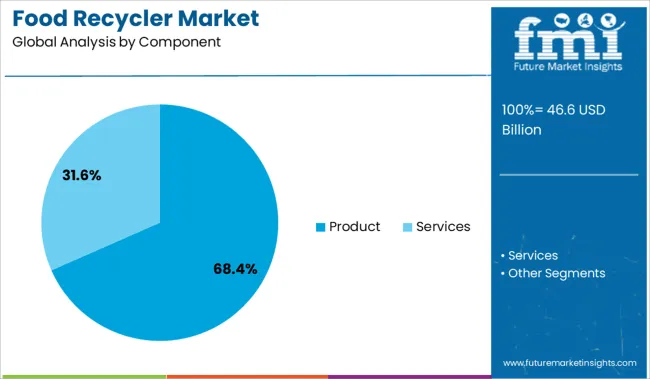
By Component:

  • Product
  • Services

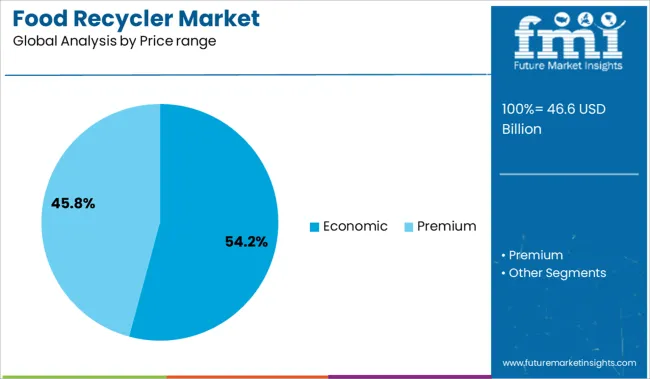
By Price Range:

  • Economic
  • Premium

By Distribution Channel:

  • OEM
  • Distributors
  • Retailers
  • E-commerce

By Material Type:

  • Steel
  • Stainless Steel
  • Carbon Steel
  • Plastic
  • Fibre
  • Others

By End Use:

  • Residential
  • Commercial

By Region:

  • North America
  • Latin America
  • Europe
  • Asia Pacific
  • MEA

Frequently Asked Questions

What is the Growth Outlook for the Food Recycler Market?

What is the Growth Outlook for the Food Recycler Market?

Who are the Prominent Players in the Food Recycler Market that will drive the Global Market during the Forecast Years?

Who are the Prominent Players in the Food Recycler Market that will drive the Global Market during the Forecast Years?

What is the Future Analysis for the Total Value of the Food Recycler Market?

As per the analysis, the food recycler market share is likely to be US$ 68.2 Bn by 2032.

Table of Content

1. Executive Summary

    1.1. Global Market Outlook

    1.2. Demand-side Trends

    1.3. Supply-side Trends

    1.4. Technology Roadmap Analysis

    1.5. Analysis and Recommendations

2. Market Overview

    2.1. Market Coverage / Taxonomy

    2.2. Market Definition / Scope / Limitations

3. Market Background

    3.1. Market Dynamics

        3.1.1. Drivers

        3.1.2. Restraints

        3.1.3. Opportunity 

        3.1.4. Trends

    3.2. Scenario Forecast

        3.2.1. Demand in Optimistic Scenario

        3.2.2. Demand in Likely Scenario

        3.2.3. Demand in Conservative Scenario

    3.3. Opportunity Map Analysis

    3.4. Investment Feasibility Matrix

    3.5. PESTLE and Porter’s Analysis

    3.6. Regulatory Landscape

        3.6.1. By Key Regions

        3.6.2. By Key Countries

4. Global Food Recycler Market Analysis 2017-2021 and Forecast, 2022-2032

    4.1. Historical Market Size Value (US$ Mn) & Volume (Units) Analysis, 2017-2021

    4.2. Current and Future Market Size Value (US$ Mn) & Volume (Units) Projections, 2022-2032

        4.2.1. Y-o-Y Growth Trend Analysis

        4.2.2. Absolute $ Opportunity Analysis

5. Global Food Recycler Market Analysis 2017-2021 and Forecast 2022-2032, By Component

    5.1. Introduction / Key Findings

    5.2. Historical Market Size Value (US$ Mn) & Volume (Units) Analysis By Component, 2017-2021

    5.3. Current and Future Market Size Value (US$ Mn) & Volume (Units) Analysis and Forecast By Component, 2022-2032

        5.3.1. Product

        5.3.2. Services

    5.4. Y-o-Y Growth Trend Analysis By Component, 2017-2021

    5.5. Absolute $ Opportunity Analysis By Component, 2022-2032

6. Global Food Recycler Market Analysis 2017-2021 and Forecast 2022-2032, By Price range

    6.1. Introduction / Key Findings

    6.2. Historical Market Size Value (US$ Mn) & Volume (Units) Analysis By Price range, 2017-2021

    6.3. Current and Future Market Size Value (US$ Mn) & Volume (Units) Analysis and Forecast By Price range, 2022-2032

        6.3.1. Economic 

        6.3.2. Premium

    6.4. Y-o-Y Growth Trend Analysis By Price range, 2017-2021

    6.5. Absolute $ Opportunity Analysis By Price range, 2022-2032

7. Global Food Recycler Market Analysis 2017-2021 and Forecast 2022-2032, By Sales Channels 

    7.1. Introduction / Key Findings

    7.2. Historical Market Size Value (US$ Mn) & Volume (Units) Analysis By Sales Channels , 2017-2021

    7.3. Current and Future Market Size Value (US$ Mn) & Volume (Units) Analysis and Forecast By Sales Channels , 2022-2032

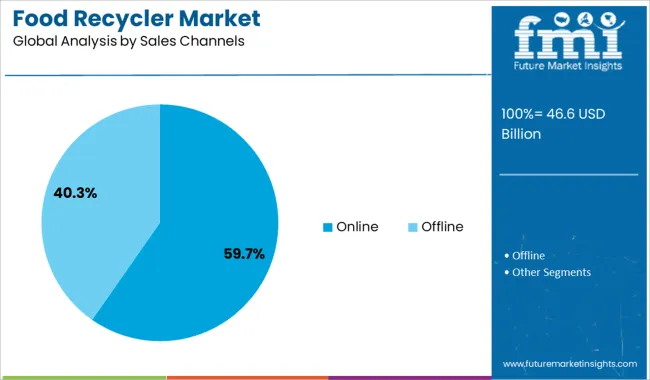
        7.3.1. Online

        7.3.2. Offline 

    7.4. Y-o-Y Growth Trend Analysis By Sales Channels , 2017-2021

    7.5. Absolute $ Opportunity Analysis By Sales Channels , 2022-2032

8. Global Food Recycler Market Analysis 2017-2021 and Forecast 2022-2032, By Material type

    8.1. Introduction / Key Findings

    8.2. Historical Market Size Value (US$ Mn) & Volume (Units) Analysis By Material type, 2017-2021

    8.3. Current and Future Market Size Value (US$ Mn) & Volume (Units) Analysis and Forecast By Material type, 2022-2032

        8.3.1. Steel

        8.3.2. Stainless steel

        8.3.3. Carbon Steel

        8.3.4. Plastic

        8.3.5. Fiber

        8.3.6. Others 

    8.4. Y-o-Y Growth Trend Analysis By Material type, 2017-2021

    8.5. Absolute $ Opportunity Analysis By Material type, 2022-2032

9. Global Food Recycler Market Analysis 2017-2021 and Forecast 2022-2032, By End Use

    9.1. Introduction / Key Findings

    9.2. Historical Market Size Value (US$ Mn) & Volume (Units) Analysis By End Use, 2017-2021

    9.3. Current and Future Market Size Value (US$ Mn) & Volume (Units) Analysis and Forecast By End Use, 2022-2032

        9.3.1. Residential

        9.3.2. Commercial

    9.4. Y-o-Y Growth Trend Analysis By End Use, 2017-2021

    9.5. Absolute $ Opportunity Analysis By End Use, 2022-2032

10. Global Food Recycler Market Analysis 2017-2021 and Forecast 2022-2032, By Region

    10.1. Introduction

    10.2. Historical Market Size Value (US$ Mn) & Volume (Units) Analysis By Region, 2017-2021

    10.3. Current Market Size Value (US$ Mn) & Volume (Units) Analysis and Forecast By Region, 2022-2032

        10.3.1. North America

        10.3.2. Latin America

        10.3.3. Europe

        10.3.4. East Asia

        10.3.5. South Asia

        10.3.6. Oceania

        10.3.7. MEA

    10.4. Market Attractiveness Analysis By Region

11. North America Food Recycler Market Analysis 2017-2021 and Forecast 2022-2032, By Country

    11.1. Historical Market Size Value (US$ Mn) & Volume (Units) Trend Analysis By Market Taxonomy, 2017-2021

    11.2. Market Size Value (US$ Mn) & Volume (Units) Forecast By Market Taxonomy, 2022-2032

        11.2.1. By Country

            11.2.1.1. U.S.

            11.2.1.2. Canada

        11.2.2. By Component

        11.2.3. By Price range

        11.2.4. By Sales Channels 

        11.2.5. By Material type

        11.2.6. By End Use

    11.3. Market Attractiveness Analysis

        11.3.1. By Country

        11.3.2. By Component

        11.3.3. By Price range

        11.3.4. By Sales Channels 

        11.3.5. By Material type

        11.3.6. By End Use

    11.4. Key Takeaways

12. Latin America Food Recycler Market Analysis 2017-2021 and Forecast 2022-2032, By Country

    12.1. Historical Market Size Value (US$ Mn) & Volume (Units) Trend Analysis By Market Taxonomy, 2017-2021

    12.2. Market Size Value (US$ Mn) & Volume (Units) Forecast By Market Taxonomy, 2022-2032

        12.2.1. By Country

            12.2.1.1. Brazil

            12.2.1.2. Mexico

            12.2.1.3. Rest of Latin America

        12.2.2. By Component

        12.2.3. By Price range

        12.2.4. By Sales Channels 

        12.2.5. By Material type

        12.2.6. By End Use

    12.3. Market Attractiveness Analysis

        12.3.1. By Country

        12.3.2. By Component

        12.3.3. By Price range

        12.3.4. By Sales Channels 

        12.3.5. By Material type

        12.3.6. By End Use

    12.4. Key Takeaways

13. Europe Food Recycler Market Analysis 2017-2021 and Forecast 2022-2032, By Country

    13.1. Historical Market Size Value (US$ Mn) & Volume (Units) Trend Analysis By Market Taxonomy, 2017-2021

    13.2. Market Size Value (US$ Mn) & Volume (Units) Forecast By Market Taxonomy, 2022-2032

        13.2.1. By Country

            13.2.1.1. Germany

            13.2.1.2. Italy

            13.2.1.3. France

            13.2.1.4. U.K.

            13.2.1.5. Spain

            13.2.1.6. Russia

            13.2.1.7. BENELUX

            13.2.1.8. Rest of Europe

        13.2.2. By Component

        13.2.3. By Price range

        13.2.4. By Sales Channels 

        13.2.5. By Material type

        13.2.6. By End Use

    13.3. Market Attractiveness Analysis

        13.3.1. By Country

        13.3.2. By Component

        13.3.3. By Price range

        13.3.4. By Sales Channels 

        13.3.5. By Material type

        13.3.6. By End Use

    13.4. Key Takeaways

14. East Asia Food Recycler Market Analysis 2017-2021 and Forecast 2022-2032, By Country

    14.1. Historical Market Size Value (US$ Mn) & Volume (Units) Trend Analysis By Market Taxonomy, 2017-2021

    14.2. Market Size Value (US$ Mn) & Volume (Units) Forecast By Market Taxonomy, 2022-2032

        14.2.1. By Country

            14.2.1.1. China

            14.2.1.2. Japan

            14.2.1.3. South Korea

        14.2.2. By Component

        14.2.3. By Price range

        14.2.4. By Sales Channels 

        14.2.5. By Material type

        14.2.6. By End Use

    14.3. Market Attractiveness Analysis

        14.3.1. By Country

        14.3.2. By Component

        14.3.3. By Price range

        14.3.4. By Sales Channels 

        14.3.5. By Material type

        14.3.6. By End Use

    14.4. Key Takeaways

15. South Asia Food Recycler Market Analysis 2017-2021 and Forecast 2022-2032, By Country

    15.1. Historical Market Size Value (US$ Mn) & Volume (Units) Trend Analysis By Market Taxonomy, 2017-2021

    15.2. Market Size Value (US$ Mn) & Volume (Units) Forecast By Market Taxonomy, 2022-2032

        15.2.1. By Country

            15.2.1.1. India

            15.2.1.2. Thailand

            15.2.1.3. Malaysia

            15.2.1.4. Indonesia

            15.2.1.5. Rest of South Asia

        15.2.2. By Component

        15.2.3. By Price range

        15.2.4. By Sales Channels 

        15.2.5. By Material type

        15.2.6. By End Use

    15.3. Market Attractiveness Analysis

        15.3.1. By Country

        15.3.2. By Component

        15.3.3. By Price range

        15.3.4. By Sales Channels 

        15.3.5. By Material type

        15.3.6. By End Use

    15.4. Key Takeaways

16. Oceania Food Recycler Market Analysis 2017-2021 and Forecast 2022-2032, By Country

    16.1. Historical Market Size Value (US$ Mn) & Volume (Units) Trend Analysis By Market Taxonomy, 2017-2021

    16.2. Market Size Value (US$ Mn) & Volume (Units) Forecast By Market Taxonomy, 2022-2032

        16.2.1. By Country

            16.2.1.1. Australia

            16.2.1.2. New Zealand

        16.2.2. By Component

        16.2.3. By Price range

        16.2.4. By Sales Channels 

        16.2.5. By Material type

        16.2.6. By End Use

    16.3. Market Attractiveness Analysis

        16.3.1. By Country

        16.3.2. By Component

        16.3.3. By Price range

        16.3.4. By Sales Channels 

        16.3.5. By Material type

        16.3.6. By End Use

    16.4. Key Takeaways

17. MEA Food Recycler Market Analysis 2017-2021 and Forecast 2022-2032, By Country

    17.1. Historical Market Size Value (US$ Mn) & Volume (Units) Trend Analysis By Market Taxonomy, 2017-2021

    17.2. Market Size Value (US$ Mn) & Volume (Units) Forecast By Market Taxonomy, 2022-2032

        17.2.1. By Country

            17.2.1.1. GCC Countries

            17.2.1.2. Turkey

            17.2.1.3. Israel

            17.2.1.4. South Africa

            17.2.1.5. Egypt

            17.2.1.6. Rest of MEA 

        17.2.2. By Component

        17.2.3. By Price range

        17.2.4. By Sales Channels 

        17.2.5. By Material type

        17.2.6. By End Use

    17.3. Market Attractiveness Analysis

        17.3.1. By Country

        17.3.2. By Component

        17.3.3. By Price range

        17.3.4. By Sales Channels 

        17.3.5. By Material type

        17.3.6. By End Use

    17.4. Key Takeaways

18. Key Countries Food Recycler Market Analysis

    18.1. U.S.

        18.1.1. Pricing Analysis

        18.1.2. Market Share Analysis, 2021

            18.1.2.1. By Component

            18.1.2.2. By Price range

            18.1.2.3. By Sales Channels 

            18.1.2.4. By Material type

            18.1.2.5. By End Use

    18.2. Canada

        18.2.1. Pricing Analysis

        18.2.2. Market Share Analysis, 2021

            18.2.2.1. By Component

            18.2.2.2. By Price range

            18.2.2.3. By Sales Channels 

            18.2.2.4. By Material type

            18.2.2.5. By End Use

    18.3. Brazil

        18.3.1. Pricing Analysis

        18.3.2. Market Share Analysis, 2021

            18.3.2.1. By Component

            18.3.2.2. By Price range

            18.3.2.3. By Sales Channels 

            18.3.2.4. By Material type

            18.3.2.5. By End Use

    18.4. Mexico

        18.4.1. Pricing Analysis

        18.4.2. Market Share Analysis, 2021

            18.4.2.1. By Component

            18.4.2.2. By Price range

            18.4.2.3. By Sales Channels 

            18.4.2.4. By Material type

            18.4.2.5. By End Use

    18.5. Argentina

        18.5.1. Pricing Analysis

        18.5.2. Market Share Analysis, 2021

            18.5.2.1. By Component

            18.5.2.2. By Price range

            18.5.2.3. By Sales Channels 

            18.5.2.4. By Material type

            18.5.2.5. By End Use

    18.6. Germany

        18.6.1. Pricing Analysis

        18.6.2. Market Share Analysis, 2021

            18.6.2.1. By Component

            18.6.2.2. By Price range

            18.6.2.3. By Sales Channels 

            18.6.2.4. By Material type

            18.6.2.5. By End Use

    18.7. Italy

        18.7.1. Pricing Analysis

        18.7.2. Market Share Analysis, 2021

            18.7.2.1. By Component

            18.7.2.2. By Price range

            18.7.2.3. By Sales Channels 

            18.7.2.4. By Material type

            18.7.2.5. By End Use

    18.8. France

        18.8.1. Pricing Analysis

        18.8.2. Market Share Analysis, 2021

            18.8.2.1. By Component

            18.8.2.2. By Price range

            18.8.2.3. By Sales Channels 

            18.8.2.4. By Material type

            18.8.2.5. By End Use

    18.9. U.K.

        18.9.1. Pricing Analysis

        18.9.2. Market Share Analysis, 2021

            18.9.2.1. By Component

            18.9.2.2. By Price range

            18.9.2.3. By Sales Channels 

            18.9.2.4. By Material type

            18.9.2.5. By End Use

    18.10. Spain

        18.10.1. Pricing Analysis

        18.10.2. Market Share Analysis, 2021

            18.10.2.1. By Component

            18.10.2.2. By Price range

            18.10.2.3. By Sales Channels 

            18.10.2.4. By Material type

            18.10.2.5. By End Use

    18.11. Russia

        18.11.1. Pricing Analysis

        18.11.2. Market Share Analysis, 2021

            18.11.2.1. By Component

            18.11.2.2. By Price range

            18.11.2.3. By Sales Channels 

            18.11.2.4. By Material type

            18.11.2.5. By End Use

    18.12. BENELUX

        18.12.1. Pricing Analysis

        18.12.2. Market Share Analysis, 2021

            18.12.2.1. By Component

            18.12.2.2. By Price range

            18.12.2.3. By Sales Channels 

            18.12.2.4. By Material type

            18.12.2.5. By End Use

    18.13. China

        18.13.1. Pricing Analysis

        18.13.2. Market Share Analysis, 2021

            18.13.2.1. By Component

            18.13.2.2. By Price range

            18.13.2.3. By Sales Channels 

            18.13.2.4. By Material type

            18.13.2.5. By End Use

    18.14. Japan

        18.14.1. Pricing Analysis

        18.14.2. Market Share Analysis, 2021

            18.14.2.1. By Component

            18.14.2.2. By Price range

            18.14.2.3. By Sales Channels 

            18.14.2.4. By Material type

            18.14.2.5. By End Use

    18.15. South Korea

        18.15.1. Pricing Analysis

        18.15.2. Market Share Analysis, 2021

            18.15.2.1. By Component

            18.15.2.2. By Price range

            18.15.2.3. By Sales Channels 

            18.15.2.4. By Material type

            18.15.2.5. By End Use

    18.16. India

        18.16.1. Pricing Analysis

        18.16.2. Market Share Analysis, 2021

            18.16.2.1. By Component

            18.16.2.2. By Price range

            18.16.2.3. By Sales Channels 

            18.16.2.4. By Material type

            18.16.2.5. By End Use

    18.17. GCC Countries

        18.17.1. Pricing Analysis

        18.17.2. Market Share Analysis, 2021

            18.17.2.1. By Component

            18.17.2.2. By Price range

            18.17.2.3. By Sales Channels 

            18.17.2.4. By Material type

            18.17.2.5. By End Use

    18.18. Turkey

        18.18.1. Pricing Analysis

        18.18.2. Market Share Analysis, 2021

            18.18.2.1. By Component

            18.18.2.2. By Price range

            18.18.2.3. By Sales Channels 

            18.18.2.4. By Material type

            18.18.2.5. By End Use

    18.19. Israel

        18.19.1. Pricing Analysis

        18.19.2. Market Share Analysis, 2021

            18.19.2.1. By Component

            18.19.2.2. By Price range

            18.19.2.3. By Sales Channels 

            18.19.2.4. By Material type

            18.19.2.5. By End Use

    18.20. South Africa

        18.20.1. Pricing Analysis

        18.20.2. Market Share Analysis, 2021

            18.20.2.1. By Component

            18.20.2.2. By Price range

            18.20.2.3. By Sales Channels 

            18.20.2.4. By Material type

            18.20.2.5. By End Use

    18.21. Egypt

        18.21.1. Pricing Analysis

        18.21.2. Market Share Analysis, 2021

            18.21.2.1. By Component

            18.21.2.2. By Price range

            18.21.2.3. By Sales Channels 

            18.21.2.4. By Material type

            18.21.2.5. By End Use

19. Market Structure Analysis

    19.1. Competition Dashboard

    19.2. Competition Benchmarking

    19.3. Market Share Analysis of Top Players

        19.3.1. By Regional

        19.3.2. By Component

        19.3.3. By Price range

        19.3.4. By Sales Channels 

        19.3.5. By Material type

        19.3.6. By End Use

20. Competition Analysis

    20.1. Competition Deep Dive

        20.1.1. Whirlpool's

            20.1.1.1. Overview

            20.1.1.2. Product Portfolio

            20.1.1.3. Profitability by Market Segment

            20.1.1.4. Sales Footprint

            20.1.1.5. Strategy Overview

                20.1.1.5.1. Marketing Strategy

                20.1.1.5.2. Product Strategy

        20.1.2. Food Cycle Science

            20.1.2.1. Overview

            20.1.2.2. Product Portfolio

            20.1.2.3. Profitability by Market Segment

            20.1.2.4. Sales Footprint

            20.1.2.5. Strategy Overview

                20.1.2.5.1. Marketing Strategy

                20.1.2.5.2. Product Strategy

        20.1.3. Wastefox

            20.1.3.1. Overview

            20.1.3.2. Product Portfolio

            20.1.3.3. Profitability by Market Segment

            20.1.3.4. Sales Footprint

            20.1.3.5. Strategy Overview

                20.1.3.5.1. Marketing Strategy

                20.1.3.5.2. Product Strategy

        20.1.4. Joseph Joseph

            20.1.4.1. Overview

            20.1.4.2. Product Portfolio

            20.1.4.3. Profitability by Market Segment

            20.1.4.4. Sales Footprint

            20.1.4.5. Strategy Overview

                20.1.4.5.1. Marketing Strategy

                20.1.4.5.2. Product Strategy

        20.1.5. Nine Stars Group (USA) Inc.

            20.1.5.1. Overview

            20.1.5.2. Product Portfolio

            20.1.5.3. Profitability by Market Segment

            20.1.5.4. Sales Footprint

            20.1.5.5. Strategy Overview

                20.1.5.5.1. Marketing Strategy

                20.1.5.5.2. Product Strategy

        20.1.6. Simplehuman

            20.1.6.1. Overview

            20.1.6.2. Product Portfolio

            20.1.6.3. Profitability by Market Segment

            20.1.6.4. Sales Footprint

            20.1.6.5. Strategy Overview

                20.1.6.5.1. Marketing Strategy

                20.1.6.5.2. Product Strategy

        20.1.7. Smart Cara

            20.1.7.1. Overview

            20.1.7.2. Product Portfolio

            20.1.7.3. Profitability by Market Segment

            20.1.7.4. Sales Footprint

            20.1.7.5. Strategy Overview

                20.1.7.5.1. Marketing Strategy

                20.1.7.5.2. Product Strategy

        20.1.8. Food Cycler

            20.1.8.1. Overview

            20.1.8.2. Product Portfolio

            20.1.8.3. Profitability by Market Segment

            20.1.8.4. Sales Footprint

            20.1.8.5. Strategy Overview

                20.1.8.5.1. Marketing Strategy

                20.1.8.5.2. Product Strategy

        20.1.9. Mares Group

            20.1.9.1. Overview

            20.1.9.2. Product Portfolio

            20.1.9.3. Profitability by Market Segment

            20.1.9.4. Sales Footprint

            20.1.9.5. Strategy Overview

                20.1.9.5.1. Marketing Strategy

                20.1.9.5.2. Product Strategy

        20.1.10. GLAD

            20.1.10.1. Overview

            20.1.10.2. Product Portfolio

            20.1.10.3. Profitability by Market Segment

            20.1.10.4. Sales Footprint

            20.1.10.5. Strategy Overview

                20.1.10.5.1. Marketing Strategy

                20.1.10.5.2. Product Strategy

        20.1.11. Household Essentials

            20.1.11.1. Overview

            20.1.11.2. Product Portfolio

            20.1.11.3. Profitability by Market Segment

            20.1.11.4. Sales Footprint

            20.1.11.5. Strategy Overview

                20.1.11.5.1. Marketing Strategy

                20.1.11.5.2. Product Strategy

        20.1.12. iTouchless

            20.1.12.1. Overview

            20.1.12.2. Product Portfolio

            20.1.12.3. Profitability by Market Segment

            20.1.12.4. Sales Footprint

            20.1.12.5. Strategy Overview

                20.1.12.5.1. Marketing Strategy

                20.1.12.5.2. Product Strategy

        20.1.13. simplehuman

            20.1.13.1. Overview

            20.1.13.2. Product Portfolio

            20.1.13.3. Profitability by Market Segment

            20.1.13.4. Sales Footprint

            20.1.13.5. Strategy Overview

                20.1.13.5.1. Marketing Strategy

                20.1.13.5.2. Product Strategy

        20.1.14. mDesign

            20.1.14.1. Overview

            20.1.14.2. Product Portfolio

            20.1.14.3. Profitability by Market Segment

            20.1.14.4. Sales Footprint

            20.1.14.5. Strategy Overview

                20.1.14.5.1. Marketing Strategy

                20.1.14.5.2. Product Strategy

        20.1.15. Better Homes & Gardens

            20.1.15.1. Overview

            20.1.15.2. Product Portfolio

            20.1.15.3. Profitability by Market Segment

            20.1.15.4. Sales Footprint

            20.1.15.5. Strategy Overview

                20.1.15.5.1. Marketing Strategy

                20.1.15.5.2. Product Strategy

21. Assumptions & Acronyms Used

22. Research Methodology

Don't pay for what you don't need

Customize your report by selecting specific countries or regions and save 30%!

List of Tables

Table 1: Global Food Recycler Market Value (US$ Mn) Forecast by Region, 2017-2032

Table 2: Global Food Recycler Market Volume (Units) Forecast by Region, 2017-2032

Table 3: Global Food Recycler Market Value (US$ Mn) Forecast by Component, 2017-2032

Table 4: Global Food Recycler Market Volume (Units) Forecast by Component, 2017-2032

Table 5: Global Food Recycler Market Value (US$ Mn) Forecast by Price range, 2017-2032

Table 6: Global Food Recycler Market Volume (Units) Forecast by Price range, 2017-2032

Table 7: Global Food Recycler Market Value (US$ Mn) Forecast by Sales Channels , 2017-2032

Table 8: Global Food Recycler Market Volume (Units) Forecast by Sales Channels , 2017-2032

Table 9: Global Food Recycler Market Value (US$ Mn) Forecast by Material type, 2017-2032

Table 10: Global Food Recycler Market Volume (Units) Forecast by Material type, 2017-2032

Table 11: Global Food Recycler Market Value (US$ Mn) Forecast by End Use, 2017-2032

Table 12: Global Food Recycler Market Volume (Units) Forecast by End Use, 2017-2032

Table 13: North America Food Recycler Market Value (US$ Mn) Forecast by Country, 2017-2032

Table 14: North America Food Recycler Market Volume (Units) Forecast by Country, 2017-2032

Table 15: North America Food Recycler Market Value (US$ Mn) Forecast by Component, 2017-2032

Table 16: North America Food Recycler Market Volume (Units) Forecast by Component, 2017-2032

Table 17: North America Food Recycler Market Value (US$ Mn) Forecast by Price range, 2017-2032

Table 18: North America Food Recycler Market Volume (Units) Forecast by Price range, 2017-2032

Table 19: North America Food Recycler Market Value (US$ Mn) Forecast by Sales Channels , 2017-2032

Table 20: North America Food Recycler Market Volume (Units) Forecast by Sales Channels , 2017-2032

Table 21: North America Food Recycler Market Value (US$ Mn) Forecast by Material type, 2017-2032

Table 22: North America Food Recycler Market Volume (Units) Forecast by Material type, 2017-2032

Table 23: North America Food Recycler Market Value (US$ Mn) Forecast by End Use, 2017-2032

Table 24: North America Food Recycler Market Volume (Units) Forecast by End Use, 2017-2032

Table 25: Latin America Food Recycler Market Value (US$ Mn) Forecast by Country, 2017-2032

Table 26: Latin America Food Recycler Market Volume (Units) Forecast by Country, 2017-2032

Table 27: Latin America Food Recycler Market Value (US$ Mn) Forecast by Component, 2017-2032

Table 28: Latin America Food Recycler Market Volume (Units) Forecast by Component, 2017-2032

Table 29: Latin America Food Recycler Market Value (US$ Mn) Forecast by Price range, 2017-2032

Table 30: Latin America Food Recycler Market Volume (Units) Forecast by Price range, 2017-2032

Table 31: Latin America Food Recycler Market Value (US$ Mn) Forecast by Sales Channels , 2017-2032

Table 32: Latin America Food Recycler Market Volume (Units) Forecast by Sales Channels , 2017-2032

Table 33: Latin America Food Recycler Market Value (US$ Mn) Forecast by Material type, 2017-2032

Table 34: Latin America Food Recycler Market Volume (Units) Forecast by Material type, 2017-2032

Table 35: Latin America Food Recycler Market Value (US$ Mn) Forecast by End Use, 2017-2032

Table 36: Latin America Food Recycler Market Volume (Units) Forecast by End Use, 2017-2032

Table 37: Europe Food Recycler Market Value (US$ Mn) Forecast by Country, 2017-2032

Table 38: Europe Food Recycler Market Volume (Units) Forecast by Country, 2017-2032

Table 39: Europe Food Recycler Market Value (US$ Mn) Forecast by Component, 2017-2032

Table 40: Europe Food Recycler Market Volume (Units) Forecast by Component, 2017-2032

Table 41: Europe Food Recycler Market Value (US$ Mn) Forecast by Price range, 2017-2032

Table 42: Europe Food Recycler Market Volume (Units) Forecast by Price range, 2017-2032

Table 43: Europe Food Recycler Market Value (US$ Mn) Forecast by Sales Channels , 2017-2032

Table 44: Europe Food Recycler Market Volume (Units) Forecast by Sales Channels , 2017-2032

Table 45: Europe Food Recycler Market Value (US$ Mn) Forecast by Material type, 2017-2032

Table 46: Europe Food Recycler Market Volume (Units) Forecast by Material type, 2017-2032

Table 47: Europe Food Recycler Market Value (US$ Mn) Forecast by End Use, 2017-2032

Table 48: Europe Food Recycler Market Volume (Units) Forecast by End Use, 2017-2032

Table 49: East Asia Food Recycler Market Value (US$ Mn) Forecast by Country, 2017-2032

Table 50: East Asia Food Recycler Market Volume (Units) Forecast by Country, 2017-2032

Table 51: East Asia Food Recycler Market Value (US$ Mn) Forecast by Component, 2017-2032

Table 52: East Asia Food Recycler Market Volume (Units) Forecast by Component, 2017-2032

Table 53: East Asia Food Recycler Market Value (US$ Mn) Forecast by Price range, 2017-2032

Table 54: East Asia Food Recycler Market Volume (Units) Forecast by Price range, 2017-2032

Table 55: East Asia Food Recycler Market Value (US$ Mn) Forecast by Sales Channels , 2017-2032

Table 56: East Asia Food Recycler Market Volume (Units) Forecast by Sales Channels , 2017-2032

Table 57: East Asia Food Recycler Market Value (US$ Mn) Forecast by Material type, 2017-2032

Table 58: East Asia Food Recycler Market Volume (Units) Forecast by Material type, 2017-2032

Table 59: East Asia Food Recycler Market Value (US$ Mn) Forecast by End Use, 2017-2032

Table 60: East Asia Food Recycler Market Volume (Units) Forecast by End Use, 2017-2032

Table 61: South Asia Food Recycler Market Value (US$ Mn) Forecast by Country, 2017-2032

Table 62: South Asia Food Recycler Market Volume (Units) Forecast by Country, 2017-2032

Table 63: South Asia Food Recycler Market Value (US$ Mn) Forecast by Component, 2017-2032

Table 64: South Asia Food Recycler Market Volume (Units) Forecast by Component, 2017-2032

Table 65: South Asia Food Recycler Market Value (US$ Mn) Forecast by Price range, 2017-2032

Table 66: South Asia Food Recycler Market Volume (Units) Forecast by Price range, 2017-2032

Table 67: South Asia Food Recycler Market Value (US$ Mn) Forecast by Sales Channels , 2017-2032

Table 68: South Asia Food Recycler Market Volume (Units) Forecast by Sales Channels , 2017-2032

Table 69: South Asia Food Recycler Market Value (US$ Mn) Forecast by Material type, 2017-2032

Table 70: South Asia Food Recycler Market Volume (Units) Forecast by Material type, 2017-2032

Table 71: South Asia Food Recycler Market Value (US$ Mn) Forecast by End Use, 2017-2032

Table 72: South Asia Food Recycler Market Volume (Units) Forecast by End Use, 2017-2032

Table 73: Oceania Food Recycler Market Value (US$ Mn) Forecast by Country, 2017-2032

Table 74: Oceania Food Recycler Market Volume (Units) Forecast by Country, 2017-2032

Table 75: Oceania Food Recycler Market Value (US$ Mn) Forecast by Component, 2017-2032

Table 76: Oceania Food Recycler Market Volume (Units) Forecast by Component, 2017-2032

Table 77: Oceania Food Recycler Market Value (US$ Mn) Forecast by Price range, 2017-2032

Table 78: Oceania Food Recycler Market Volume (Units) Forecast by Price range, 2017-2032

Table 79: Oceania Food Recycler Market Value (US$ Mn) Forecast by Sales Channels , 2017-2032

Table 80: Oceania Food Recycler Market Volume (Units) Forecast by Sales Channels , 2017-2032

Table 81: Oceania Food Recycler Market Value (US$ Mn) Forecast by Material type, 2017-2032

Table 82: Oceania Food Recycler Market Volume (Units) Forecast by Material type, 2017-2032

Table 83: Oceania Food Recycler Market Value (US$ Mn) Forecast by End Use, 2017-2032

Table 84: Oceania Food Recycler Market Volume (Units) Forecast by End Use, 2017-2032

Table 85: MEA Food Recycler Market Value (US$ Mn) Forecast by Country, 2017-2032

Table 86: MEA Food Recycler Market Volume (Units) Forecast by Country, 2017-2032

Table 87: MEA Food Recycler Market Value (US$ Mn) Forecast by Component, 2017-2032

Table 88: MEA Food Recycler Market Volume (Units) Forecast by Component, 2017-2032

Table 89: MEA Food Recycler Market Value (US$ Mn) Forecast by Price range, 2017-2032

Table 90: MEA Food Recycler Market Volume (Units) Forecast by Price range, 2017-2032

Table 91: MEA Food Recycler Market Value (US$ Mn) Forecast by Sales Channels , 2017-2032

Table 92: MEA Food Recycler Market Volume (Units) Forecast by Sales Channels , 2017-2032

Table 93: MEA Food Recycler Market Value (US$ Mn) Forecast by Material type, 2017-2032

Table 94: MEA Food Recycler Market Volume (Units) Forecast by Material type, 2017-2032

Table 95: MEA Food Recycler Market Value (US$ Mn) Forecast by End Use, 2017-2032

Table 96: MEA Food Recycler Market Volume (Units) Forecast by End Use, 2017-2032
Sneha Verghese
Sneha Verghese

Principal Consultant

Talk to Analyst

Find your sweet spots for generating winning opportunities in this market.

List of Charts

Figure 1: Global Food Recycler Market Value (US$ Mn) by Component, 2022-2032

Figure 2: Global Food Recycler Market Value (US$ Mn) by Price range, 2022-2032

Figure 3: Global Food Recycler Market Value (US$ Mn) by Sales Channels , 2022-2032

Figure 4: Global Food Recycler Market Value (US$ Mn) by Material type, 2022-2032

Figure 5: Global Food Recycler Market Value (US$ Mn) by End Use, 2022-2032

Figure 6: Global Food Recycler Market Value (US$ Mn) by Region, 2022-2032

Figure 7: Global Food Recycler Market Value (US$ Mn) Analysis by Region, 2017-2032

Figure 8: Global Food Recycler Market Volume (Units) Analysis by Region, 2017-2032

Figure 9: Global Food Recycler Market Value Share (%) and BPS Analysis by Region, 2022-2032

Figure 10: Global Food Recycler Market Y-o-Y Growth (%) Projections by Region, 2022-2032

Figure 11: Global Food Recycler Market Value (US$ Mn) Analysis by Component, 2017-2032

Figure 12: Global Food Recycler Market Volume (Units) Analysis by Component, 2017-2032

Figure 13: Global Food Recycler Market Value Share (%) and BPS Analysis by Component, 2022-2032

Figure 14: Global Food Recycler Market Y-o-Y Growth (%) Projections by Component, 2022-2032

Figure 15: Global Food Recycler Market Value (US$ Mn) Analysis by Price range, 2017-2032

Figure 16: Global Food Recycler Market Volume (Units) Analysis by Price range, 2017-2032

Figure 17: Global Food Recycler Market Value Share (%) and BPS Analysis by Price range, 2022-2032

Figure 18: Global Food Recycler Market Y-o-Y Growth (%) Projections by Price range, 2022-2032

Figure 19: Global Food Recycler Market Value (US$ Mn) Analysis by Sales Channels , 2017-2032

Figure 20: Global Food Recycler Market Volume (Units) Analysis by Sales Channels , 2017-2032

Figure 21: Global Food Recycler Market Value Share (%) and BPS Analysis by Sales Channels , 2022-2032

Figure 22: Global Food Recycler Market Y-o-Y Growth (%) Projections by Sales Channels , 2022-2032

Figure 23: Global Food Recycler Market Value (US$ Mn) Analysis by Material type, 2017-2032

Figure 24: Global Food Recycler Market Volume (Units) Analysis by Material type, 2017-2032

Figure 25: Global Food Recycler Market Value Share (%) and BPS Analysis by Material type, 2022-2032

Figure 26: Global Food Recycler Market Y-o-Y Growth (%) Projections by Material type, 2022-2032

Figure 27: Global Food Recycler Market Value (US$ Mn) Analysis by End Use, 2017-2032

Figure 28: Global Food Recycler Market Volume (Units) Analysis by End Use, 2017-2032

Figure 29: Global Food Recycler Market Value Share (%) and BPS Analysis by End Use, 2022-2032

Figure 30: Global Food Recycler Market Y-o-Y Growth (%) Projections by End Use, 2022-2032

Figure 31: Global Food Recycler Market Attractiveness by Component, 2022-2032

Figure 32: Global Food Recycler Market Attractiveness by Price range, 2022-2032

Figure 33: Global Food Recycler Market Attractiveness by Sales Channels , 2022-2032

Figure 34: Global Food Recycler Market Attractiveness by Material type, 2022-2032

Figure 35: Global Food Recycler Market Attractiveness by End Use, 2022-2032

Figure 36: Global Food Recycler Market Attractiveness by Region, 2022-2032

Figure 37: North America Food Recycler Market Value (US$ Mn) by Component, 2022-2032

Figure 38: North America Food Recycler Market Value (US$ Mn) by Price range, 2022-2032

Figure 39: North America Food Recycler Market Value (US$ Mn) by Sales Channels , 2022-2032

Figure 40: North America Food Recycler Market Value (US$ Mn) by Material type, 2022-2032

Figure 41: North America Food Recycler Market Value (US$ Mn) by End Use, 2022-2032

Figure 42: North America Food Recycler Market Value (US$ Mn) by Country, 2022-2032

Figure 43: North America Food Recycler Market Value (US$ Mn) Analysis by Country, 2017-2032

Figure 44: North America Food Recycler Market Volume (Units) Analysis by Country, 2017-2032

Figure 45: North America Food Recycler Market Value Share (%) and BPS Analysis by Country, 2022-2032

Figure 46: North America Food Recycler Market Y-o-Y Growth (%) Projections by Country, 2022-2032

Figure 47: North America Food Recycler Market Value (US$ Mn) Analysis by Component, 2017-2032

Figure 48: North America Food Recycler Market Volume (Units) Analysis by Component, 2017-2032

Figure 49: North America Food Recycler Market Value Share (%) and BPS Analysis by Component, 2022-2032

Figure 50: North America Food Recycler Market Y-o-Y Growth (%) Projections by Component, 2022-2032

Figure 51: North America Food Recycler Market Value (US$ Mn) Analysis by Price range, 2017-2032

Figure 52: North America Food Recycler Market Volume (Units) Analysis by Price range, 2017-2032

Figure 53: North America Food Recycler Market Value Share (%) and BPS Analysis by Price range, 2022-2032

Figure 54: North America Food Recycler Market Y-o-Y Growth (%) Projections by Price range, 2022-2032

Figure 55: North America Food Recycler Market Value (US$ Mn) Analysis by Sales Channels , 2017-2032

Figure 56: North America Food Recycler Market Volume (Units) Analysis by Sales Channels , 2017-2032

Figure 57: North America Food Recycler Market Value Share (%) and BPS Analysis by Sales Channels , 2022-2032

Figure 58: North America Food Recycler Market Y-o-Y Growth (%) Projections by Sales Channels , 2022-2032

Figure 59: North America Food Recycler Market Value (US$ Mn) Analysis by Material type, 2017-2032

Figure 60: North America Food Recycler Market Volume (Units) Analysis by Material type, 2017-2032

Figure 61: North America Food Recycler Market Value Share (%) and BPS Analysis by Material type, 2022-2032

Figure 62: North America Food Recycler Market Y-o-Y Growth (%) Projections by Material type, 2022-2032

Figure 63: North America Food Recycler Market Value (US$ Mn) Analysis by End Use, 2017-2032

Figure 64: North America Food Recycler Market Volume (Units) Analysis by End Use, 2017-2032

Figure 65: North America Food Recycler Market Value Share (%) and BPS Analysis by End Use, 2022-2032

Figure 66: North America Food Recycler Market Y-o-Y Growth (%) Projections by End Use, 2022-2032

Figure 67: North America Food Recycler Market Attractiveness by Component, 2022-2032

Figure 68: North America Food Recycler Market Attractiveness by Price range, 2022-2032

Figure 69: North America Food Recycler Market Attractiveness by Sales Channels , 2022-2032

Figure 70: North America Food Recycler Market Attractiveness by Material type, 2022-2032

Figure 71: North America Food Recycler Market Attractiveness by End Use, 2022-2032

Figure 72: North America Food Recycler Market Attractiveness by Country, 2022-2032

Figure 73: Latin America Food Recycler Market Value (US$ Mn) by Component, 2022-2032

Figure 74: Latin America Food Recycler Market Value (US$ Mn) by Price range, 2022-2032

Figure 75: Latin America Food Recycler Market Value (US$ Mn) by Sales Channels , 2022-2032

Figure 76: Latin America Food Recycler Market Value (US$ Mn) by Material type, 2022-2032

Figure 77: Latin America Food Recycler Market Value (US$ Mn) by End Use, 2022-2032

Figure 78: Latin America Food Recycler Market Value (US$ Mn) by Country, 2022-2032

Figure 79: Latin America Food Recycler Market Value (US$ Mn) Analysis by Country, 2017-2032

Figure 80: Latin America Food Recycler Market Volume (Units) Analysis by Country, 2017-2032

Figure 81: Latin America Food Recycler Market Value Share (%) and BPS Analysis by Country, 2022-2032

Figure 82: Latin America Food Recycler Market Y-o-Y Growth (%) Projections by Country, 2022-2032

Figure 83: Latin America Food Recycler Market Value (US$ Mn) Analysis by Component, 2017-2032

Figure 84: Latin America Food Recycler Market Volume (Units) Analysis by Component, 2017-2032

Figure 85: Latin America Food Recycler Market Value Share (%) and BPS Analysis by Component, 2022-2032

Figure 86: Latin America Food Recycler Market Y-o-Y Growth (%) Projections by Component, 2022-2032

Figure 87: Latin America Food Recycler Market Value (US$ Mn) Analysis by Price range, 2017-2032

Figure 88: Latin America Food Recycler Market Volume (Units) Analysis by Price range, 2017-2032

Figure 89: Latin America Food Recycler Market Value Share (%) and BPS Analysis by Price range, 2022-2032

Figure 90: Latin America Food Recycler Market Y-o-Y Growth (%) Projections by Price range, 2022-2032

Figure 91: Latin America Food Recycler Market Value (US$ Mn) Analysis by Sales Channels , 2017-2032

Figure 92: Latin America Food Recycler Market Volume (Units) Analysis by Sales Channels , 2017-2032

Figure 93: Latin America Food Recycler Market Value Share (%) and BPS Analysis by Sales Channels , 2022-2032

Figure 94: Latin America Food Recycler Market Y-o-Y Growth (%) Projections by Sales Channels , 2022-2032

Figure 95: Latin America Food Recycler Market Value (US$ Mn) Analysis by Material type, 2017-2032

Figure 96: Latin America Food Recycler Market Volume (Units) Analysis by Material type, 2017-2032

Figure 97: Latin America Food Recycler Market Value Share (%) and BPS Analysis by Material type, 2022-2032

Figure 98: Latin America Food Recycler Market Y-o-Y Growth (%) Projections by Material type, 2022-2032

Figure 99: Latin America Food Recycler Market Value (US$ Mn) Analysis by End Use, 2017-2032

Figure 100: Latin America Food Recycler Market Volume (Units) Analysis by End Use, 2017-2032

Figure 101: Latin America Food Recycler Market Value Share (%) and BPS Analysis by End Use, 2022-2032

Figure 102: Latin America Food Recycler Market Y-o-Y Growth (%) Projections by End Use, 2022-2032

Figure 103: Latin America Food Recycler Market Attractiveness by Component, 2022-2032

Figure 104: Latin America Food Recycler Market Attractiveness by Price range, 2022-2032

Figure 105: Latin America Food Recycler Market Attractiveness by Sales Channels , 2022-2032

Figure 106: Latin America Food Recycler Market Attractiveness by Material type, 2022-2032

Figure 107: Latin America Food Recycler Market Attractiveness by End Use, 2022-2032

Figure 108: Latin America Food Recycler Market Attractiveness by Country, 2022-2032

Figure 109: Europe Food Recycler Market Value (US$ Mn) by Component, 2022-2032

Figure 110: Europe Food Recycler Market Value (US$ Mn) by Price range, 2022-2032

Figure 111: Europe Food Recycler Market Value (US$ Mn) by Sales Channels , 2022-2032

Figure 112: Europe Food Recycler Market Value (US$ Mn) by Material type, 2022-2032

Figure 113: Europe Food Recycler Market Value (US$ Mn) by End Use, 2022-2032

Figure 114: Europe Food Recycler Market Value (US$ Mn) by Country, 2022-2032

Figure 115: Europe Food Recycler Market Value (US$ Mn) Analysis by Country, 2017-2032

Figure 116: Europe Food Recycler Market Volume (Units) Analysis by Country, 2017-2032

Figure 117: Europe Food Recycler Market Value Share (%) and BPS Analysis by Country, 2022-2032

Figure 118: Europe Food Recycler Market Y-o-Y Growth (%) Projections by Country, 2022-2032

Figure 119: Europe Food Recycler Market Value (US$ Mn) Analysis by Component, 2017-2032

Figure 120: Europe Food Recycler Market Volume (Units) Analysis by Component, 2017-2032

Figure 121: Europe Food Recycler Market Value Share (%) and BPS Analysis by Component, 2022-2032

Figure 122: Europe Food Recycler Market Y-o-Y Growth (%) Projections by Component, 2022-2032

Figure 123: Europe Food Recycler Market Value (US$ Mn) Analysis by Price range, 2017-2032

Figure 124: Europe Food Recycler Market Volume (Units) Analysis by Price range, 2017-2032

Figure 125: Europe Food Recycler Market Value Share (%) and BPS Analysis by Price range, 2022-2032

Figure 126: Europe Food Recycler Market Y-o-Y Growth (%) Projections by Price range, 2022-2032

Figure 127: Europe Food Recycler Market Value (US$ Mn) Analysis by Sales Channels , 2017-2032

Figure 128: Europe Food Recycler Market Volume (Units) Analysis by Sales Channels , 2017-2032

Figure 129: Europe Food Recycler Market Value Share (%) and BPS Analysis by Sales Channels , 2022-2032

Figure 130: Europe Food Recycler Market Y-o-Y Growth (%) Projections by Sales Channels , 2022-2032

Figure 131: Europe Food Recycler Market Value (US$ Mn) Analysis by Material type, 2017-2032

Figure 132: Europe Food Recycler Market Volume (Units) Analysis by Material type, 2017-2032

Figure 133: Europe Food Recycler Market Value Share (%) and BPS Analysis by Material type, 2022-2032

Figure 134: Europe Food Recycler Market Y-o-Y Growth (%) Projections by Material type, 2022-2032

Figure 135: Europe Food Recycler Market Value (US$ Mn) Analysis by End Use, 2017-2032

Figure 136: Europe Food Recycler Market Volume (Units) Analysis by End Use, 2017-2032

Figure 137: Europe Food Recycler Market Value Share (%) and BPS Analysis by End Use, 2022-2032

Figure 138: Europe Food Recycler Market Y-o-Y Growth (%) Projections by End Use, 2022-2032

Figure 139: Europe Food Recycler Market Attractiveness by Component, 2022-2032

Figure 140: Europe Food Recycler Market Attractiveness by Price range, 2022-2032

Figure 141: Europe Food Recycler Market Attractiveness by Sales Channels , 2022-2032

Figure 142: Europe Food Recycler Market Attractiveness by Material type, 2022-2032

Figure 143: Europe Food Recycler Market Attractiveness by End Use, 2022-2032

Figure 144: Europe Food Recycler Market Attractiveness by Country, 2022-2032

Figure 145: East Asia Food Recycler Market Value (US$ Mn) by Component, 2022-2032

Figure 146: East Asia Food Recycler Market Value (US$ Mn) by Price range, 2022-2032

Figure 147: East Asia Food Recycler Market Value (US$ Mn) by Sales Channels , 2022-2032

Figure 148: East Asia Food Recycler Market Value (US$ Mn) by Material type, 2022-2032

Figure 149: East Asia Food Recycler Market Value (US$ Mn) by End Use, 2022-2032

Figure 150: East Asia Food Recycler Market Value (US$ Mn) by Country, 2022-2032

Figure 151: East Asia Food Recycler Market Value (US$ Mn) Analysis by Country, 2017-2032

Figure 152: East Asia Food Recycler Market Volume (Units) Analysis by Country, 2017-2032

Figure 153: East Asia Food Recycler Market Value Share (%) and BPS Analysis by Country, 2022-2032

Figure 154: East Asia Food Recycler Market Y-o-Y Growth (%) Projections by Country, 2022-2032

Figure 155: East Asia Food Recycler Market Value (US$ Mn) Analysis by Component, 2017-2032

Figure 156: East Asia Food Recycler Market Volume (Units) Analysis by Component, 2017-2032

Figure 157: East Asia Food Recycler Market Value Share (%) and BPS Analysis by Component, 2022-2032

Figure 158: East Asia Food Recycler Market Y-o-Y Growth (%) Projections by Component, 2022-2032

Figure 159: East Asia Food Recycler Market Value (US$ Mn) Analysis by Price range, 2017-2032

Figure 160: East Asia Food Recycler Market Volume (Units) Analysis by Price range, 2017-2032

Figure 161: East Asia Food Recycler Market Value Share (%) and BPS Analysis by Price range, 2022-2032

Figure 162: East Asia Food Recycler Market Y-o-Y Growth (%) Projections by Price range, 2022-2032

Figure 163: East Asia Food Recycler Market Value (US$ Mn) Analysis by Sales Channels , 2017-2032

Figure 164: East Asia Food Recycler Market Volume (Units) Analysis by Sales Channels , 2017-2032

Figure 165: East Asia Food Recycler Market Value Share (%) and BPS Analysis by Sales Channels , 2022-2032

Figure 166: East Asia Food Recycler Market Y-o-Y Growth (%) Projections by Sales Channels , 2022-2032

Figure 167: East Asia Food Recycler Market Value (US$ Mn) Analysis by Material type, 2017-2032

Figure 168: East Asia Food Recycler Market Volume (Units) Analysis by Material type, 2017-2032

Figure 169: East Asia Food Recycler Market Value Share (%) and BPS Analysis by Material type, 2022-2032

Figure 170: East Asia Food Recycler Market Y-o-Y Growth (%) Projections by Material type, 2022-2032

Figure 171: East Asia Food Recycler Market Value (US$ Mn) Analysis by End Use, 2017-2032

Figure 172: East Asia Food Recycler Market Volume (Units) Analysis by End Use, 2017-2032

Figure 173: East Asia Food Recycler Market Value Share (%) and BPS Analysis by End Use, 2022-2032

Figure 174: East Asia Food Recycler Market Y-o-Y Growth (%) Projections by End Use, 2022-2032

Figure 175: East Asia Food Recycler Market Attractiveness by Component, 2022-2032

Figure 176: East Asia Food Recycler Market Attractiveness by Price range, 2022-2032

Figure 177: East Asia Food Recycler Market Attractiveness by Sales Channels , 2022-2032

Figure 178: East Asia Food Recycler Market Attractiveness by Material type, 2022-2032

Figure 179: East Asia Food Recycler Market Attractiveness by End Use, 2022-2032

Figure 180: East Asia Food Recycler Market Attractiveness by Country, 2022-2032

Figure 181: South Asia Food Recycler Market Value (US$ Mn) by Component, 2022-2032

Figure 182: South Asia Food Recycler Market Value (US$ Mn) by Price range, 2022-2032

Figure 183: South Asia Food Recycler Market Value (US$ Mn) by Sales Channels , 2022-2032

Figure 184: South Asia Food Recycler Market Value (US$ Mn) by Material type, 2022-2032

Figure 185: South Asia Food Recycler Market Value (US$ Mn) by End Use, 2022-2032

Figure 186: South Asia Food Recycler Market Value (US$ Mn) by Country, 2022-2032

Figure 187: South Asia Food Recycler Market Value (US$ Mn) Analysis by Country, 2017-2032

Figure 188: South Asia Food Recycler Market Volume (Units) Analysis by Country, 2017-2032

Figure 189: South Asia Food Recycler Market Value Share (%) and BPS Analysis by Country, 2022-2032

Figure 190: South Asia Food Recycler Market Y-o-Y Growth (%) Projections by Country, 2022-2032

Figure 191: South Asia Food Recycler Market Value (US$ Mn) Analysis by Component, 2017-2032

Figure 192: South Asia Food Recycler Market Volume (Units) Analysis by Component, 2017-2032

Figure 193: South Asia Food Recycler Market Value Share (%) and BPS Analysis by Component, 2022-2032

Figure 194: South Asia Food Recycler Market Y-o-Y Growth (%) Projections by Component, 2022-2032

Figure 195: South Asia Food Recycler Market Value (US$ Mn) Analysis by Price range, 2017-2032

Figure 196: South Asia Food Recycler Market Volume (Units) Analysis by Price range, 2017-2032

Figure 197: South Asia Food Recycler Market Value Share (%) and BPS Analysis by Price range, 2022-2032

Figure 198: South Asia Food Recycler Market Y-o-Y Growth (%) Projections by Price range, 2022-2032

Figure 199: South Asia Food Recycler Market Value (US$ Mn) Analysis by Sales Channels , 2017-2032

Figure 200: South Asia Food Recycler Market Volume (Units) Analysis by Sales Channels , 2017-2032

Figure 201: South Asia Food Recycler Market Value Share (%) and BPS Analysis by Sales Channels , 2022-2032

Figure 202: South Asia Food Recycler Market Y-o-Y Growth (%) Projections by Sales Channels , 2022-2032

Figure 203: South Asia Food Recycler Market Value (US$ Mn) Analysis by Material type, 2017-2032

Figure 204: South Asia Food Recycler Market Volume (Units) Analysis by Material type, 2017-2032

Figure 205: South Asia Food Recycler Market Value Share (%) and BPS Analysis by Material type, 2022-2032

Figure 206: South Asia Food Recycler Market Y-o-Y Growth (%) Projections by Material type, 2022-2032

Figure 207: South Asia Food Recycler Market Value (US$ Mn) Analysis by End Use, 2017-2032

Figure 208: South Asia Food Recycler Market Volume (Units) Analysis by End Use, 2017-2032

Figure 209: South Asia Food Recycler Market Value Share (%) and BPS Analysis by End Use, 2022-2032

Figure 210: South Asia Food Recycler Market Y-o-Y Growth (%) Projections by End Use, 2022-2032

Figure 211: South Asia Food Recycler Market Attractiveness by Component, 2022-2032

Figure 212: South Asia Food Recycler Market Attractiveness by Price range, 2022-2032

Figure 213: South Asia Food Recycler Market Attractiveness by Sales Channels , 2022-2032

Figure 214: South Asia Food Recycler Market Attractiveness by Material type, 2022-2032

Figure 215: South Asia Food Recycler Market Attractiveness by End Use, 2022-2032

Figure 216: South Asia Food Recycler Market Attractiveness by Country, 2022-2032

Figure 217: Oceania Food Recycler Market Value (US$ Mn) by Component, 2022-2032

Figure 218: Oceania Food Recycler Market Value (US$ Mn) by Price range, 2022-2032

Figure 219: Oceania Food Recycler Market Value (US$ Mn) by Sales Channels , 2022-2032

Figure 220: Oceania Food Recycler Market Value (US$ Mn) by Material type, 2022-2032

Figure 221: Oceania Food Recycler Market Value (US$ Mn) by End Use, 2022-2032

Figure 222: Oceania Food Recycler Market Value (US$ Mn) by Country, 2022-2032

Figure 223: Oceania Food Recycler Market Value (US$ Mn) Analysis by Country, 2017-2032

Figure 224: Oceania Food Recycler Market Volume (Units) Analysis by Country, 2017-2032

Figure 225: Oceania Food Recycler Market Value Share (%) and BPS Analysis by Country, 2022-2032

Figure 226: Oceania Food Recycler Market Y-o-Y Growth (%) Projections by Country, 2022-2032

Figure 227: Oceania Food Recycler Market Value (US$ Mn) Analysis by Component, 2017-2032

Figure 228: Oceania Food Recycler Market Volume (Units) Analysis by Component, 2017-2032

Figure 229: Oceania Food Recycler Market Value Share (%) and BPS Analysis by Component, 2022-2032

Figure 230: Oceania Food Recycler Market Y-o-Y Growth (%) Projections by Component, 2022-2032

Figure 231: Oceania Food Recycler Market Value (US$ Mn) Analysis by Price range, 2017-2032

Figure 232: Oceania Food Recycler Market Volume (Units) Analysis by Price range, 2017-2032

Figure 233: Oceania Food Recycler Market Value Share (%) and BPS Analysis by Price range, 2022-2032

Figure 234: Oceania Food Recycler Market Y-o-Y Growth (%) Projections by Price range, 2022-2032

Figure 235: Oceania Food Recycler Market Value (US$ Mn) Analysis by Sales Channels , 2017-2032

Figure 236: Oceania Food Recycler Market Volume (Units) Analysis by Sales Channels , 2017-2032

Figure 237: Oceania Food Recycler Market Value Share (%) and BPS Analysis by Sales Channels , 2022-2032

Figure 238: Oceania Food Recycler Market Y-o-Y Growth (%) Projections by Sales Channels , 2022-2032

Figure 239: Oceania Food Recycler Market Value (US$ Mn) Analysis by Material type, 2017-2032

Figure 240: Oceania Food Recycler Market Volume (Units) Analysis by Material type, 2017-2032

Figure 241: Oceania Food Recycler Market Value Share (%) and BPS Analysis by Material type, 2022-2032

Figure 242: Oceania Food Recycler Market Y-o-Y Growth (%) Projections by Material type, 2022-2032

Figure 243: Oceania Food Recycler Market Value (US$ Mn) Analysis by End Use, 2017-2032

Figure 244: Oceania Food Recycler Market Volume (Units) Analysis by End Use, 2017-2032

Figure 245: Oceania Food Recycler Market Value Share (%) and BPS Analysis by End Use, 2022-2032

Figure 246: Oceania Food Recycler Market Y-o-Y Growth (%) Projections by End Use, 2022-2032

Figure 247: Oceania Food Recycler Market Attractiveness by Component, 2022-2032

Figure 248: Oceania Food Recycler Market Attractiveness by Price range, 2022-2032

Figure 249: Oceania Food Recycler Market Attractiveness by Sales Channels , 2022-2032

Figure 250: Oceania Food Recycler Market Attractiveness by Material type, 2022-2032

Figure 251: Oceania Food Recycler Market Attractiveness by End Use, 2022-2032

Figure 252: Oceania Food Recycler Market Attractiveness by Country, 2022-2032

Figure 253: MEA Food Recycler Market Value (US$ Mn) by Component, 2022-2032

Figure 254: MEA Food Recycler Market Value (US$ Mn) by Price range, 2022-2032

Figure 255: MEA Food Recycler Market Value (US$ Mn) by Sales Channels , 2022-2032

Figure 256: MEA Food Recycler Market Value (US$ Mn) by Material type, 2022-2032

Figure 257: MEA Food Recycler Market Value (US$ Mn) by End Use, 2022-2032

Figure 258: MEA Food Recycler Market Value (US$ Mn) by Country, 2022-2032

Figure 259: MEA Food Recycler Market Value (US$ Mn) Analysis by Country, 2017-2032

Figure 260: MEA Food Recycler Market Volume (Units) Analysis by Country, 2017-2032

Figure 261: MEA Food Recycler Market Value Share (%) and BPS Analysis by Country, 2022-2032

Figure 262: MEA Food Recycler Market Y-o-Y Growth (%) Projections by Country, 2022-2032

Figure 263: MEA Food Recycler Market Value (US$ Mn) Analysis by Component, 2017-2032

Figure 264: MEA Food Recycler Market Volume (Units) Analysis by Component, 2017-2032

Figure 265: MEA Food Recycler Market Value Share (%) and BPS Analysis by Component, 2022-2032

Figure 266: MEA Food Recycler Market Y-o-Y Growth (%) Projections by Component, 2022-2032

Figure 267: MEA Food Recycler Market Value (US$ Mn) Analysis by Price range, 2017-2032

Figure 268: MEA Food Recycler Market Volume (Units) Analysis by Price range, 2017-2032

Figure 269: MEA Food Recycler Market Value Share (%) and BPS Analysis by Price range, 2022-2032

Figure 270: MEA Food Recycler Market Y-o-Y Growth (%) Projections by Price range, 2022-2032

Figure 271: MEA Food Recycler Market Value (US$ Mn) Analysis by Sales Channels , 2017-2032

Figure 272: MEA Food Recycler Market Volume (Units) Analysis by Sales Channels , 2017-2032

Figure 273: MEA Food Recycler Market Value Share (%) and BPS Analysis by Sales Channels , 2022-2032

Figure 274: MEA Food Recycler Market Y-o-Y Growth (%) Projections by Sales Channels , 2022-2032

Figure 275: MEA Food Recycler Market Value (US$ Mn) Analysis by Material type, 2017-2032

Figure 276: MEA Food Recycler Market Volume (Units) Analysis by Material type, 2017-2032

Figure 277: MEA Food Recycler Market Value Share (%) and BPS Analysis by Material type, 2022-2032

Figure 278: MEA Food Recycler Market Y-o-Y Growth (%) Projections by Material type, 2022-2032

Figure 279: MEA Food Recycler Market Value (US$ Mn) Analysis by End Use, 2017-2032

Figure 280: MEA Food Recycler Market Volume (Units) Analysis by End Use, 2017-2032

Figure 281: MEA Food Recycler Market Value Share (%) and BPS Analysis by End Use, 2022-2032

Figure 282: MEA Food Recycler Market Y-o-Y Growth (%) Projections by End Use, 2022-2032

Figure 283: MEA Food Recycler Market Attractiveness by Component, 2022-2032

Figure 284: MEA Food Recycler Market Attractiveness by Price range, 2022-2032

Figure 285: MEA Food Recycler Market Attractiveness by Sales Channels , 2022-2032

Figure 286: MEA Food Recycler Market Attractiveness by Material type, 2022-2032

Figure 287: MEA Food Recycler Market Attractiveness by End Use, 2022-2032

Figure 288: MEA Food Recycler Market Attractiveness by Country, 2022-2032

Explore Consumer Product Insights

View Reports